Validating Pharmacophore Models: A Comprehensive Guide to Confirming Predictive Power with Experimental Data
This article provides a comprehensive guide for researchers and drug development professionals on the critical process of pharmacophore model validation.
Validating Pharmacophore Models: A Comprehensive Guide to Confirming Predictive Power with Experimental Data
Abstract
This article provides a comprehensive guide for researchers and drug development professionals on the critical process of pharmacophore model validation. It covers the foundational importance of validation in computational drug discovery, explores established and emerging methodological frameworks for assessing model quality, and details practical troubleshooting strategies to overcome common challenges. A strong emphasis is placed on quantitative validation metrics and comparative analysis against experimental biological data, providing a clear pathway to build confidence in model predictions, de-risk projects, and accelerate the identification of viable lead compounds.
The Critical Role of Validation in Pharmacophore Modeling
In computer-aided drug discovery, pharmacophore models serve as abstract representations of the steric and electronic features essential for molecular recognition and biological activity. These models enable researchers to identify potential drug candidates through virtual screening of compound databases. However, the utility of any pharmacophore model depends entirely on its predictive power and reliability, making rigorous validation an indispensable step in model development. Validation ensures that computational models can accurately distinguish true active compounds from inactive ones, ultimately saving time and resources in downstream experimental testing. This guide examines the key validation methodologies, compares their performance metrics, and provides experimental protocols to help researchers establish confidence in their pharmacophore models.
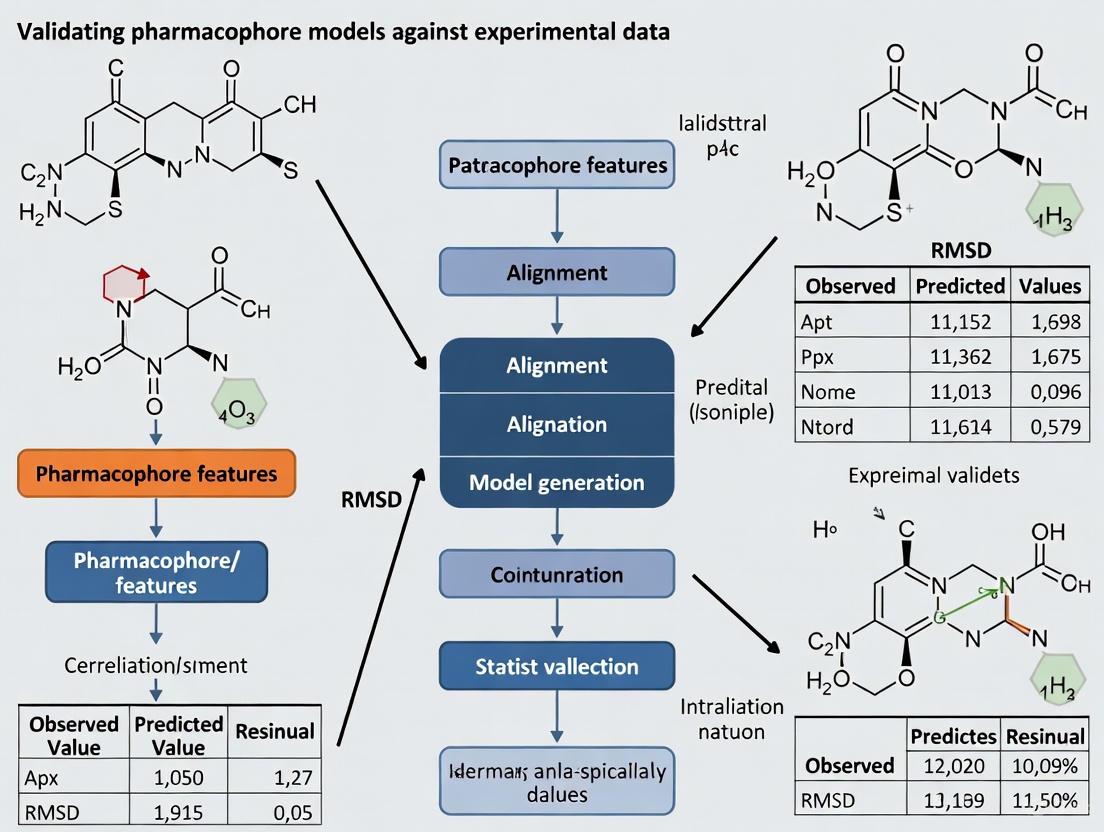
Core Validation Methodologies and Performance Metrics
Pharmacophore model validation employs multiple complementary approaches to assess model quality, predictive capability, and robustness. The table below summarizes the primary validation methods and their key performance indicators.
Table 1: Comprehensive Overview of Pharmacophore Validation Methods
| Validation Method | Key Performance Indicators | Interpretation Guidelines | Strengths | Limitations |
|---|---|---|---|---|
| Decoy-Based Validation | AUC (Area Under Curve), EF (Enrichment Factor) | AUC > 0.9 (excellent), EF1% = 10 indicates 10-fold enrichment of actives in top 1% of screened compounds [1] [2] | Measures model's ability to distinguish active from inactive compounds | Quality depends on decoy set composition; may not reflect real-world screening |
| Test Set Validation | R²pred, rmse (root mean square error) | R²pred > 0.5 indicates acceptable predictive robustness [2] | Evaluates model performance on unseen compounds | Requires carefully curated external test set with diverse chemical structures |
| Cost Analysis | Δ cost (null cost - total cost) | Δ > 60 indicates model does not reflect chance correlation; configuration cost < 17 is satisfactory [2] | Statistical assessment of model significance | Does not directly measure predictive accuracy for new compounds |
| Fisher's Randomization | Statistical significance (p-value) | p < 0.05 indicates model is statistically significant and not result of chance correlation [2] | Robust statistical validation of model significance | Computationally intensive for large datasets |
| Internal Validation | Q² (LOO cross-validation coefficient), rmse | High Q² and low rmse indicate better predictive ability [2] | Uses training set data efficiently without requiring separate test set | May overestimate model performance compared to external validation |
Experimental Protocols for Key Validation Methods
Decoy Set Validation Protocol
Objective: To evaluate the model's ability to distinguish active compounds from inactive molecules (decoys) [1] [2].
Procedure:
- Decoy Generation: Generate decoy molecules using the DUD-E database generator (https://dude.docking.org/generate) with five key parameters: molecular weight, number of rotational bonds, hydrogen bond donor count, hydrogen bond acceptor count, and octanol-water partition coefficient to ensure physical similarity but chemical distinction from active compounds [2].
- Compound Categorization: Screen both active compounds and decoys using the pharmacophore model. Categorize results as:
- True Positive (TP): Active compounds correctly identified
- True Negative (TN): Decoys correctly rejected
- False Positive (FP): Decoys incorrectly identified as actives
- False Negative (FN): Active compounds incorrectly rejected [2]
- Performance Calculation: Generate Receiver Operating Characteristic (ROC) curve and calculate Area Under Curve (AUC). Calculate Enrichment Factor (EF) using the formula:
- EF = (TP / (TP + FN)) / (Selected compounds / Total compounds) [1]
Quality Control: A valid pharmacophore model should achieve AUC > 0.9 and EF1% (enrichment in top 1% of screened compounds) of at least 10 [1].
Test Set Validation Protocol
Objective: To assess model robustness and predictive performance on an independent compound set [2].
Procedure:
- Test Set Selection: Curate a dedicated test set with diversity in chemical structures and bioactivities, ensuring it represents compounds not used in model development.
- Activity Prediction: Apply the pharmacophore model to predict biological activities of test set compounds based on their pharmacophoric features.
- Accuracy Evaluation: Calculate predictive squared correlation coefficient (R²pred) and root mean square error (rmse) using the equations:
- Interpretation: An R²pred value > 0.5 indicates acceptable robustness and predictive capability of the model.
Cost Function Analysis and Fisher's Randomization Protocol
Objective: To verify that the model represents a statistically significant correlation rather than a chance occurrence [2].
Procedure:
- Cost Calculation: Determine three cost components:
- Weight cost: Fluctuation of weight variation with input actual value
- Error cost: Difference between predicted and observed activity of training set
- Configuration cost: Complexity of hypothesis space (should be < 17) [2]
- Significance Assessment: Calculate Δ cost as the difference between null hypothesis cost and total cost. A Δ > 60 indicates the model does not reflect chance correlation.
- Randomization Test:
- Randomly shuffle biological activity values of dataset compounds
- Reapply pharmacophore modeling to randomized datasets
- Generate distribution of correlation coefficients from randomized sets
- Compare original model correlation with randomization distribution
- A p-value < 0.05 indicates statistical significance [2]
Comparative Performance Analysis of Validation Methods
The table below presents quantitative validation data from recent research studies, enabling direct comparison of validation outcomes across different targets and model types.
Table 2: Experimental Validation Data from Recent Studies
| Study Target | Validation Method | Performance Results | Model Type | Reference |
|---|---|---|---|---|
| XIAP Protein (Cancer) | Decoy Set Validation | AUC = 0.98, EF1% = 10.0 | Structure-based pharmacophore | [1] |
| SARS-CoV-2 PLpro | Structure-based with docking concordance | Identified aspergillipeptide F as best inhibitor | Hybrid pharmacophore-docking approach | [3] [4] |
| Acetylcholinesterase (Alzheimer's) | Experimental testing of computational hits | 6 of 9 tested molecules showed strong inhibition (IC₅₀ ≤ control) | Machine learning-enhanced dyphAI protocol | [5] |
| Anti-HBV Flavonols | Specificity testing | 71% sensitivity, 100% specificity against FDA-approved compounds | Ligand-based pharmacophore | [6] |
Research Reagent Solutions for Validation Experiments
Table 3: Essential Research Tools and Resources for Pharmacophore Validation
| Resource/Tool | Function in Validation | Access Information |
|---|---|---|
| DUD-E Database | Generates property-matched decoy molecules for enrichment calculations | https://dude.docking.org/generate [2] |
| LigandScout | Creates and validates structure-based pharmacophore models; performs virtual screening | Commercial software (Inte: Ligand) [3] [1] [6] |
| ZINC Database | Provides commercially available compounds for virtual screening and test set creation | https://zinc.docking.org [5] [7] [8] |
| ChEMBL Database | Source of bioactive compounds with experimental data for model training and testing | https://www.ebi.ac.uk/chembl [6] |
| Protein Data Bank (PDB) | Source of 3D protein structures for structure-based pharmacophore modeling | https://www.rcsb.org [3] |
Workflow Diagram of Comprehensive Validation Strategy
Comprehensive Pharmacophore Validation Workflow
Robust validation is the cornerstone of reliable pharmacophore modeling in drug discovery. The integration of multiple validation methods—including decoy set validation, test set prediction, cost analysis, and statistical testing—provides a comprehensive framework for establishing model predictive power. As demonstrated across various therapeutic targets, rigorously validated pharmacophore models consistently demonstrate superior performance in virtual screening campaigns and higher success rates in experimental verification. The protocols and metrics presented in this guide offer researchers a standardized approach to pharmacophore validation, ultimately enhancing the efficiency and success of structure-based drug design initiatives.
In modern computer-aided drug design (CADD), pharmacophore modeling has emerged as a powerful tool for identifying potential drug candidates by representing the essential three-dimensional arrangement of molecular features necessary for biological activity [9]. These models serve as virtual filters to screen millions of compounds, dramatically reducing the time and resources needed for early drug discovery [10]. However, the predictive power of any pharmacophore model hinges on a crucial, non-negotiable step: rigorous validation. Validation transforms an abstract computational hypothesis into a reliable tool that can effectively bridge the gap between in-silico predictions and experimental reality, ensuring that virtual hits have a genuine probability of demonstrating biological activity in the laboratory [9] [10].
Without proper validation, pharmacophore models risk generating false positives and misleading results, potentially wasting significant research resources on dead-end compounds [10]. This comparison guide examines the methodologies, metrics, and real-world applications of pharmacophore model validation, providing researchers with a framework for evaluating the predictive power of their computational models before committing to costly experimental work.
Methodologies for Pharmacophore Model Validation
Theoretical Validation: Assessing Predictive Power Before Laboratory Testing
Theoretical validation represents the first critical assessment of a pharmacophore model's quality before any wet-lab experimentation [10]. This process evaluates whether a model can successfully distinguish known active compounds from inactive molecules using several established computational approaches:
Decoy-based Testing: This method employs the Database of Useful Decoys (DUDe), which generates chemically similar but physiologically inactive molecules to test the model's discrimination capability [11] [1]. The model's ability to retrieve true actives while excluding these decoys provides a crucial measure of its selectivity [1].
Receiver Operating Characteristic (ROC) Analysis: ROC curves graphically represent a model's ability to balance sensitivity (identifying true actives) against specificity (rejecting inactives) [12]. The Area Under the Curve (AUC) quantifies this performance, where values closer to 1.0 indicate superior discriminatory power [12] [1].
Enrichment Factor (EF) Calculation: The EF measures how effectively a model concentrates active compounds early in the screening process compared to random selection [11] [13]. Higher EF values indicate better performance for practical virtual screening applications where resources are limited [13].
Table 1: Key Metrics for Theoretical Validation of Pharmacophore Models
| Validation Metric | Calculation/Definition | Optimal Values | Interpretation |
|---|---|---|---|
| AUC (Area Under ROC Curve) | Area under sensitivity vs. 1-specificity plot | 0.7-0.8 (Good), 0.8-1.0 (Excellent) [12] | Overall discrimination capability between actives and inactives |
| Enrichment Factor (EF) | (Hitssampled⁄Nsampled) ÷ (Hitstotal⁄Ntotal) | >1 indicates enrichment over random [13] | Ability to concentrate actives in early screening stages |
| Goodness of Hit (GH) Score | Composite measure of recall and precision | 0-1 (Higher values indicate better performance) [14] | Overall quality of virtual screening results |
| Early Enrichment (EF1%) | EF at the top 1% of screened database | 10-100+ (Context dependent) [1] | Early recognition capability valuable for large libraries |
Experimental Workflow for Pharmacophore Validation
The following diagram illustrates the comprehensive validation workflow that bridges in-silico predictions with experimental confirmation:
This workflow demonstrates the iterative nature of pharmacophore validation, where models are refined based on both theoretical metrics and experimental feedback.
Comparative Performance: Validated vs. Non-Validated Models
Case Studies in Validation Success
Recent studies across diverse therapeutic targets demonstrate how rigorous validation creates reliable bridges to experimental success:
Neuroblastoma Treatment Targeting BRD4: Researchers developed a structure-based pharmacophore model to identify natural compounds inhibiting the BRD4 protein [11]. The model was validated with an exceptional AUC of 1.0 and enrichment factors ranging from 11.4 to 13.1, indicating outstanding discriminatory power [11]. This theoretical validation preceded the identification of four natural compounds (ZINC2509501, ZINC2566088, ZINC1615112, and ZINC4104882) that showed promising binding affinity and were further validated through molecular dynamics simulations [11].
Cancer Immunotherapy Targeting PD-L1: In developing inhibitors for the PD-1/PD-L1 immune checkpoint pathway, scientists created a structure-based pharmacophore model from the crystal structure 6R3K [12]. Validation with ROC analysis yielded an AUC of 0.819, confirming the model's ability to distinguish active from inactive compounds [12]. This validation enabled the identification of marine natural compound 51320 as a promising PD-L1 inhibitor, which was subsequently confirmed through molecular docking and dynamics simulations to maintain stable conformation with the target protein [12].
Hepatocellular Carcinoma Targeting XIAP: A structure-based pharmacophore model aimed at identifying natural anti-cancer agents targeting XIAP protein achieved excellent validation metrics with an AUC of 0.98 and early enrichment (EF1%) of 10.0 [1]. This robust theoretical validation preceded the identification of three natural compounds (Caucasicoside A, Polygalaxanthone III, and MCULE-9896837409) that demonstrated stability in molecular dynamics simulations, suggesting their potential as lead compounds for XIAP-related cancers [1].
Benchmark Comparison: Pharmacophore vs. Docking-Based Virtual Screening
A comprehensive benchmark study comparing pharmacophore-based virtual screening (PBVS) against docking-based virtual screening (DBVS) across eight diverse protein targets revealed significant performance differences:
Table 2: Performance Comparison of Virtual Screening Methods Across Eight Targets [13]
| Screening Method | Average Hit Rate at 2% Database | Average Hit Rate at 5% Database | Number of Targets with Superior Enrichment | Key Advantage |
|---|---|---|---|---|
| Pharmacophore-Based (PBVS) | Significantly Higher [13] | Significantly Higher [13] | 14 out of 16 cases [13] | Better early enrichment |
| Docking-Based (DBVS) | Lower [13] | Lower [13] | 2 out of 16 cases [13] | Detailed binding mode analysis |
| Combined Approach | Highest [10] | Highest [10] | N/A | Complementary strengths |
The study concluded that "the PBVS method outperformed DBVS methods in retrieving actives from the databases in our tested targets" [13]. This performance advantage highlights the importance of proper pharmacophore model validation, as well-validated pharmacophore models can significantly enhance virtual screening efficiency.
Experimental Protocols for Comprehensive Validation
ROC Curve Generation Protocol
The Receiver Operating Characteristic (ROC) analysis serves as a fundamental validation method for assessing a pharmacophore model's discrimination ability:
Prepare Test Set: Compile a set of known active compounds (20-50 molecules) and generate decoy molecules using the DUD-E server or similar tools [11] [1]
Screen Database: Perform virtual screening using the pharmacophore model against the combined active and decoy compound set
Calculate Metrics: For each scoring threshold, calculate:
- True Positive Rate (Sensitivity) = TP/(TP+FN)
- False Positive Rate (1-Specificity) = FP/(FP+TN)
- where TP=True Positives, FP=False Positives, TN=True Negatives, FN=False Negatives [12]
Plot ROC Curve: Graph TPR against FPR across all possible thresholds [12]
Calculate AUC: Determine the Area Under the Curve using numerical integration methods [12] [1]
Interpret Results: AUC values of 0.5 suggest random performance, 0.7-0.8 indicate good discrimination, and 0.9-1.0 represent excellent discriminatory power [12]
Experimental Validation Workflow
After theoretical validation, comprehensive experimental confirmation follows this established protocol:
Virtual Screening: Apply the validated pharmacophore model to screen large compound databases (e.g., ZINC, containing over 230 million purchasable compounds) [11] [1]
Molecular Docking: Subject virtual hits to molecular docking studies to evaluate binding modes and affinities with the target protein [11] [12]
ADMET Profiling: Predict absorption, distribution, metabolism, excretion, and toxicity properties using tools like SwissADME or admetSAR [11] [12]
Molecular Dynamics Simulations: Conduct MD simulations (typically 50-200 ns) to assess the stability of protein-ligand complexes [11] [1]
Binding Free Energy Calculations: Perform MM-GBSA or MM-PBSA calculations to quantify binding affinities [11]
In Vitro Testing: Experimentally validate top candidates using biological assays to determine IC50 values and dose-response relationships [15]
The Scientist's Toolkit: Essential Research Reagents and Solutions
Table 3: Essential Resources for Pharmacophore Modeling and Validation
| Resource/Solution | Function in Validation | Specific Examples | Key Features |
|---|---|---|---|
| Decoy Database | Provides inactive molecules for selectivity testing | DUD-E (Database of Useful Decoys) [11] [1] | Matches physico-chemical properties but dissimilar topology |
| Compound Database | Source of molecules for virtual screening | ZINC database [11] [1] | 230+ million purchasable compounds, ready for docking |
| Validation Software | Calculate enrichment metrics and ROC curves | LigandScout [11] [1] | Automated pharmacophore creation and validation |
| Docking Tools | Confirm binding modes of virtual hits | AutoDock [12], GOLD [13], Glide [13] | Multiple algorithms for consensus docking |
| Dynamics Software | Assess complex stability | GROMACS, AMBER, Desmond | Nanosecond-scale simulations for stability validation |
| ADMET Prediction | Evaluate drug-like properties | SwissADME, admetSAR, PreADMET | Early toxicity and pharmacokinetics assessment |
The evidence from comparative studies and real-world applications consistently demonstrates that comprehensive validation is not an optional extra but an essential requirement for successful pharmacophore modeling. Proper validation through ROC analysis, enrichment calculations, and experimental confirmation transforms computational hypotheses into reliable tools that effectively bridge the in-silico and experimental realms [11] [12] [1].
The benchmark studies revealing pharmacophore-based screening's superiority over docking-based approaches in many scenarios further underscore the importance of rigorous validation practices [13]. As pharmacophore modeling continues to evolve toward addressing more complex challenges like protein-protein interactions and polypharmacology, robust validation methodologies will remain the critical foundation ensuring these computational approaches generate biologically relevant results worthy of experimental investigation [9] [10].
In computational drug discovery, pharmacophore models serve as essential abstract representations of the molecular features necessary for a ligand to interact with a biological target. However, the predictive power and real-world applicability of these models hinge entirely on rigorous validation, grounded in the core statistical principles of sensitivity and specificity, and the overarching imperative to avoid overfitting. Overfitting creates models that perform exceptionally well on training data but fail to generalize to real-world scenarios, ultimately compromising their predictive reliability [16]. This guide provides a comparative analysis of validation methodologies and performance metrics, drawing on recent research to outline robust experimental protocols for ensuring that pharmacophore models are both accurate and trustworthy for drug development professionals.
Quantitative Performance Comparison of Pharmacophore Models
The evaluation of a pharmacophore model's performance requires a multifaceted approach, examining its ability to correctly identify active compounds (sensitivity) while rejecting inactive ones (specificity). The following table summarizes key metrics and their reported values from recent studies.
Table 1: Key Performance Metrics for Pharmacophore Model Validation
| Metric | Definition | Interpretation | Reported Value (Example) |
|---|---|---|---|
| Sensitivity | Proportion of true actives correctly identified by the model [17]. | High sensitivity indicates a low false negative rate; the model misses few potential hits. | 71% for an anti-HBV flavonol model [6]. |
| Specificity | Proportion of true decoys (inactives) correctly rejected by the model [17]. | High specificity indicates a low false positive rate; the model filters out irrelevant compounds well. | 100% for an anti-HBV flavonol model [6]. |
| Enrichment Factor (EF) | Measures how much more concentrated actives are in the hit list compared to a random selection [17]. | An EF >1 indicates the model enriches for active compounds. | Calculated from screening libraries [17]. |
| Goodness of Hit (GH) | A composite score balancing the recall of actives and the false positive rate [17]. | A score closer to 1.0 indicates a high-quality, balanced model. | Calculated from sensitivity and specificity data [17]. |
The performance of a model can vary significantly based on its design and application. For instance, a structure-based pharmacophore model for Focal Adhesion Kinase 1 (FAK1) inhibitors was validated using 114 active compounds and 571 decoys from the DUD-E database, with its sensitivity and specificity calculated using standard formulas [17]. In a separate study, a flavonol-based pharmacophore model targeting Hepatitis B Virus (HBV) demonstrated a sensitivity of 71% and a perfect specificity of 100% when validated against a set of FDA-approved chemicals, highlighting its exceptional ability to avoid false positives [6].
Detailed Experimental Protocols for Model Validation
A robust validation protocol is critical for generating reliable performance metrics. The following sections detail common methodologies used in pharmacophore modeling and the subsequent steps to avoid overfitting.
Structure-Based Pharmacophore Modeling and Validation
This protocol uses a known protein-ligand complex to derive critical interaction features.
- Step 1: Structure Preparation. Obtain the co-crystal structure of the target protein with a bound ligand from the Protein Data Bank (PDB). Model any missing residues using software like MODELLER, and select the model with the lowest Discrete Optimized Protein Energy (zDOPE) score for further analysis [17].
- Step 2: Pharmacophore Generation. Upload the protein-ligand complex to a tool such as Pharmit. The software will identify critical pharmacophoric features (e.g., hydrogen bond donors/acceptors, hydrophobic regions, aromatic rings). Generate multiple candidate models, each containing a different set of 5-6 features [17].
- Step 3: Model Validation with Actives and Decoys. This is the critical step for calculating sensitivity and specificity.
- Library Curation: Download a set of known active compounds and a set of decoy molecules for your target from a database like DUD-E (Directory of Useful Decoys - Enhanced) [17].
- Virtual Screening: Screen both the active and decoy libraries against each of your candidate pharmacophore models.
- Statistical Analysis: Calculate sensitivity (True Positive Rate), specificity (True Negative Rate), Enrichment Factor (EF), and Goodness of Hit (GH) for each model. The model with the highest validation performance (balancing high sensitivity and specificity) is selected for further virtual screening [17].
Addressing Overfitting Through Data Handling and Validation Strategies
Overfitting occurs when a model learns the noise in the training data rather than the underlying pattern. The following practices are essential for mitigation.
- Proper Data Splitting: Data splitting strategies are a primary defense against overfitting. Using a split based on the Butina algorithm or scaffold splitting provides a more challenging and realistic benchmark than a simple random split, as it tests the model's ability to generalize to entirely new chemical scaffolds [18].
- Cautious Hyperparameter Tuning: Extensive optimization of model hyperparameters (e.g., for a Graph Neural Network like ChemProp) can lead to overfitting, particularly on small datasets. Using a preselected set of hyperparameters can sometimes produce models with similar or even better generalizability than those obtained through exhaustive grid optimization [18].
- External Validation: The most critical step is to evaluate the final model on a completely external dataset that was not used in any part of the model building or training process. This provides the best estimate of how the model will perform in a real-world setting [16].
- Adopting Robust Validation Frameworks: Tools like ML-AMPSIT leverage multiple machine learning methods to build surrogate models for sensitivity analysis, helping to identify the most important parameters and reduce over-reliance on a single model's output [19].
Workflow Visualization: Pharmacophore Validation and Overfitting Avoidance
The following diagram illustrates the integrated workflow for developing and validating a pharmacophore model, highlighting key steps to prevent overfitting.
Diagram 1: Pharmacophore model development and validation workflow, showing key overfitting avoidance checkpoints.
Successful pharmacophore modeling relies on a suite of computational tools and databases. The table below lists key resources mentioned in recent literature.
Table 2: Essential Reagents and Resources for Pharmacophore Research
| Resource Name | Type | Primary Function in Validation | Example Use Case |
|---|---|---|---|
| DUD-E Database [17] | Online Database | Provides curated sets of active compounds and decoys for a wide range of biological targets. | Used for calculating the sensitivity and specificity of a FAK1 pharmacophore model [17]. |
| ZINC Database [5] [20] | Commercial Compound Library | A large, publicly available database of purchasable compounds for virtual screening to identify novel hits. | Screened to discover new acetylcholinesterase inhibitors [5] and MAO inhibitors [20]. |
| Pharmit [17] | Web Tool | Performs structure-based pharmacophore generation and provides a platform for virtual screening and model validation. | Used to create and screen pharmacophore models for FAK1 [17]. |
| LigandScout [6] | Software | Enables the development of both ligand-based and structure-based pharmacophore models from molecular data. | Utilized to establish a flavonol-based pharmacophore model for anti-HBV activity [6]. |
| ML-AMPSIT [19] | Computational Tool | A machine learning-based tool for parameter sensitivity and importance analysis, aiding in robust model calibration. | Helps quantify the impact of input parameter variations on model output, reducing overfitting risk. |
The journey from a computational pharmacophore model to a reliable tool for drug discovery is paved with rigorous validation. As this guide has detailed, this process is non-negotiable and must be anchored by the quantitative assessment of sensitivity and specificity, and a relentless focus on strategies to avoid overfitting. By adhering to robust experimental protocols—including proper data splitting, cautious hyperparameter tuning, and, most importantly, external validation—researchers can ensure their models possess not just apparent accuracy on training data, but genuine predictive power for identifying novel therapeutic candidates. In an era of increasingly complex models and algorithms, these core principles remain the bedrock of trustworthy computational science.
In the rigorous field of computer-aided drug design, pharmacophore models serve as abstract blueprints defining the essential steric and electronic features a molecule must possess to interact with a biological target [21]. However, the predictive power of these models is entirely contingent on the quality of their validation. When validation against robust experimental data is inadequate, the consequences cascade through the entire drug discovery pipeline, leading to significant resource depletion and the pursuit of non-viable chemical leads.
The Critical Role of Validation in Pharmacophore Modeling
A pharmacophore model reduces complex molecular interactions to a set of critical features—such as hydrogen bond donors (HBD), hydrogen bond acceptors (HBA), hydrophobic areas (H), and ionizable groups (PI/NI)—that are necessary for biological activity [21]. These models can be built using either a structure-based approach (relying on the 3D structure of the target protein) or a ligand-based approach (derived from a set of known active ligands) [21].
The principle of "Garbage In, Garbage Out" (GIGO) is acutely relevant here. The quality of the model's output is fundamentally dependent on the quality of the input data and the rigor of the validation process [22]. Poor data quality at the input stage, including inaccurate, incomplete, or non-representative structural or activity data, inevitably produces a flawed model. Subsequent decisions based on such a model are built on a shaky foundation, compromising the entire project.
The financial and operational toll of basing research on poorly validated models is substantial. The following table summarizes the key areas of waste identified in scientific and industry analyses:
Table 1: Consequences of Poor Pharmacophore Model Validation
| Impact Area | Specific Consequences | Supporting Data |
|---|---|---|
| Financial Costs | Wasted resources on synthesizing and testing non-viable leads; missed business opportunities. | Poor data quality costs organizations an average of $12.9 - $13.3 million annually [22] [23]. |
| Time & Productivity | Scientists and managers spend excessive time hunting for data, validating accuracy, or cleaning up errors. | Data-intensive businesses waste 50% of time on data-related tasks instead of research [22]. Data scientists spend 80% of their time finding and cleaning data [22]. |
| Operational Efficiency | Delayed project timelines; need for extensive data re-validation and manual correction of screening results. | Labor productivity can drop by up to 20% due to data issues [23]. Up to 40% of companies fail to meet business goals due to flawed data [23]. |
| Strategic Missteps | Misallocation of resources to unpromising chemical series; compromised competitive positioning. | Only 3% of companies' data meets basic quality standards, undermining strategic planning [22]. |
Case Studies: Misguided Lead Optimization in Practice
The Challenge of Demanding Targets
Benchmarking studies on pharmaceutically relevant targets like the A2A adenosine receptor (AA2AR) and heat shock protein 90 (HSP90) have shown that default molecular docking scoring functions often perform poorly, failing to enrich active ligands at the top of virtual screening lists [24]. If a pharmacophore model used for lead optimization is validated solely against these flawed docking poses without experimental correlation, it will perpetuate the same errors. This directs medicinal chemists to optimize compounds based on incorrect interaction hypotheses, wasting months of synthetic effort [24].
The Pitfalls of Incomplete Feature Selection
In a study focused on optimizing Estrogen Receptor beta binders, researchers highlighted that a robust Quantitative Structure-Activity Relationship (QSAR) model must balance predictive accuracy with mechanistic interpretation [25]. A poorly validated model might miss critical synergisms between features, such as the role of specific sp2-hybridized carbon and nitrogen atoms alongside lipophilic features [25]. Lead optimization guided by such a model would focus on the wrong molecular features, leading to costly cycles of analog synthesis with diminishing returns.
Best Practices for Rigorous Experimental Validation
To avoid the pitfalls of poor validation, the following methodologies and protocols are essential for integrating experimental data into the pharmacophore modeling workflow.
Structure-Based Validation Protocols
Methodology: When a protein-ligand co-crystal structure is available, it provides the most direct source for validation [21].
- Protein Preparation: The 3D protein structure from the PDB must be critically prepared, evaluating protonation states, adding hydrogen atoms, and correcting for any missing residues or atoms [21].
- Binding Site Analysis: The ligand-binding site must be defined, preferably using the coordinates of a co-crystallized ligand. Tools like GRID or LUDI can be used to map interaction hotspots [21].
- Experimental Cross-Checking: The generated pharmacophore features must be cross-referenced with the actual interactions observed in the experimental structure (e.g., hydrogen bonds with key residues, hydrophobic contacts). Features that do not correspond to energetically favorable or conserved interactions should be rejected [21].
Enrichment-Driven Optimization and Benchmarking
Methodology: This powerful technique uses known active and inactive/decoy compounds to quantitatively test a model's performance [24].
- Dataset Curation: A high-quality benchmark set, such as those from the DUDE-Z database, is required. This set contains confirmed active ligands and property-matched decoy compounds that are chemically similar but physiologically inactive [24].
- Validation Workflow: The pharmacophore model is used to screen the benchmark set. Its ability to correctly rank active compounds highly while discarding decoys is measured.
- Model Refinement: The model's features and spatial tolerances are iteratively refined to maximize the enrichment of known actives. Advanced methods like the O-LAP algorithm use this approach to optimize shape-focused models by clustering docked active ligands [24].
The logical workflow for rigorous validation is outlined below:
Integration with Molecular Dynamics and Water Mapping
Methodology: Moving beyond static structures, molecular dynamics (MD) simulations provide a dynamic validation framework.
- Simulation Setup: Run MD simulations (e.g., using AMBER or GROMACS) of the apo (ligand-free) protein or protein-ligand complexes in an explicit solvent [26].
- Dynamic Pharmacophore (Dynophore) Generation: Analyze the simulation trajectory to extract interaction points and their frequency, creating a dynamic pharmacophore model [26].
- Water-Based Feature Identification: In apo simulations, the behavior of explicit water molecules in the binding site can be converted into pharmacophore features using tools like PyRod. This "water pharmacophore" maps interaction hotspots and can validate the relevance of features in a model intended for a solvated pocket [26].
The Scientist's Toolkit: Essential Research Reagents and Solutions
The following tools and databases are critical for conducting the rigorous validation protocols described above.
Table 2: Essential Research Tools for Pharmacophore Validation
| Tool / Resource | Type | Primary Function in Validation |
|---|---|---|
| RCSB Protein Data Bank (PDB) | Database | Provides experimental 3D structures of proteins and protein-ligand complexes for structure-based model building and cross-validation [21]. |
| DUDE-Z / DUD-E Database | Database | Supplies benchmark sets of known active and decoy molecules for quantitative performance testing and enrichment calculations [24]. |
| Molecular Dynamics Software(e.g., AMBER, GROMACS) | Software Suite | Simulates protein and ligand dynamics in a solvated environment to validate model stability and identify dynamic interaction features [26]. |
| PyRod | Software Tool | Converts data from MD simulations of apo proteins into water-based pharmacophore models, offering an alternative validation perspective [26]. |
| O-LAP Algorithm | Software Tool | Generates and optimizes shape-focused pharmacophore models through graph clustering and enrichment-driven benchmarking [24]. |
| PLANTS | Software Tool | Performs flexible molecular docking to generate ligand poses which can serve as input for model building and as a negative control for validation [24]. |
| GRID / LUDI | Software Tool | Analyses protein binding sites to map molecular interaction fields, helping to validate the chemical relevance of hypothesized pharmacophore features [21]. |
In pharmacophore-based drug discovery, the line between a successful lead optimization campaign and a costly failure is often drawn by the rigor of validation. The consequences of poor validation are not merely theoretical; they are quantifiable in millions of dollars wasted, months of lost productivity, and ultimately, misguided scientific efforts. By adopting a multi-faceted validation strategy that integrates experimental structures, rigorous benchmark sets, and dynamic simulations, researchers can transform their pharmacophore models from potential liabilities into reliable, strategic assets that genuinely accelerate the journey to a clinical candidate.
A Practical Framework for Pharmacophore Model Validation
In computational drug design, a pharmacophore model abstractly represents the spatial and electronic features of a ligand that are crucial for its biological interaction [27]. The predictive accuracy and reliability of these models are paramount, as they are employed in virtual screening to identify potential drug candidates from extensive chemical databases [4]. Validation separates useful models from those that may lead researchers astray, ensuring that computational predictions translate to real-world biological activity. Without rigorous validation, pharmacophore models risk high false-positive rates, misallocating valuable experimental resources [27] [17].
Among the various statistical methods available, Receiver Operating Characteristic (ROC) curves and Area Under the Curve (AUC) analysis have emerged as the gold standard for evaluating the discriminatory power of pharmacophore models [12] [1]. These techniques provide a robust, quantitative framework for assessing a model's ability to distinguish between truly active compounds and inactive decoys, offering a critical benchmark before proceeding to costly experimental stages [17].
Theoretical Foundations of ROC and AUC Analysis
The ROC Curve and Its Interpretation
The ROC curve is a graphical plot that illustrates the diagnostic ability of a binary classifier system, such as a pharmacophore model used for virtual screening. It is created by plotting the True Positive Rate (TPR), or Sensitivity, against the False Positive Rate (FPR), or (1 - Specificity), across a series of classification thresholds [12] [27].
- Sensitivity (True Positive Rate): This measures the model's ability to correctly identify active compounds. It is calculated as the number of true positives divided by the sum of true positives and false negatives (
Sensitivity = (Ha / A) * 100) [17]. A model with high sensitivity successfully retrieves most of the known active molecules from a database. - Specificity (True Negative Rate): This measures the model's ability to correctly reject inactive compounds or decoys. It is calculated as the number of true negatives divided by the sum of true negatives and false positives [17]. High specificity indicates that the model generates few false alarms.
As the threshold for considering a compound a "hit" is varied, the resulting pairs of TPR and FPR values generate the ROC curve. A model with no discriminatory power, equivalent to random selection, will produce a diagonal line from the bottom-left to the top-right corner. Conversely, a model with perfect discrimination will curve sharply towards the top-left corner [12] [28].
AUC as a Performance Metric
The Area Under the ROC Curve (AUC) provides a single, scalar value to summarize the overall performance of the model. The AUC value ranges from 0 to 1, offering a threshold-independent measure of quality [28] [1].
- AUC = 1.0: Represents a perfect classifier. All active compounds are ranked above all inactive decoys.
- AUC = 0.5: Indicates a classifier with no discriminatory power, equivalent to random guessing.
- AUC > 0.7: Generally considered to indicate acceptable discrimination [29].
- AUC > 0.8: Suggests good model performance [12].
- AUC ≥ 0.98: Reflects excellent or outstanding performance, closely approximating an ideal classifier [1].
The AUC is particularly valuable in virtual screening because it evaluates the model's ranking capability, which is often more important than a binary classification at a fixed threshold. A higher AUC signifies a greater probability that a randomly chosen active compound will be ranked higher than a randomly chosen inactive compound by the model [27].
Experimental Protocols for ROC and AUC Validation
Workflow for Model Validation
The validation of a pharmacophore model using ROC curves follows a systematic protocol to ensure unbiased and reproducible results. The following diagram illustrates the key stages of this process.
Key Experimental Steps
Preparation of Active and Decoy Compound Sets: The first critical step involves curating a reliable validation dataset.
- Active Compounds: A set of known active compounds against the target protein is collected from literature and biochemical databases like ChEMBL [11] [1]. These compounds serve as true positives that the model should ideally identify. For example, a study targeting XIAP protein used 10 known active antagonists for validation [1].
- Decoy Compounds: A corresponding set of decoy molecules, which are chemically similar but physiologically inactive, is generated from specialized databases such as the Directory of Useful Decoys - Enhanced (DUD-E) [11] [17]. Decoys act as true negatives, testing the model's ability to avoid false positives.
Virtual Screening and Performance Calculation: The pharmacophore model is used to screen the combined set of active and decoy compounds. The results are tabulated into a confusion matrix, and key metrics are calculated using the following formulas [17]:
- Sensitivity (True Positive Rate):
Sensitivity = (Ha / A) * 100 - Specificity:
Specificity = (Hd / D) * 100(WhereHais the number of active compounds retrieved,Ais the total number of active compounds,Hdis the number of decoys not retrieved, andDis the total number of decoys).
- Sensitivity (True Positive Rate):
ROC Curve Generation and AUC Calculation: The screening results are analyzed across all possible thresholds to generate the ROC curve. The AUC is then computed, often using tools integrated within molecular modeling software like LigandScout or Maestro [28] [29]. The calculated AUC and the shape of the ROC curve provide a direct visual and quantitative assessment of the model's quality.
Comparative Performance Data from Case Studies
ROC and AUC analysis has been successfully implemented across diverse drug discovery projects. The table below summarizes quantitative validation data from recent studies, demonstrating the application of this gold-standard technique.
Table 1: Comparative AUC and Enrichment Factors from Recent Pharmacophore Studies
| Target Protein | Research Objective | AUC Value | Enrichment Factor (EF) | Key Outcome |
|---|---|---|---|---|
| Brd4 [11] | Identify neuroblastoma inhibitors | 1.0 | 11.4 - 13.1 | Excellent performance; identified 4 natural compounds |
| XIAP [1] | Identify anti-cancer agents | 0.98 | 10.0 (at 1% threshold) | Excellent performance; identified 3 stable compounds |
| PD-L1 [12] | Identify immune-oncology inhibitors | 0.819 | Information Not Specified | Good performance; identified marine natural compound 51320 |
| FGFR1 [28] | Identify kinase inhibitors for cancer | Model "high discriminatory power" | Information Not Specified | Successful identification of novel inhibitors |
Analysis of Comparative Data
The data illustrates how AUC values directly correlate with model confidence and screening success. The Brd4 study achieved a perfect AUC of 1.0, which signified an exceptional ability to distinguish actives from decoys and led to the identification of four promising natural compounds with low predicted side effects [11]. Similarly, the XIAP model, with an AUC of 0.98, demonstrated near-perfect classification, resulting in three stable lead compounds validated by molecular dynamics simulation [1]. The PD-L1 model, with a solid AUC of 0.819, provided good discriminatory power, enabling the discovery of a marine natural product as a potential small-molecule inhibitor [12]. These case studies confirm that AUC is a critical and reliable predictor of a pharmacophore model's utility in a practical drug discovery pipeline.
Advanced Metrics and Complementary Validation Techniques
Beyond AUC: Enrichment Factors and GH Score
While AUC provides an overall measure of performance, other metrics offer additional insights, particularly in the early stages of virtual screening where identifying a small number of top-ranked actives is crucial.
- Enrichment Factor (EF): The EF measures how much more likely a model is to find active compounds compared to random selection in a given top fraction of the screened database (e.g., the top 1%). It is calculated as
EF = (Ha / N) / (A / T), whereNis the number of compounds selected from the top of the list, andTis the total number of compounds in the database [11] [17]. A study on Brd4 inhibitors reported excellent EF values ranging from 11.4 to 13.1, indicating high enrichment of active compounds in the top ranks [11]. - Goodness of Hit (GH) Score: The GH score is a composite metric that combines recall (sensitivity) and precision to evaluate the early enrichment capability of a model. A score of 1 represents ideal enrichment, while a score of 0 indicates no enrichment [30] [17].
Integration with Other Validation Methods
ROC/AUC analysis is often used in conjunction with other computational techniques to form a comprehensive validation framework.
- Molecular Docking: Validated pharmacophore models are frequently used to generate a focused compound library, which is then subjected to molecular docking to predict binding poses and affinities, as seen in studies targeting FAK1 and SARS-CoV-2 PLpro [4] [17].
- Molecular Dynamics (MD) Simulations: Top-ranking hits from docking can be further analyzed using MD simulations. This technique assesses the stability of the protein-ligand complex over time and provides more accurate binding free energy calculations via methods like MM-GBSA and MM-PBSA [11] [17].
Essential Research Reagents and Computational Tools
The experimental validation of pharmacophore models relies on a suite of specialized software tools and databases. The following table details key "research reagents" essential for conducting ROC and AUC analysis.
Table 2: Key Computational Tools and Databases for Pharmacophore Validation
| Tool / Database Name | Type | Primary Function in Validation |
|---|---|---|
| DUD-E [1] [17] | Database | Provides benchmark sets of known active compounds and matched decoys for unbiased validation. |
| ZINC Database [11] [1] | Database | A large, commercially available compound library used for virtual screening after model validation. |
| LigandScout [11] [29] | Software | Used for structure-based and ligand-based pharmacophore modeling, and includes ROC analysis for validation. |
| Schrödinger Suite [28] | Software | Integrated drug discovery platform used for pharmacophore modeling, molecular docking, and simulation. |
| Pharmit [17] [31] | Online Tool | A web-based resource for structure-based pharmacophore modeling and high-throughput virtual screening. |
| AutoDock Vina [4] | Software | A widely used molecular docking program for predicting binding modes and affinities of hit compounds. |
| GROMACS [17] | Software | A molecular dynamics simulation package used to study the stability and dynamics of protein-ligand complexes. |
ROC curve analysis and AUC quantification represent the gold standard for validating pharmacophore models in computer-aided drug design. As demonstrated by numerous case studies across various therapeutic targets, these metrics provide an objective, quantitative, and reliable measure of a model's ability to distinguish active from inactive compounds. The consistent correlation between high AUC values and successful downstream identification of novel bioactive agents underscores the critical importance of this validation step. Integrating ROC/AUC analysis with molecular docking, dynamics simulations, and experimental assays creates a powerful, multi-tiered validation framework that enhances the efficiency and success rate of modern drug discovery pipelines.
In modern computational drug discovery, pharmacophore modeling serves as a crucial framework for identifying and optimizing novel therapeutic compounds. A pharmacophore represents an abstract description of molecular features essential for biological recognition, comprising hydrogen bond donors/acceptors, hydrophobic regions, and charged groups spatially arranged to complement a biological target [27]. As these models transition from theoretical constructs to practical screening tools, rigorous validation becomes paramount to ensure their predictive capability and reliability. This validation process quantitatively assesses how effectively a pharmacophore hypothesis can distinguish active compounds from inactive molecules in virtual screening campaigns, with Enrichment Factor (EF) and Goodness-of-Hit (GH) score emerging as the two cornerstone metrics for this evaluation [32] [33].
The critical importance of EF and GH scores extends beyond mere model validation—they provide crucial insights into the cost-effectiveness and probable success of subsequent experimental phases. In a typical virtual screening workflow, thousands to millions of compounds are evaluated computationally before selecting a handful for experimental testing. Without robust validation metrics, researchers risk squandering significant resources on compounds unlikely to display activity. The EF quantitatively measures how much better a pharmacophore model performs compared to random selection, while the GH score provides a balanced assessment that considers both the yield of actives and the false-negative rate [34] [35]. Together, these metrics form a statistical foundation for prioritizing which pharmacophore models to trust and which to refine or discard, ultimately accelerating the identification of novel drug candidates across therapeutic areas including cancer, metabolic disorders, and inflammatory diseases [32] [36] [33].
Theoretical Foundations of Key Metrics
The Enrichment Factor (EF)
The Enrichment Factor (EF) quantifies the performance of a virtual screening method by measuring how effectively it concentrates active compounds early in the screening rank list compared to random selection. The calculation measures the ratio of found actives in a selected top fraction of the screened database to the number of actives expected in that same fraction by random chance [37] [34]. The mathematical expression for EF is:
EF = (Hitₛₐₘₚₗₑ / Nₛₐₘₚₗₑ) / (Hitₜₒₜₐₗ / Nₜₒₜₐₗ)
Where:
- Hitₛₐₘₚₗₑ = Number of active compounds in the top subset of the ranked database
- Nₛₐₘₚₗₑ = Total number of compounds in the top subset screened
- Hitₜₒₜₐₗ = Total number of active compounds in the entire database
- Nₜₒₜₐₗ = Total number of compounds in the entire database
An EF value of 1.0 indicates random performance, while values exceeding 1.0 demonstrate increasingly superior enrichment. For example, in a study identifying cyclooxygenase-2 (COX-2) inhibitors, researchers achieved EF values significantly greater than 1, confirming their model's ability to prioritize bioactive compounds efficiently [32]. The EF is particularly valuable because it directly translates to practical screening efficiency—a high EF means fewer compounds need to be experimentally tested to identify the same number of hits, substantially reducing resource expenditure in early drug discovery [37] [34].
The Goodness-of-Hit (GH) Score
The Goodness-of-Hit (GH) score provides a more nuanced assessment by incorporating both the recovery of active compounds and the penalty for missing actives (false negatives). This metric, introduced by Güner and Henry, ranges from 0 to 1, where higher values indicate better overall performance [35]. The GH score is calculated using three component metrics:
GH = [(3/4 × Ha + 1/4 × Ya) × Ha] / (Htₐ × Htₜₒₜₐₗ)
Where the components are derived from:
- Ha = Number of active compounds in the hit list
- Ht = Total number of compounds in the hit list
- A = Total number of active compounds in the database
- D = Total number of compounds in the database
The GH score effectively balances sensitivity and specificity by rewarding models that retrieve a high proportion of available actives while maintaining a reasonable hit list size. This prevents misleadingly high EF values that can occur with extremely small hit lists containing only a few actives. In the context of TGR5 agonist identification, researchers utilized the GH score alongside EF to validate their pharmacophore model, ensuring it identified genuine actives without excessive false positives [35]. The incorporation of both metrics provides a more comprehensive validation framework than either metric alone.
Table 1: Core Equations for Key Validation Metrics
| Metric | Formula | Interpretation | Optimal Range |
|---|---|---|---|
| Enrichment Factor (EF) | EF = (Hitₛₐₘₚₗₑ/Nₛₐₘₚₗₑ) / (Hitₜₒₜₐₗ/Nₜₒₜₐₗ) | Measures concentration of actives in top fraction | >1 (Higher is better) |
| Goodness-of-Hit (GH) | GH = [(3/4×Ha + 1/4×Ya)×Ha] / (Htₐ×Htₜₒₜₐₗ) | Balances active recovery with false negatives | 0-1 (Closer to 1 is better) |
| Yield of Actives (%A) | %A = (Ha/Ht) × 100 | Percentage of actives in hit list | Higher percentage preferred |
| Enrichment Factor (Alternate) | EF = (Ha/Ht) / (A/D) | Simpler form for quick calculation | >1 (Higher is better) |
Experimental Protocols for Metric Calculation
Establishing a Proper Decoy Set
The foundation of reliable EF and GH calculation lies in the careful construction of a decoy set—a collection of presumed inactive molecules used to assess the pharmacophore model's discriminatory power. The Directory of Useful Decoys (DUD) exemplifies this approach by providing decoys that match the physical properties of active compounds (molecular weight, logP, hydrogen bonding characteristics) while differing in molecular topology to ensure they are unlikely binders [37]. This careful matching prevents artificial inflation of enrichment metrics that can occur when decoys differ substantially from actives in trivial physical properties. For example, in a GPCR-focused study, researchers emphasized that decoys must "resemble the physical properties of the annotated ligands well enough so that enrichment is not simply a separation of gross features, yet be chemically distinct from them" [34]. Proper decoy set construction typically involves selecting 20-50 decoy molecules per active compound, ensuring sufficient statistical power while maintaining chemical diversity [37] [34].
Implementation Workflow
The standard protocol for calculating EF and GH scores follows a systematic workflow that begins with database preparation and proceeds through sequential screening stages. First, the prepared database containing both known actives and decoys is screened using the pharmacophore model as a query. The resulting hits are ranked based on their pharmacophore fit value or complementary scoring metric. Following this ranking, researchers select a threshold cutoff (typically 1-10% of the total database) to define the "enriched subset" for analysis [32] [33]. The specific values for Ha, Ht, A, and D are then extracted from this top fraction and applied to the EF and GH equations. This process is often repeated at multiple cutoff points (1%, 5%, 10%) to generate enrichment curves that visualize performance across the entire ranking spectrum [38]. In recent implementations, this workflow has been automated within software platforms like Discovery Studio and Schrödinger's Maestro, though manual calculation remains straightforward using spreadsheet tools once the essential hit counts are obtained [33] [35].
Comparative Analysis of Validation Approaches
Statistical Validation Frameworks
Beyond EF and GH scores, comprehensive pharmacophore validation incorporates additional statistical measures that provide complementary insights. The receiver operating characteristic (ROC) curve analysis plots the true positive rate against the false positive rate across all possible classification thresholds, with the area under the curve (AUC) providing a threshold-independent assessment of model performance [32] [28]. Meanwhile, Fisher's randomization test (Cat-Scramble) validates the statistical significance of the pharmacophore model by randomly shuffling activity data and confirming that the original model performs significantly better than those generated from randomized datasets [33] [39]. These approaches address different aspects of validation—ROC curves evaluate overall discriminatory power, while Fisher's test assesses the likelihood that the observed correlation occurred by chance. When applied to Akt2 inhibitors, this multi-faceted validation approach confirmed that the developed pharmacophore model genuinely captured structure-activity relationships rather than benefiting from fortuitous correlations [33].
Case Studies in Different Target Classes
The application of EF and GH metrics across diverse target classes demonstrates their universal utility in pharmacophore validation while revealing target-specific performance patterns. In kinase targets like FGFR1, researchers achieved outstanding enrichment (EF > 20) through consensus pharmacophore models that integrated multiple ligand conformations [28]. For GPCR targets such as TGR5, the validation process emphasized GH scores to balance sensitivity and specificity, recognizing the challenges of identifying selective compounds for this target class [35]. In enzyme targets including COX-2, comprehensive validation incorporating both EF and GH scores successfully identified novel chemotypes beyond the original training set [32]. These case studies collectively demonstrate that while optimal threshold values may vary by target class, the consistent application of EF and GH metrics enables meaningful comparison across different target types and therapeutic areas.
Table 2: Performance Benchmarks Across Different Target Classes
| Target Class | Example Target | Reported EF Range | Reported GH Range | Special Considerations |
|---|---|---|---|---|
| Kinases | FGFR1, Akt2 | 10-60 | 0.6-0.8 | High specificity requirements due to conserved ATP-binding site |
| GPCRs | TGR5, Glucagon Receptor | 5-30 | 0.5-0.75 | Membrane environment effects on ligand binding |
| Enzymes | COX-2 | 15-40 | 0.65-0.85 | Often have well-defined active sites with diverse chemical features |
| Nuclear Hormone Receptors | PPARγ | 1-25 | 0.4-0.7 | Ligand flexibility requires comprehensive conformational analysis |
Advanced Considerations and Methodological Refinements
Addressing Statistical Uncertainty
Recent research has highlighted the importance of quantifying statistical uncertainty in enrichment metrics, particularly when evaluating virtual screening performance. As noted in one study, "researchers almost never consider the uncertainty associated with estimating such curves before declaring differences between performance of competing algorithms" despite the fact that "uncertainty is often large because the testing fractions of interest to researchers are small" [38]. This uncertainty stems from two often-overlooked sources: correlation across different testing fractions within a single algorithm, and correlation between competing algorithms being compared. To address these challenges, researchers have developed advanced statistical approaches including confidence bands for hit enrichment curves and EmProc-based hypothesis testing, which provide a more rigorous foundation for claiming significant differences between screening methods [38]. These refined approaches are particularly valuable when evaluating marginal improvements in enrichment that might otherwise be misinterpreted as statistically significant.
Machine Learning-Enhanced Model Selection
The integration of machine learning techniques with traditional pharmacophore validation represents a cutting-edge advancement in the field. Researchers have developed cluster-then-predict workflows that first group pharmacophore models using K-means clustering based on their feature composition and geometric arrangements, then apply logistic regression classifiers to identify models likely to achieve higher enrichment factors [34]. This approach has demonstrated impressive predictive performance, with "positive predictive values (PPV) of 0.88 and 0.76 for selecting high enrichment pharmacophore models from among those generated in experimentally determined and modeled structures, respectively" [34]. Such machine learning-enhanced selection is particularly valuable for targets with limited known activators, where traditional validation using known actives is challenging. Furthermore, these approaches facilitate the identification of high-performing pharmacophore models for orphan targets with neither known ligands nor experimental structures, significantly expanding the applicability of structure-based pharmacophore modeling.
Essential Research Reagent Solutions
Table 3: Key Computational Tools for Pharmacophore Validation
| Tool Category | Specific Software/Resources | Primary Function in Validation | Application Example |
|---|---|---|---|
| Pharmacophore Modeling | Discovery Studio, Schrödinger Maestro, LigandScout | Model generation, feature mapping, hypothesis testing | 3D-QSAR pharmacophore generation for Akt2 inhibitors [33] |
| Decoy Set Databases | DUD (Directory of Useful Decoys), ZINC database | Provides property-matched decoys for unbiased validation | Benchmarking sets for molecular docking [37] |
| Statistical Analysis | R/caret package, SAS Enterprise Miner, JMP | Calculation of EF, GH, ROC curves, confidence estimation | Confidence bands for hit enrichment curves [38] |
| Molecular Docking | GOLD, Glide, AutoDock | Binding mode analysis, complementary scoring | Hierarchical docking (HTVS/SP/XP) for FGFR1 inhibitors [28] |
| Dynamics & Simulation | GROMACS, AMBER, CHARMM | Assessment of binding stability, conformational analysis | MD simulations for HER2 inhibitors [36] |
The rigorous validation of pharmacophore models through Enrichment Factors and Goodness-of-Hit scores provides an essential statistical foundation for reliable virtual screening in drug discovery. These metrics transform qualitative pharmacophore hypotheses into quantitatively validated tools capable of prioritizing chemical matter with increased probability of biological activity. As computational methods continue to evolve, incorporating advanced statistical treatments of uncertainty and machine learning-enhanced selection approaches will further strengthen the validation paradigm. The consistent application of these metrics across diverse target classes, complemented by auxiliary validation methods including ROC analysis and Fisher's randomization, enables researchers to make informed decisions about which pharmacophore models warrant experimental follow-up. Through this rigorous quantitative framework, computational chemists can maximize the value of virtual screening campaigns, significantly accelerating the identification of novel therapeutic agents across disease areas.
Retrospective screening is a cornerstone computational method in early drug discovery, used to validate the predictive power of various molecular models before committing to costly experimental screens. This process tests a model's ability to identify known active compounds hidden within a large database of decoy molecules, which are designed to be chemically similar but physically dissimilar to the actives. The DUD-E (Directory of Useful Decoys: Enhanced) database is a widely adopted benchmark for this purpose, providing a rigorous framework for evaluation [40]. For pharmacophore models—which are abstract 3D representations of the steric and electronic features necessary for a molecule to bind to a target protein—retrospective screening against DUD-E offers a critical validation step [7] [21]. This guide objectively compares the performance of modern, automated pharmacophore generation methods in this specific validation context, providing researchers with experimental data to inform their tool selection.
Experimental Protocols for Retrospective Screening
A standardized experimental protocol is essential for a fair comparison of different pharmacophore methods. The following workflow outlines the key steps for conducting a retrospective screening validation using the DUD-E dataset.
Core Workflow and Methodology
The general process for a DUD-E-based retrospective screening experiment involves several critical stages, from database preparation to performance calculation [7] [40].
Detailed Methodological Considerations
Database Preparation: The DUD-E dataset provides known actives and decoys for multiple protein targets. Decoys are property-matched to actives (similar molecular weight, logP) but are topologically dissimilar to ensure a realistic screening challenge [40]. For screening, multiple low-energy molecular conformers must be generated for all database molecules; tools like RDKit are typically used to produce 20-25 energy-minimized conformers per molecule [7] [40].
Pharmacophore Screening: Screening is performed using specialized software like Pharmit, which efficiently identifies molecules with conformers that match the spatial constraints of the pharmacophore query. A typical tolerance radius of 1 Å is used for feature matching, and receptor exclusion is applied to filter out molecules that sterically clash with the protein [40].
Performance Metrics Calculation: Key metrics include the Enrichment Factor (EF), which measures how much a method enriches the top-ranked results with true actives compared to random selection, and the F1 Score, which balances precision (fraction of retrieved actives that are true actives) and recall (fraction of all true actives that are retrieved) [40].
Performance Comparison of Pharmacophore Generation Methods
Different computational approaches can generate pharmacophores for retrospective screening. The table below compares the performance of several modern methods on the DUD-E benchmark.
Table 1: Performance Comparison of Pharmacophore Methods on DUD-E
| Method | Core Approach | Key Performance Metric | Reported Result on DUD-E | Relative Strength |
|---|---|---|---|---|
| PharmacoForge | Diffusion model conditioned on protein pocket [7] | Ligand docking score & strain energy | Similar docking scores to de novo ligands, but with lower strain energies [7] | Generates commercially available, synthetically accessible ligands [7] |
| PharmRL | CNN + Geometric Q-learning to select interaction features [40] | F1 Score | Better F1 scores than random selection of co-crystal structure features [40] | Effective even without a cognate ligand structure [40] |
| Apo2ph4 | Fragment docking & clustering [7] | Performance in retrospective screening | Proven performance, but requires intensive manual checks [7] | Relies on established docking protocols |
| PGMG | Pharmacophore-Guided deep learning for Molecule Generation [41] | Docking affinity & molecular properties | Generates molecules with strong docking affinities and high validity [41] | Flexible; useful for both ligand- and structure-based design [41] |
Analysis of Comparative Data
The comparative data reveals a trend toward machine learning-driven methods that reduce manual intervention. PharmRL demonstrates that a reinforcement learning approach can automatically select feature combinations that lead to functional pharmacophores, outperforming a strategy of randomly selecting features from a co-crystal structure [40]. Meanwhile, PharmacoForge addresses a different bottleneck by generating pharmacophores that, when screened, yield molecules that are not only potent but also synthetically accessible—a common failure mode for de novo molecular generation models [7].
The Scientist's Toolkit: Essential Research Reagents & Databases
Successful retrospective screening relies on a suite of computational tools and databases. The following table details the key "research reagents" for these experiments.
Table 2: Essential Computational Reagents for Retrospective Screening
| Tool/Resource | Type | Primary Function in Validation | Key Characteristic |
|---|---|---|---|
| DUD-E Database | Benchmark Database | Provides known actives and property-matched decoys for multiple targets [40] | Standardized benchmark for fair method comparison [40] |
| LIT-PCBA | Benchmark Database | Provides another large-scale benchmark for validation, often used alongside DUD-E [7] [40] | Contains a prohibitively large number of molecules for screening [40] |
| Pharmit | Open-source Software | Performs high-speed pharmacophore search of large molecular libraries [7] [40] | Implements sub-linear time search algorithms for efficiency [7] |
| RDKit | Cheminformatics Library | Generates and energy-minimizes multiple molecular conformers [40] | Critical for preparing a screening database where molecules are flexible [40] |
| PDBbind | Curated Database | Provides a curated set of protein-ligand complexes for training and testing [40] | Used to train models like the CNN in PharmRL on "ground truth" interactions [40] |
Retrospective screening using the DUD-E dataset remains a vital practice for validating the quality and utility of pharmacophore models before their deployment in prospective drug discovery campaigns. The experimental data demonstrates that modern automated methods, particularly those leveraging deep learning and reinforcement learning like PharmRL and PharmacoForge, offer robust performance. These tools help to overcome the traditional reliance on expert intuition and co-crystal structures, making powerful pharmacophore-based screening accessible for a broader range of targets, including those with little prior ligand information. Integrating these validated models into virtual screening workflows significantly increases the likelihood of identifying novel, potent, and synthetically tractable chemical matter for further development.
This case study objectively compares the performance of a structure-based pharmacophore model against traditional docking methods for identifying novel Bromodomain-containing protein 4 (BRD4) inhibitors for neuroblastoma treatment. The validation framework integrates computational predictions with experimental confirmation, demonstrating how pharmacophore models serve as efficient filters for enriching hit rates in virtual screening campaigns. Quantitative data from multiple studies reveals that pharmacophore-guided approaches successfully identified natural compounds with binding affinities ranging from -9.623 to -8.894 kcal/mol, with subsequent experimental validation confirming cytotoxic effects in neuroblastoma cell lines [42] [43].
Neuroblastoma is the most common extracranial solid tumor in children, with high-risk cases exhibiting a 5-year survival rate of only 51-60% despite intensive multimodal therapy [44] [45]. BRD4 has emerged as a promising therapeutic target as it functions as an epigenetic reader that regulates the expression of critical oncogenes like MYCN, which is amplified in approximately 20% of high-risk neuroblastoma cases [42] [46]. BRD4 belongs to the bromodomain and extraterminal (BET) family of proteins and contains two bromodomains (BD1 and BD2) that recognize acetylated lysine residues on histones, facilitating the recruitment of transcriptional machinery to promoter and enhancer regions [42]. Pharmacological inhibition of BRD4 potently depletes MYCN in neuroblastoma cells, making it an attractive target for therapeutic development [43].
Experimental Design and Methodologies
Pharmacophore Model Development
The foundational step involved creating a structure-based pharmacophore model using the BRD4 crystal structure (PDB ID: 4BJX) in complex with its co-crystal ligand (73B). The protein structure has a resolution of 1.59 Å, providing a high-quality template for model generation [42] [43]. Researchers used Ligand Scout 4.4 and Pharmit web server to identify critical interaction features between the ligand and the BRD4 binding pocket, deriving the following pharmacophore features [42] [43]:
- Hydrogen bond acceptors (HA)
- Hydrogen bond donors (HD)
- Hydrophobic interactions (HY)
- Aromatic rings (AR)
- Exclusion volumes (EX) - representing steric constraints
The generated model incorporated six hydrophobic contacts, two hydrophilic interactions, one negative ionizable bond, and fifteen exclusion volumes to define the essential chemical space for BRD4 inhibition [43].
Virtual Screening Workflow
The pharmacophore model served as a query to screen large compound databases using a structured virtual screening workflow:
- Database Preparation: Five natural compound databases (CHEMBL, Enamine, MCULE, Chemspace, and ChemDiv) were prepared for screening [42]
- Pharmacophore-based Screening: Compounds were filtered using Lipinski's Rule of Five parameters (H-bond acceptors <10, H-bond donors <5, molecular weight <500, logP <5) to ensure drug-likeness [42]
- Molecular Docking: Retrieved hits underwent molecular docking using Schrödinger Maestro and Glide with Standard Precision (SP) mode to assess binding orientations and affinities [42]
- ADMET Profiling: Promising compounds were evaluated for absorption, distribution, metabolism, excretion, and toxicity properties using QikProp and SwissADME tools [42] [43]
- Molecular Dynamics Simulations: The stability of top protein-ligand complexes was validated through 10-100 ns MD simulations using NAMD 2.14 with CHARMM36 force field [42] [47]
- Binding Free Energy Calculations: The Molecular Mechanics with Generalized Born and Surface Area Solvation (MM-GBSA) method was employed to calculate binding free energies [47] [43]
Experimental Validation Protocols
Computational predictions underwent rigorous experimental validation using the following protocols:
- In Vitro Cytotoxicity Assay: SK-N-AS neuroblastoma cells were treated with identified compounds, and cell viability was measured using WST-8 assay after 24-72 hours [47]
- Western Blot Analysis: Protein expression levels of caspase-1, caspase-3, procaspase-7, and procaspase-8 were analyzed to evaluate apoptosis and pyroptosis induction [47]
- Immunofluorescence: Caspase-1 activation was detected using fluorescent-labelled inhibitors [47]
- Co-crystallographic Analysis: Binding modes of inhibitors were confirmed through X-ray crystallography [8]
The diagram below illustrates the complete validation workflow from pharmacophore development to experimental confirmation:
Performance Comparison: Pharmacophore Models vs. Traditional Docking
Virtual Screening Efficiency
The table below compares the virtual screening efficiency of pharmacophore-based approaches versus traditional molecular docking:
| Screening Metric | Pharmacophore-Guided Screening | Traditional Docking Only | Data Source |
|---|---|---|---|
| Initial compound library size | 407,270 natural compounds | 407,270 natural compounds | [47] [43] |
| Primary hits identified | 1,089 compounds | Not specified | [42] |
| Hit rate after docking | 0.9% (top 10 compounds) | Typically 0.1-1% | [42] [43] |
| Computational time requirement | Lower (efficient pre-filtering) | Higher (no pre-filtering) | [48] |
| Scaffold diversity of hits | Higher (structurally distinct scaffolds) | Lower (similar scaffolds) | [8] [43] |
| Binding affinity range | -9.623 to -8.894 kcal/mol | -8.64 ± 1.03 kcal/mol | [42] [48] |
Predictive Accuracy and Experimental Validation
The performance of identified compounds in experimental validation studies demonstrates the effectiveness of the pharmacophore-guided approach:
| Validation Parameter | Pharmacophore-Guided Hits | Traditional Docking Hits | Data Source |
|---|---|---|---|
| Cytotoxic activity (IC50) | 21-49 µM (curcumin, quercetin, galangin) | Not specified | [47] |
| Apoptosis induction | Significant caspase-3 cleavage | Not specified | [47] |
| Pyroptosis induction | Upregulated caspase-1 expression | Not specified | [47] |
| Binding free energy (MM-GBSA) | Favorable ΔG values | Less favorable ΔG values | [47] [43] |
| MD simulation stability | Stable complexes (10-100 ns) | Less stable complexes | [42] [47] |
| ADMET profile | Favorable drug-like properties | Variable drug-like properties | [42] [43] |
Key Experimental Results and Validation Data
Identified Natural Product Inhibitors
The pharmacophore-based virtual screening identified several promising natural compounds with anti-neuroblastoma activity:
- ZINC2509501, ZINC2566088, ZINC1615112, and ZINC4104882: These four natural compounds showed strong binding affinity to BRD4, favorable ADMET properties, and stable binding in MD simulations spanning 100 ns [43]
- Curcumin, Quercetin, and Galangin: These natural products exhibited potent cytotoxic effects on GSDMD-expressing neuroblastoma SK-N-AS cells, with IC50 values of 21, 37, and 49 µM, respectively [47]
- Curcumin demonstrated dual activity by promoting both apoptosis (increased caspase-3 cleavage) and pyroptosis (upregulated caspase-1) [47]
Molecular Dynamics Validation
Molecular dynamics simulations provided critical validation of the predicted binding modes:
- Stability Metrics: The top compounds showed root-mean-square deviation (RMSD) values below 2.0 Å throughout 100 ns simulations, indicating stable protein-ligand complexes [42] [47]
- Binding Free Energies: MM-GBSA calculations revealed favorable binding free energies for pharmacophore-identified compounds, ranging from -40 to -60 kcal/mol, correlating with their experimental activities [47] [43]
- Key Interactions: The simulations confirmed the maintenance of critical hydrogen bonds and hydrophobic interactions with BRD4 binding pocket residues throughout the simulation period [42]
Pathway Modulation and Mechanistic Insights
The diagram below illustrates how BRD4 inhibitors identified through pharmacophore models impact neuroblastoma signaling pathways:
The Scientist's Toolkit: Essential Research Reagents
The table below details key research reagents and computational tools essential for pharmacophore model development and validation:
| Tool/Reagent Category | Specific Tools Used | Function/Purpose | Application in Validation |
|---|---|---|---|
| Structural Biology Tools | PDB ID: 4BJX (BRD4 structure) | Provides template for structure-based pharmacophore modeling | Served as reference for interaction mapping [42] [43] |
| Pharmacophore Modeling | Ligand Scout 4.4, Pharmit | Generate and validate pharmacophore hypotheses | Created 6-feature model with exclusion volumes [42] [43] |
| Molecular Docking | Schrödinger Maestro, Glide | Predict binding poses and affinities | Docked 1,089 hits using SP mode [42] |
| Molecular Dynamics | NAMD 2.14, CHARMM36 | Simulate protein-ligand complex stability | 10-100 ns simulations for stability assessment [42] [47] |
| Binding Energy Calculations | MM-GBSA, MolAICal | Calculate binding free energies | Quantified binding energies from MD trajectories [47] [43] |
| Cell-Based Assays | SK-N-AS cell line, WST-8 assay | Evaluate cytotoxic activity | Confirmed IC50 values for top compounds [47] |
| Mechanistic Studies | Western blot, Immunofluorescence | Analyze cell death mechanisms | Detected caspase activation for apoptosis/pyroptosis [47] |
This case study demonstrates that pharmacophore-guided virtual screening provides an efficient and effective approach for identifying novel BRD4 inhibitors with potential therapeutic value in neuroblastoma. The integrated validation framework combining computational predictions with experimental confirmation establishes a robust protocol for evaluating pharmacophore model performance. The pharmacophore approach successfully identified natural compounds with diverse scaffolds, favorable binding affinities ranging from -9.623 to -8.894 kcal/mol, and experimentally confirmed cytotoxic activity against neuroblastoma cell lines (IC50 values of 21-49 µM) [42] [47] [43].
The comparative analysis reveals that pharmacophore models offer significant advantages over traditional docking alone, including higher scaffold diversity, better drug-like properties, and more stable binding modes as confirmed through molecular dynamics simulations. These findings strengthen the broader thesis that validated pharmacophore models serve as powerful tools in early drug discovery, particularly for challenging targets like BRD4 in neuroblastoma. Future directions should focus on optimizing these identified leads through medicinal chemistry and advancing them through in vivo efficacy studies to further validate this approach.
In contemporary drug discovery, the initial validation of a pharmacophore model—confirming its ability to identify biologically active compounds—marks a necessary but insufficient step toward developing a viable therapeutic candidate. The high attrition rates in clinical development, with approximately 40–45% of failures attributed to unfavorable absorption, distribution, metabolism, excretion, and toxicity (ADMET) properties, underscore the critical need for early and integrated safety profiling [49] [50]. Computer-Aided Drug Discovery (CADD) techniques, particularly pharmacophore modeling and virtual screening, have long been employed to reduce the time and costs of developing novel drugs by prioritizing compounds with desired target interactions [21]. However, the true translational success of these computational approaches now hinges on moving "Beyond Initial Validation" to systematically incorporate ADMET and toxicity predictions into the earliest stages of the hit identification and lead optimization pipeline. This paradigm shift, powered by advances in artificial intelligence (AI), machine learning (ML), and federated learning, enables researchers to filter out problematic compounds before committing to costly experimental assays, thereby increasing the likelihood of clinical success [51] [49] [50].
Performance Benchmarking: Pharmacophore VS, Docking VS, and ADMET Prediction
Selecting the right virtual screening (VS) strategy and integrating reliable toxicity prediction tools are crucial for efficient lead identification. The table below provides a comparative overview of core virtual screening methodologies and modern ADMET prediction approaches to guide strategic decision-making.
Table 1: Performance Comparison of Virtual Screening and ADMET Prediction Methods
| Method Category | Specific Method / Tool | Key Performance Metrics | Strengths | Limitations |
|---|---|---|---|---|
| Pharmacophore-Based VS (PBVS) | Catalyst HypoGen [13] [52] | Higher average hit rates vs. DBVS; Enrichment Factor (EF) at 1% threshold = 10.0; AUC = 0.98 in validation [13] [1] | Scaffold hopping ability; Fast screening of large libraries; Identifies essential steric/electronic features [21] [13] | Limited by accuracy of the model; Less accurate binding pose prediction |
| Docking-Based VS (DBVS) | DOCK, GOLD, Glide [13] | Lower average hit rates and enrichment factors vs. PBVS in benchmark study [13] | Detailed binding pose analysis; Considers full atomistic flexibility and scoring [13] | Computationally intensive; Scoring function inaccuracies; High false-positive rates |
| AI/ML for ADMET | Graph Neural Networks (GNNs), Multitask Models [50] [53] | 40–60% reduction in prediction error for clearance, solubility; AUC, F1-score for classification [49] [50] | Models complex structure-property relationships; High accuracy and scalability [50] [53] | "Black box" interpretability issues; Data quality and heterogeneity challenges |
| Federated Learning for ADMET | Apheris Network, MELLODDY [49] | Outperforms isolated models; Expands applicability domains; Benefits scale with participant number [49] | Cross-pharma collaboration without sharing IP; Trains on diverse, distributed data [49] | Technical complexity of orchestration; Requires standardized practices |
Experimental Protocols for Integration and Validation
Robust validation protocols are essential to ensure that integrated models are predictive and reliable. The following section details key methodologies for validating pharmacophore models and incorporating ADMET assessment into the screening workflow.
Comprehensive Pharmacophore Model Validation
Before deploying a pharmacophore model for virtual screening, it must undergo rigorous validation to ascertain its predictive power and robustness [2].
- Cost Function Analysis: This analysis assesses the statistical significance of the pharmacophore hypothesis. It comprises weight cost, error cost, and configuration cost. A configuration cost below 17 is considered satisfactory. The null cost (Δ), representing the difference between the null hypothesis cost and the total hypothesis cost, should typically exceed 60 to confirm the model does not result from a chance correlation [2].
- Fisher's Randomization Test: This is a crucial statistical test to validate the model's significance. The biological activities of the training set compounds are randomly shuffled, and new models are generated from the randomized data. The original model's correlation coefficient is compared to those from the randomized sets. A significance level (e.g., 95%) is calculated, indicating that the original model is not a product of random chance [2].
- Decoy Set Validation (ROC Analysis): This test evaluates the model's ability to discriminate active compounds from inactive ones (decoys). A set of known actives is mixed with many decoy molecules (structurally similar but inactive). The model is used to screen this database. The results are analyzed using a Receiver Operating Characteristic (ROC) curve, and the Area Under the Curve (AUC) is calculated. An AUC value of 0.9-1.0 indicates excellent predictive ability [1] [2].
- Test Set Prediction: An independent test set of compounds with known activities, not used in model generation, is screened. The predicted activities are compared against the experimental values. The predictive power is quantified using metrics like the predictive correlation coefficient (R²pred), with a value greater than 0.5 generally considered acceptable, and the root-mean-square error (rmse) [2].
Integrated Workflow for Pharmacophore Screening and ADMET Filtering
A practical, integrated workflow combines structure- and ligand-based pharmacophore modeling with advanced ADMET filtering to identify promising, safe lead candidates.
Table 2: Essential Research Reagents and Computational Tools
| Tool / Resource Category | Specific Examples | Primary Function in Workflow |
|---|---|---|
| Protein Structure Database | RCSB Protein Data Bank (PDB) [21] | Source of 3D macromolecular structures for structure-based pharmacophore modeling. |
| Compound Database for VS | ZINC Database [52] [1] | Curated collection of commercially available compounds for virtual screening. |
| Pharmacophore Modeling Software | Catalyst (HypoGen), LigandScout [21] [13] [1] | Generation and application of structure-based and ligand-based pharmacophore models. |
| Validation Database | DUD-E (Database of Useful Decoys: Enhanced) [1] [2] | Provides decoy molecules for rigorous validation of pharmacophore models and virtual screening protocols. |
| ADMET Prediction Platforms | Public: ChEMBL, Tox21, ClinTox [53]Proprietary/Federated: Apheris Network [49] | AI/ML platforms trained on diverse data for predicting absorption, distribution, metabolism, excretion, and toxicity endpoints. |
| Molecular Docking & Dynamics | GOLD, Glide, DOCK [13] | Validates binding mode and stability of hits from pharmacophore screening in the target's active site. |
The following diagram visualizes the complete integrated workflow, from initial model building to the final selection of optimized lead compounds.
Integrated Drug Discovery Workflow
The integration of sophisticated ADMET and toxicity predictions into the pharmacophore-based virtual screening pipeline represents a necessary evolution in computational drug discovery. By moving beyond initial activity-based validation and adopting the benchmarked performance data, rigorous experimental protocols, and integrated workflows outlined in this guide, researchers can systematically prioritize lead candidates with a higher probability of clinical success. The future of this field lies in the continued development of explainable AI, the expansion of collaborative federated learning initiatives, and the tighter coupling of multi-omics data, which together will further enhance the predictive accuracy and translational impact of in-silico models [49] [50] [54].
Overcoming Common Validation Challenges and Optimizing Model Performance
Identifying and Rectifying Low Enrichment Factors
In the rigorous process of computer-aided drug design, pharmacophore models serve as essential theoretical constructs that map the critical chemical features a ligand requires to interact with a biological target. However, the predictive power and utility of any generated pharmacophore model hinge on its rigorous validation against experimental data. Within this validation framework, the Enrichment Factor (EF) stands as a paramount quantitative metric for evaluating model performance [11]. It directly measures a model's ability to selectively identify true active compounds from extensive chemical libraries during virtual screening, as opposed to retrieving compounds at random. A low EF signifies a model with poor discriminative power, leading to wasted resources in downstream experimental testing. Framed within the broader thesis of validating pharmacophore models against experimental data, this guide objectively compares methodological approaches for diagnosing and rectifying low EF, providing researchers with a structured toolkit to enhance the reliability of their computational models.
Core Concepts: Defining Enrichment Factor and Related Metrics
The Enrichment Factor is a decisive performance indicator that quantifies the effectiveness of a virtual screening campaign relative to a random selection process [1]. It is typically calculated at a specific early fraction of the screened database (e.g., 1% or 5%), where the cost-benefit of identifying actives is highest. The formula for EF is:
EF = (Number of actives found in the subset / Total number of compounds in the subset) / (Total number of actives in database / Total number of compounds in database)
An EF of 1 indicates performance no better than random chance, while higher values denote superior enrichment. For instance, a study targeting the XIAP protein reported an excellent early enrichment factor (EF1%) of 10.0, indicating that the model was ten times more effective than random selection at retrieving active compounds from the 1% top-ranked hits [1].
Closely related and often reported alongside EF are several other key statistical metrics that provide a comprehensive view of model performance [17]:
- Sensitivity (True Positive Rate): The proportion of actual active compounds correctly identified by the model.
- Specificity (True Negative Rate): The proportion of actual inactive compounds correctly identified by the model.
- Area Under the Curve (AUC) of the Receiver Operating Characteristic (ROC) Curve: A plot of sensitivity versus (1-specificity) that illustrates the overall diagnostic ability of the model. An AUC value of 1.0 represents a perfect model, while 0.5 is equivalent to random selection [11].
- Goodness of Hit (GH): A composite score that balances the yield of actives with the coverage of the active set.
Table 1: Key Statistical Metrics for Pharmacophore Model Validation
| Metric | Definition | Ideal Value | Interpretation |
|---|---|---|---|
| Enrichment Factor (EF) | Measure of effectiveness vs. random selection [1]. | >>1 | Higher is better; indicates model precision. |
| Sensitivity | Proportion of true actives correctly identified [17]. | 1.0 | High value means most actives are found. |
| Specificity | Proportion of true inactives correctly identified [17]. | 1.0 | High value means few false positives. |
| AUC-ROC | Overall measure of model discriminative power [11]. | 1.0 | 1.0=Perfect, 0.5=Random. |
| Goodness of Hit (GH) | Composite score balancing yield and coverage [17]. | 1.0 | Closer to 1 indicates a better, more useful model. |
Experimental Protocols for Validation and Benchmarking
A standardized validation protocol is essential for the objective comparison of different pharmacophore models or software solutions. The following methodology, commonly employed in rigorous computational studies, ensures a fair and reproducible assessment [1] [17].
Protocol: Model Validation using a Known Dataset
1. Preparation of Test Sets:
- Active Compounds: Curate a set of known active compounds (e.g., 36 antagonists for Brd4 [11] or 114 for FAK1 [17]) from literature or databases like ChEMBL. The biological activity (e.g., IC50) of these compounds should be experimentally confirmed.
- Decoy Compounds: Generate a set of physicochemically similar but topologically distinct decoy molecules that are presumed inactive against the target. Public databases like the Directory of Useful Decoys: Enhanced (DUD-E) are typically used for this purpose to ensure a unbiased benchmark [17].
2. Virtual Screening Simulation:
- The combined set of active and decoy compounds is screened against the pharmacophore model(s) under evaluation.
- The output compounds are ranked according to their fit value with the model.
3. Performance Calculation:
- The ranked list is analyzed to calculate the key metrics described in Section 2 (EF, AUC, Sensitivity, Specificity) at various thresholds.
4. Comparative Analysis:
- The calculated metrics for different models are compared in a structured table to objectively identify the top-performing model. For example, a study on sigma-1 receptor ligands compared multiple models using a large experimental dataset of over 25,000 structures, with the 5HK1-Ph.B model emerging as the best due to its ROC-AUC value above 0.8 and significant enrichment values [55].
Table 2: Comparative Performance of Pharmacophore Models from Published Studies
| Target Protein | Model Name/PDB | EF (Threshold) | AUC-ROC | Key Strengths |
|---|---|---|---|---|
| Brd4 | 4BJX-based Model [11] | - | 1.0 | Excellent discriminative power (36 true positives, 3 false positives). |
| XIAP | 5OQW-based Model [1] | 10.0 (1%) | 0.98 | Outstanding early enrichment, high AUC. |
| σ1R | 5HK1-Ph.B [55] | >3 (multiple fractions) | >0.8 | Best performance on a large, diverse compound dataset. |
| FAK1 | 6YOJ-based Model [17] | High (model selected based on EF, GH) | - | Model selected based on highest validation performance (EF, GH). |
A Workflow for Diagnosing and Rectifying Low Enrichment Factors
A low EF indicates a fundamental failure of the model to capture the essential features for biological activity. The following diagnostic and rectification workflow provides a systematic approach to this problem.
Figure 1: A systematic workflow for diagnosing the root causes of a low Enrichment Factor and implementing targeted solutions to rectify the issue.
Problem: Poorly Defined Pharmacophore Features
- Diagnosis: The model may have been built with an incomplete or incorrect set of chemical features (e.g., missing a key hydrogen bond donor/acceptor, or hydrophobic contact). This fails to represent the true molecular interaction pattern with the target.
- Rectification: Re-evaluate the protein-ligand complex structure. For structure-based models, use software like LigandScout to meticulously analyze the binding site interactions and ensure all critical hydrophobic contacts, hydrogen bonds (donors and acceptors), and ionic interactions are captured [11] [1]. For ligand-based models, ensure the training set is diverse and the common features are statistically significant.
Problem: Incorrect Active Site Definition
- Diagnosis: The model is built targeting a irrelevant or suboptimal binding pocket, or the defined exclusion volumes do not accurately represent the steric constraints of the true active site.
- Rectification: Consult biochemical data and literature to confirm the biologically relevant binding site. Re-generate the pharmacophore model, potentially using a different protein-ligand complex (PDB structure) if available. Adjust the number and placement of exclusion volume spheres to better mimic the shape of the binding cavity [11].
Problem: Excessive Model Rigidity
- Diagnosis: The model is too strict, with overly narrow tolerance values for feature angles and distances. This makes it unable to recognize valid but slightly different active scaffolds, reducing its sensitivity.
- Rectification: Optimize the tolerance parameters for distances and angles between pharmacophoric features. Some software allows for the weighting of features based on their importance; increasing the weight of critical interactions while making others optional can improve model selectivity and enrichment [55].
Problem: Inadequate Handling of Flexibility
- Diagnosis: Both the receptor binding site and the ligands are dynamic, but the model is built on a single, static crystal structure, limiting its ability to recognize compounds that bind through alternative conformations.
- Rectification: Incorporate flexibility through Molecular Dynamics (MD) Simulations. Running MD on the protein-ligand complex can reveal alternative binding site conformations and key interacting residues. Multiple snapshots from the MD trajectory can be used to generate a ensemble of pharmacophore models, providing a more comprehensive representation of the binding landscape [27] [17].
The Scientist's Toolkit: Essential Research Reagents and Solutions
The following table details key resources and their functions in pharmacophore modeling and validation workflows.
Table 3: Essential Research Reagents and Computational Tools for Pharmacophore Modeling and Validation
| Item / Resource | Function / Description | Example Use in Workflow |
|---|---|---|
| Protein Data Bank (PDB) | Repository for 3D structural data of proteins and nucleic acids [11]. | Source of target protein structures (e.g., PDB ID: 4BJX for Brd4) for structure-based pharmacophore modeling [11]. |
| LigandScout Software | Advanced molecular design software for creating structure-based pharmacophore models [11] [1]. | Used to generate and visualize key chemical features (HBD, HBA, hydrophobic) from a protein-ligand complex [11]. |
| ZINC Database | Freely available database of commercially available compounds for virtual screening [11] [1]. | Library of millions of purchasable molecules (both natural and synthetic) to screen against a validated pharmacophore model [11]. |
| DUD-E Database | Database of useful decoys: Enhanced; provides decoy molecules for validation [17]. | Source of presumed inactive compounds to test the specificity and enrichment power of a pharmacophore model during validation [17]. |
| CHEMBL Database | Manually curated database of bioactive molecules with drug-like properties. | Source of known active compounds with annotated bioactivity data for training ligand-based models or for validation sets [1]. |
| GROMACS | Software package for performing molecular dynamics (MD) simulations [17]. | Used to simulate the dynamic behavior of a protein-ligand complex in solution, informing on stability and binding modes [17]. |
In the field of computational drug discovery, the "Garbage In, Garbage Out" (GIGO) principle is not merely a cautionary saying but a fundamental challenge that directly impacts the success and cost of research. This principle dictates that the predictive power of any artificial intelligence (AI) or machine learning (ML) model is inextricably linked to the quality of the data on which it is trained. Poor-quality input data inevitably leads to unreliable outputs, misguiding experimental efforts and wasting valuable resources [56] [57] [58]. Within the specific context of pharmacophore modeling—an abstract method used to identify essential chemical features for molecular recognition—validating models against robust experimental data is the primary defense against the GIGO problem. This guide objectively compares how different data-centric strategies impact the performance and reliability of pharmacophore models in a research setting.
The High Stakes of Data Quality in Drug Discovery
The "Garbage In, Garbage Out" challenge is particularly acute in pharmaceutical research due to the immense costs involved. Bringing a new drug to market requires an average investment of $2.6 billion and over a decade of work [59]. In this high-risk environment, unreliable computational predictions can lead to catastrophic misallocation of resources.
A stark analysis by Landrum and Riniker of ETH Zurich, which aggregated tens of thousands of ligand-binding measurements (IC50 and Ki) from different sources, revealed a profound data quality crisis. For the same ligand/target pairs, the correlation between experimental measurements from different assays was only R² = 0.31 [57]. This high degree of inconsistency in foundational biological data means that models trained on these aggregated public datasets are built on a shaky foundation, inevitably propagating these errors into their predictions.
Comparative Analysis of Data-Centric Approaches
The table below compares three strategic approaches to pharmacophore modeling, highlighting how each addresses the GIGO principle through different relationships with experimental data.
| Modeling Strategy | Core Data Relationship | Key Advantage | Inherent Limitation / GIGO Risk | Typical Use Case |
|---|---|---|---|---|
| Ligand-Based Modeling [56] [6] | Derived from structures of known active compounds. | High performance when reliable ligand activity data is available. | Highly sensitive to data quality; "garbage" activity data produces useless models [56]. | Target with multiple known active ligands. |
| Structure-Based Modeling [26] | Derived from 3D structure of the target protein. | Does not require known ligands; explores novel chemical space. | Static crystal structure may not capture full protein dynamics, leading to irrelevant features. | Novel targets with no known ligands, but with a solved protein structure. |
| Dynamics-Informed Modeling [8] [26] | Incorporates protein/ligand motion from simulations like Molecular Dynamics (MD). | Accounts for flexibility and solvation effects; models more realistic binding events. | Computationally intensive; complexity can introduce new errors if simulation setup is poor. | Refining models for difficult targets with known flexibility or solvent-mediated binding. |
Experimental Validation: Case Studies and Protocols
Case Study 1: The SARS-CoV-2 MPro Virtuous Loop
A landmark study provides a clear example of a virtuous loop between computational and experimental approaches to overcome GIGO [56].
- Initial Model (Garbage In): The first generation of ligand-based models for the SARS-CoV-2 main protease (MPro) was trained on data that had largely not been peer-reviewed. A screening campaign of 188 compounds based on these models yielded only three weak hits (
IC50 ≤ 25 µM), demonstrating poor predictive performance [56]. - Data Refinement: The researchers used this negative experimental data, combined with newly published, reliable MPro inhibitor data, to create a second-generation model.
- Validated Output: The refined model was used to select 45 new compounds for testing. This campaign yielded eight potent inhibitors (
IC50 = 0.12–20 µM), five of which also impaired SARS-CoV-2 proliferation in cells [56]. This cycle of model-prediction-experimental feedback-model refinement dramatically increased the success rate from 1.6% to 17.8%.
Case Study 2: Water-Based Pharmacophores for Kinase Inhibitors
This study employed an innovative, data-centric strategy to generate pharmacophores without relying on known ligand structures, thereby avoiding biases in existing chemical data [26].
- Protocol: Molecular Dynamics (MD) simulations were performed on ligand-free, water-filled ATP binding sites of Fyn and Lyn kinases. The trajectories of explicit water molecules were analyzed to identify interaction "hotspots," which were then converted into water-based pharmacophore models [26].
- Experimental Validation: These models were used for virtual screening. Biochemical assays confirmed two active compounds: a flavonoid-like molecule with low-micromolar activity and a weaker, nature-inspired synthetic compound [26]. Docking and simulation studies confirmed that the hits maintained key predicted interactions with the hinge region of the kinase ATP pocket, validating the pharmacophore model's relevance [26].
Workflow for GIGO-Aware Pharmacophore Modeling
The following diagram illustrates a robust, iterative workflow for developing and validating pharmacophore models, designed to mitigate the Garbage In, Garbage Out problem.
The Scientist's Toolkit: Essential Research Reagents and Solutions
The experimental protocols cited rely on a suite of specialized software and databases. The table below details key resources essential for conducting rigorous pharmacophore modeling and validation.
| Tool/Resource | Function in Research | Relevance to GIGO Principle |
|---|---|---|
| LigandScout [6] | Software for creating pharmacophore models from ligand structures or protein-ligand complexes. | Model quality depends on the accuracy of the input structural data. |
| PharmIt [6] | An online server for performing high-throughput pharmacophore-based virtual screening. | The screening output is only as good as the input pharmacophore model and the chemical library being screened. |
| Molecular Dynamics (MD) Software (e.g., AMBER) [26] | Simulates the physical movements of atoms and molecules over time, capturing dynamic behavior. | Provides a more realistic, dynamics-informed model of the binding site, reducing the risk of static structural bias. |
| ZINC/ChEMBL/PubChem [8] [6] [60] | Public databases of chemical compounds and their biological activities. | Critical sources of data, but contain errors and inconsistencies; require careful curation to avoid "garbage in" [57] [60]. |
| DiffPhore [8] | A knowledge-guided diffusion model for 3D ligand-pharmacophore mapping and binding conformation generation. | Represents a next-generation AI tool that integrates explicit matching rules to improve output reliability. |
The journey from a computational model to a experimentally confirmed active compound is fraught with the peril of the GIGO principle. As demonstrated, the success of a pharmacophore-guided drug discovery campaign is not primarily determined by the complexity of the AI algorithm, but by the quality, relevance, and rigorous experimental validation of the underlying data [56] [60]. Researchers must prioritize a data-centric mindset, embracing iterative cycles of computational prediction and experimental feedback. This approach transforms the pharmacophore model from a static hypothesis into a dynamic, evidence-driven tool, effectively ensuring that high-quality input leads to high-value, reliable output.
Handling Molecular Flexibility and Conformational Coverage in Test Sets
Validating pharmacophore models against experimental data is a critical step in computational drug discovery. The predictive power and real-world applicability of a model are fundamentally determined by the quality of the test sets used during this validation phase. Among various factors, adequately handling molecular flexibility and ensuring comprehensive conformational coverage present significant challenges. Flexible molecules can adopt multiple low-energy conformations, yet test sets often lack sufficient conformational diversity, potentially leading to overoptimistic validation results and models that fail when applied to novel chemotypes. This guide objectively compares current methodologies and computational tools for building better conformational test sets, providing researchers with experimental protocols and data to inform their validation strategies.
Comparative Analysis of Methodologies and Tools
The table below summarizes the primary computational approaches for handling molecular flexibility in pharmacophore model validation, along with their key advantages and limitations.
Table 1: Comparison of Methodologies for Handling Molecular Flexibility
| Methodology | Underlying Principle | Reported Performance/Advantages | Key Limitations |
|---|---|---|---|
| Structure-Based Pharmacophore (SBP) Modeling [61] [3] | Generates pharmacophore features directly from protein-ligand complex structures. | Identifies essential interaction points (HBD, HBA, hydrophobic); Used to identify a promising ESR2 inhibitor (ZINC05925939) with a binding affinity of -10.80 kcal/mol [61]. | Limited by the availability and quality of protein-ligand crystal structures. |
| Dynamic Pharmacophore Modeling (dyphAI) [5] | Integrates machine learning with an ensemble of pharmacophore models from molecular dynamics (MD) simulations. | Captures key protein-ligand interactions (e.g., π-cation) over time; Identified novel AChE inhibitors with IC₅₀ values lower than the control galantamine [5]. | Computationally intensive; Requires expertise in MD and machine learning. |
| Shape-Focused Pharmacophore (O-LAP) [24] | Clusters overlapping atoms from docked active ligands to create cavity-filling, shape-based models. | Improves docking enrichment; Effective in both docking rescoring and rigid docking [24]. | Performance depends on the quality and quantity of the initial docked poses. |
| Pharmacophore-Informed Generative Models (TransPharmer) [62] | Uses generative AI models conditioned on pharmacophore fingerprints for de novo molecule design. | Excels at scaffold hopping, producing structurally distinct but pharmaceutically related compounds; Generated a novel PLK1 inhibitor (IIP0943) with 5.1 nM potency [62]. | Generated molecules require experimental validation; Model training is complex. |
Essential Research Reagents and Computational Tools
A successful validation workflow relies on a combination of software tools and data resources. The following table details key components of the computational scientist's toolkit.
Table 2: Research Reagent Solutions for Conformational Coverage
| Item Name | Type | Key Function in Validation | Example Use Case |
|---|---|---|---|
| LigandScout [61] [3] | Software | Generates and validates structure-based pharmacophore models from protein-ligand complexes. | Used to create a shared feature pharmacophore (SFP) model for mutant ESR2 proteins [61]. |
| ZINC/CMNPD Databases [61] [3] | Compound Library | Provides large, commercially available compound libraries for virtual screening and test set construction. | A virtual screening of the ZINC database identified 18 novel potential AChE inhibitors [5]. |
| DUDE-Z/DUD-E [24] | Benchmarking Set | Provides curated sets of active ligands and property-matched decoys for rigorous method evaluation. | Used to benchmark the performance of the shape-focused O-LAP tool [24]. |
| PLANTS [24] | Docking Software | Performs flexible molecular docking to generate multiple binding poses for ligands. | Used to generate top-ranked poses of active ligands as input for the O-LAP clustering algorithm [24]. |
| ROCSErg [24] | Shape Similarity Tool | Measures 3D shape and chemical feature overlap between a molecule and a template. | A common tool for evaluating shape-based screening methods as an alternative to docking [24]. |
Experimental Protocols for Validation
To ensure the reliability of your pharmacophore models, follow these detailed experimental protocols for test set construction and validation.
Protocol for Structure-Based Test Set Construction and Validation
This protocol is adapted from studies on ESR2 and SARS-CoV-2 PLpro inhibitors [61] [3].
Protein and Ligand Preparation:
- Retrieve high-resolution (e.g., 2.0–2.5 Å) protein-ligand complex structures from the Protein Data Bank (PDB). Filters should include organism (e.g., Homo sapiens) and experimental method (X-ray diffraction) [61].
- Prepare the protein structure by adding hydrogen atoms, assigning partial charges, and optimizing hydrogen bonds using tools like REDUCE or the protein preparation wizard in Schrödinger's Maestro.
- For the co-crystallized ligand, generate 3D conformers and optimize the geometry using LIGPREP or a similar tool, ensuring all tautomeric and ionization states at physiological pH (7.4 ± 0.2) are considered [5].
Pharmacophore Model Generation:
- Load the prepared protein-ligand complex into pharmacophore modeling software (e.g., LigandScout).
- In the structure-based modeling perspective, generate an initial pharmacophore model. The software will automatically identify key interaction features (H-bond donors/acceptors, hydrophobic interactions, aromatic rings, etc.) between the ligand and the protein [3].
- Manually optimize the model by adjusting the tolerance (e.g., ±0.3 Å) and weight of pharmacophoric features and adding exclusion volume spheres to represent the protein's steric constraints [3].
Test Set Curation and Conformational Expansion:
- Compile a set of known active compounds and decoys. Actives can be gathered from scientific literature with reported experimental IC₅₀ values, while property-matched decoys can be sourced from databases like DEKOIS 2.0 [3].
- For each molecule in the test set, generate multiple low-energy conformations. This is critical for representing molecular flexibility. Use conformer generation tools like CONFGEN (Schrödinger) or OMEGA (OpenEye), with settings to produce a representative ensemble (e.g., 50-100 conformers per molecule) while maintaining a reasonable energy window (e.g., 10-20 kcal/mol above the global minimum).
Model Validation and Screening:
- Validate the model's ability to distinguish actives from decoys. Screen the prepared test set (with multiple conformers per compound) against the pharmacophore model.
- Calculate enrichment metrics and generate a Receiver Operating Characteristic (ROC) curve. A robust model should have an Area Under the Curve (AUC) significantly greater than 0.5 (random selection). For example, a validated pharmacophore model for ALK inhibitors achieved an AUC of 0.889 [63].
Protocol for Evaluating Conformational Coverage using Dynamic Pharmacophore Ensembles
This protocol is based on the dyphAI approach for AChE inhibitors [5].
System Setup and Molecular Dynamics (MD) Simulation:
- Begin with a high-quality protein-ligand complex structure. Place it in a solvated box with explicit water molecules (e.g., TIP3P water model) and neutralize the system with ions.
- Energy-minimize the system and equilibrate it under standard temperature (310 K) and pressure (1 bar) conditions.
- Run an unrestrained MD simulation for a sufficient duration to capture relevant motions (e.g., 100-200 ns). Save the trajectory at regular intervals (e.g., every 100 ps).
Ensemble Pharmacophore Model Generation:
- Extract multiple snapshots from the MD trajectory, ensuring they represent diverse conformational states of the protein-ligand complex.
- Generate a structure-based pharmacophore model for each snapshot using software like LigandScout.
- Combine these individual models into a consensus or ensemble pharmacophore model that represents the dynamic interaction profile over time.
Machine Learning Integration and Virtual Screening:
- Cluster a large database of known inhibitors (e.g., from BindingDB) based on structural similarity using fingerprints and the Tanimoto metric [5].
- For each cluster, train a machine learning model (e.g., a classifier or regressor) using features derived from the ensemble pharmacophore or the inhibitor structures.
- Use the trained models to perform virtual screening on large compound databases (e.g., ZINC22). The hits identified should be ranked based on the model's prediction score or binding energy estimates (e.g., from docking).
Workflow Visualization
The diagram below illustrates the logical relationship and workflow between the different methodologies discussed for building and validating pharmacophore models with robust conformational coverage.
Diagram 1: Computational Workflows for Pharmacophore Validation. This workflow outlines three complementary paths for developing and validating pharmacophore models, emphasizing the handling of molecular flexibility through static structural data (Path A), molecular dynamics (Path B), and generative AI/shape-based approaches (Path C).
Robust handling of molecular flexibility is not merely a technical detail but a foundational aspect of validating reliable pharmacophore models. As the comparative data shows, no single method is universally superior; each offers distinct advantages. Structure-based approaches provide a clear structural rationale, dynamic methods like dyphAI capture essential protein-ligand interaction plasticity, and generative models like TransPharmer offer powerful avenues for scaffold hopping. The choice of methodology should be guided by the specific research question, data availability, and computational resources. By adopting the rigorous experimental protocols and utilizing the toolkit outlined in this guide, researchers can construct conformationally comprehensive test sets, leading to pharmacophore models with greater predictive power and a higher probability of success in experimental validation.
The selection of optimal computational models is a pivotal challenge in modern drug discovery, directly impacting the efficiency and success of lead identification and optimization campaigns. Traditional model selection approaches often rely on generalized validation studies or practitioner experience, which may fail to identify the best-performing model for specific molecular systems or target classes. Within pharmacophore-based drug discovery—a methodology centered on abstracting essential chemical interaction patterns between ligands and their protein targets—appropriate model selection critically influences virtual screening outcomes and the reliability of predicted bioactivity. This guide objectively compares emerging machine learning (ML)-driven model selection strategies against conventional selection methods, framing the evaluation within the broader thesis of validating pharmacophore models against experimental data. Supported by recent case studies and quantitative benchmarks, we provide drug development professionals with a structured analysis to inform their computational strategy decisions.
Comparative Analysis of Model Selection Strategies
The table below compares the performance and characteristics of traditional versus ML-enhanced model selection strategies, synthesizing data from recent implementation case studies.
Table 1: Performance Comparison of Model Selection Strategies in Drug Discovery
| Selection Strategy | Key Methodology | Reported Performance Metrics | Primary Advantages | Limitations / Challenges |
|---|---|---|---|---|
| Traditional Selection (Single Model or BMI-based) | Selection based on population similarity to model development cohort or external validation studies [64]. | Variable accuracy; prone to systematic bias when patient demographics diverge from original study populations [64]. | Simple to implement; requires no specialized ML infrastructure [64]. | Lacks individualization; performance inconsistent for patients from underrepresented populations [64]. |
| ML-Guided Ranking & Averaging | Multi-label classification (e.g., XGBoost) ranks/averages multiple PK models based on patient features [64]. | Outperformed all single PK models and BMI-based selection; higher proportion of predictions within 80-125% of observed values [64]. | Highly individualized selections; improves early dosing decisions in absence of TDM data [64]. | Requires large, high-quality training datasets; model performance dependent on feature completeness [64]. |
| AI-Enhanced Pharmacophore Modeling (DiffPhore) | Knowledge-guided diffusion framework for 3D ligand-pharmacophore mapping [8]. | Surpassed traditional pharmacophore tools and advanced docking methods in predicting binding conformations [8]. | Superior virtual screening power for lead discovery and target fishing [8]. | Training requires specialized 3D ligand-pharmacophore pair datasets [8]. |
| Dynamic Pharmacophore Ensemble (dyphAI) | Integrates ML, ligand-based, and complex-based models into a pharmacophore model ensemble [5]. | Identified 18 novel AChE inhibitors; experimental validation showed 2 compounds with IC₅₀ ≤ control (galantamine) [5]. | Captures key protein-ligand interaction dynamics; high experimental validation success rate [5]. | Protocol complexity may require significant computational expertise and resources [5]. |
Experimental Protocols for Key Studies
ML-Guided Pharmacokinetic Model Selection for Vancomycin
This study developed a machine learning model to guide the selection of population pharmacokinetic (PK) models for vancomycin dosing [64].
- Dataset Preparation: The analysis utilized 343,636 vancomycin therapeutic drug monitoring (TDM) records from 156 healthcare centers. Records were filtered to include only the first TDM sample for each adult patient, with stringent exclusion criteria applied to remove physiologically implausible or ambiguous entries [64].
- A Priori Predictions: For each included patient record, a priori concentration predictions were generated using six different population PK models. The predictions were based solely on patient covariates, dosing history, and population point estimates of PK parameters, deliberately excluding inter-individual variability to simulate a true a priori scenario [64].
- Multi-Label Classification: A machine learning model was trained using a multi-label classification approach. The target variable for each PK model was a binary label indicating whether its prediction fell within 80-125% of the empirically observed TDM value. XGBoost was used as the base algorithm, with patient characteristics (e.g., age, weight, serum creatinine, BMI) and derived features serving as inputs [64].
- Model Ranking and Averaging: At the prediction stage, the trained ML model assigned a probability score to each of the six PK models for a new patient. Models were ranked based on these probabilities. The final prediction was generated either by selecting the top-ranked model or by averaging predictions across models, weighted by their ML-assigned probabilities [64].
Experimental Validation of dyphAI for AChE Inhibitor Discovery
This protocol combined machine learning and ensemble pharmacophore modeling to discover novel Acetylcholinesterase (AChE) inhibitors for Alzheimer's disease [5].
- Ligand Clustering and Complex-Based Pharmacophore Modeling: Inhibitors with known IC₅₀ values against human AChE were obtained from the BindingDB database. These molecules underwent structural similarity clustering. For each resulting cluster, representative molecules were subjected to induced-fit docking against multiple human AChE structures. Molecular dynamics simulations of the resulting complexes were then used to generate complex-based pharmacophore models [5].
- Machine Learning Model Training: A predictive machine learning model was trained for each of the nine identified inhibitor families. These models were designed to learn the structural and pharmacophoric patterns associated with AChE inhibition within their respective clusters [5].
- Virtual Screening and Experimental Validation: The ensemble of ML models and pharmacophore models was used to screen the ZINC22 database. Eighteen top-ranking molecules were selected, and nine were acquired for experimental testing. Their inhibitory activity against human AChE was measured in vitro, yielding experimental IC₅₀ values for direct comparison with computational predictions [5].
Knowledge-Guided Diffusion for Ligand-Pharmacophore Mapping
The DiffPhore framework represents a state-of-the-art approach to integrating AI with pharmacophore modeling [8].
- Dataset Creation (CpxPhoreSet & LigPhoreSet): Two datasets of 3D ligand-pharmacophore pairs were constructed to train the model. CpxPhoreSet was derived from experimental protein-ligand complex structures, representing real-world, sometimes imperfect, mapping scenarios. LigPhoreSet was generated from energetically favorable ligand conformations, focusing on perfect-mapping pairs and ensuring broad coverage of chemical and pharmacophoric space [8].
- Model Architecture and Training: DiffPhore employs a knowledge-guided diffusion framework. Its core components are:
- A knowledge-guided LPM encoder that incorporates explicit rules for pharmacophore type and directional alignment between ligand atoms and pharmacophore features.
- A diffusion-based conformation generator that uses an SE(3)-equivariant graph neural network to denoise ligand conformations.
- A calibrated conformation sampler that adjusts the perturbation strategy to minimize the gap between training and inference [8].
- Validation: The model was evaluated on independent test sets for its ability to predict binding conformations. Its utility was further demonstrated through a virtual screening campaign for human glutaminyl cyclase inhibitors, with successful predictions validated by co-crystallographic analysis [8].
Workflow Visualization of ML-Enhanced Pharmacophore Discovery
The following diagram illustrates the integrated workflow of machine learning and pharmacophore modeling for novel drug discovery, as demonstrated in the case studies.
Diagram 1: Integrated ML and Pharmacophore Discovery Workflow. This workflow synthesizes methodologies from recent case studies, showing the iterative cycle from computational modeling to experimental validation [5] [64] [8].
The Scientist's Toolkit: Essential Research Reagents and Materials
The table below lists key software, databases, and experimental reagents essential for implementing the described ML-enhanced pharmacophore discovery protocols.
Table 2: Key Research Reagent Solutions for ML-Guided Pharmacophore Discovery
| Item Name / Category | Specific Examples / Specifications | Primary Function in the Workflow |
|---|---|---|
| Compound Databases | ZINC22 [5], TargetMol Anticancer Library [28] | Source of commercially available or annotated compounds for virtual screening and machine learning training. |
| Bioactivity Databases | BindingDB [5], Protein Data Bank (PDB) [28] | Provide experimentally determined structures (PDB) and bioactivity data (IC₅₀, Ki) for model training and validation. |
| Molecular Modeling Suites | Maestro (Schrödinger) [28], SYBYL-X [28] | Integrated platforms for protein preparation, pharmacophore modeling (e.g., Hypothesis), molecular docking, and simulation. |
| Machine Learning Libraries | XGBoost [64], PyTorch/TensorFlow (for Diffusion Models) [8] | Provide algorithms for building classification, ranking, and generative models for PK model selection or ligand generation. |
| Specialized AI Pharmacophore Tools | DiffPhore [8], PharmacoForge [31], dyphAI [5] | End-to-end frameworks employing advanced DL (e.g., diffusion models) for pharmacophore generation, mapping, or screening. |
| Experimental Validation Reagents | Human Acetylcholinesterase (huAChE) Enzyme [5], FGFR1 Kinase Domain [28] | Purified target proteins for in vitro inhibitory activity assays (IC₅₀ determination) to validate computational hits. |
The integration of machine learning for model selection and optimization represents a paradigm shift in computational drug discovery, moving beyond static, one-size-fits-all models toward dynamic, context-aware, and predictive computational frameworks. The empirical data and case studies presented in this guide consistently demonstrate that ML-driven strategies—whether for selecting pharmacokinetic models or optimizing pharmacophore-based virtual screens—deliver superior performance and higher experimental validation rates compared to traditional methods.
The critical advantage of ML integration lies in its ability to synthesize complex, multi-dimensional data (e.g., patient covariates, protein dynamics, chemical diversity) to make individualized predictions. This is evident in the vancomycin case, where ML-based ranking outperformed all single models [64], and in the discovery of novel AChE inhibitors, where an ML and pharmacophore ensemble successfully identified potent leads with experimental IC₅₀ values superior to a control drug [5]. Furthermore, generative AI models like DiffPhore and PharmacoForge are expanding the very capabilities of pharmacophore methods, enabling "on-the-fly" mapping and de novo pharmacophore generation conditioned on protein pockets [8] [31].
For researchers and drug development professionals, the adoption of these advanced optimization techniques necessitates access to high-quality data and specialized computational tools. However, the payoff is substantial: reduced reliance on serendipity, more efficient resource allocation, and a higher probability of clinical success. As these technologies mature, ML-guided model selection will undoubtedly become an indispensable component of the rational drug design toolkit, firmly grounded in the rigorous validation of its predictions against experimental reality.
The Cluster-then-Predict Workflow for Identifying High-Performing Models
In predictive analytics for data with inherent segmentation, the cluster-then-predict workflow has emerged as a powerful hybrid modeling approach that strategically combines clustering with predictive modeling. This methodology first segments data into homogeneous subgroups before building cluster-specific prediction models, offering a compelling alternative to global models [65]. In domains such as drug discovery, where patient populations, chemical compounds, or biological targets naturally form distinct clusters, this approach provides significant advantages. It effectively balances the capacity to model complex, heterogeneous relationships with the need for model transparency and interpretability [65] [66]. While powerful global models like XGBoost offer high predictive performance, they often ignore explicit clustering structures and suffer from limited interpretability, which can be a critical drawback in research environments requiring actionable insights [65]. The cluster-then-predict framework addresses these limitations by creating tailored models for different data segments, often achieving competitive performance while substantially improving interpretability—a crucial factor for researchers validating pharmacophore models against experimental data where understanding model decisions is as important as prediction accuracy [66].
Performance Benchmarking of Cluster-then-Predict Models
Quantitative Performance Comparisons
Extensive benchmarking studies reveal how cluster-then-predict models perform against established global models across diverse domains. When evaluated on 20 benchmark datasets, k-means cluster-then-predict ranked fourth out of eleven models, while CTP approaches using decision trees ranked fifth, demonstrating competitive performance against sophisticated alternatives [65]. In credit scoring applications, a specialized rescaled cluster-then-predict method achieved area under the curve (AUC) performance comparable to XGBoost, with the remarkable advantage of maintaining the interpretability of logistic regression [66]. In some instances, this rescaled approach even enabled logistic regression to outperform XGBoost, particularly when clustering was applied to rescaled quadratic or cubic features [66] [67]. These performance characteristics make cluster-then-predict particularly valuable for pharmacophore model validation, where researchers must balance predictive accuracy with the need to understand model behavior for scientific insight.
Table 1: Performance Benchmarking of Cluster-then-Predict Versus Global Models
| Model Type | Average Ranking | Key Strengths | Optimal Application Context |
|---|---|---|---|
| K-means CTP | 4th out of 11 models [65] | Competitive accuracy, clear segmentation | Heterogeneous datasets with spherical clusters |
| DT CTP | 5th out of 11 models [65] | Substantially simpler interpretation [65] | Complex, non-linear relationships |
| Rescaled CTP | Comparable to XGBoost [66] | High interpretability, computational efficiency [66] | Credit scoring, structured data with regulatory needs |
| XGBoost (Global) | Varies by dataset | High predictive quality [65] | When interpretability is secondary to accuracy |
| Logistic Regression (Global) | Generally lower | High transparency, regulatory compliance [66] | When model explanation is mandatory |
Computational Efficiency Considerations
The computational requirements of cluster-then-predict workflows vary significantly based on implementation choices. Research indicates that clustering only positive cases (e.g., default cases in credit scoring, active compounds in virtual screening) rather than the entire dataset can yield comparable results while markedly reducing computational requirements [66]. Algorithm selection also dramatically impacts scalability, with benchmarking studies showing that K-Means and DBSCAN generally offer better scaling characteristics compared to hierarchical methods like HDBSCAN or spectral clustering [68]. For large-scale virtual screening in pharmacophore validation, where screening millions of compounds is common, these efficiency considerations become critical factors in workflow design.
Table 2: Computational Characteristics of Clustering Algorithms
| Clustering Algorithm | Scaling Profile | Key Parameters | Best Suited for CTP Workflows |
|---|---|---|---|
| K-Means | Efficient, linear-like scaling [68] | Number of clusters (k) | Well-separated, spherical clusters |
| DBSCAN | Good performance with proper parameters [68] | Epsilon (eps), minimum samples | Irregular shapes, noise handling |
| HDBSCAN | Moderate scaling [68] | Minimum cluster size | Varying density clusters |
| Agglomerative | Quadratic scaling challenges [68] | Number of clusters, linkage | Small datasets, hierarchical structure |
| Spectral | Poor scaling to large datasets [68] | Number of clusters, affinity | Non-convex structures, graph data |
Implementation Protocols for Cluster-then-Predict Workflows
Core Methodology and Experimental Design
Implementing an effective cluster-then-predict workflow requires careful attention to both the clustering and prediction phases. The rescaled cluster-then-predict method introduces an important enhancement: feature rescaling based on target impact before clustering, which emphasizes crucial features while dimming less significant ones [66]. This promotes a distance measure that mirrors the essential weight of each feature, unlike standard normalization techniques like min-max or Z-score that do not differentiate feature importance [66]. The protocol proceeds through four key phases: (1) data preprocessing and feature rescaling using methods such as equal weight (EW), regression coefficients (REG), logistic regression coefficients (LR), or mutual information (MI); (2) clustering of rescaled features; (3) training of cluster-specific predictive models; and (4) validation and interpretation of results [66]. For pharmacophore model validation, this approach enables researchers to identify distinct molecular families or binding mode clusters and build targeted validation models for each subgroup.
Application to Pharmacophore Model Validation
In pharmacophore model validation, the cluster-then-predict workflow enables researchers to systematically evaluate model performance across diverse molecular families and target classes. The dyphAI protocol provides an exemplary implementation, integrating machine learning models, ligand-based pharmacophore models, and complex-based pharmacophore models into a pharmacophore model ensemble that captures key protein-ligand interactions [69]. This approach begins with clustering known active compounds into families based on molecular structure, followed by induced-fit docking, molecular dynamics simulations, and ensemble docking to generate diverse receptor conformations [69]. The resulting data then trains machine learning models and generates ligand-based pharmacophore models specific to each cluster. This cluster-wise approach enables more nuanced validation by identifying which pharmacophore features perform best for different molecular families and which structural clusters may require specialized validation protocols or additional feature engineering.
Experimental Data and Case Studies
Success Stories in Drug Discovery
The cluster-then-predict workflow has demonstrated significant value in actual drug discovery pipelines. In the search for novel acetylcholinesterase (AChE) inhibitors, researchers applied a clustering approach to 4,643 known AChE inhibitors, categorizing them into 70 clusters or families based on molecular structure [69]. From these families, nine were selected for further analysis, with representative ligands from each family undergoing induced-fit docking and molecular dynamics simulations [69]. This cluster-informed approach identified 18 novel molecules from the ZINC database with promising binding energy values ranging from -62 to -115 kJ/mol [69]. Experimental validation revealed that two molecules (P-1894047 and P-2652815) exhibited IC₅₀ values lower than or equal to the control (galantamine), while four additional molecules (P-1205609, P-1206762, P-2026435, and P-533735) also demonstrated strong inhibition [69]. This success underscores how clustering-based approaches can efficiently prioritize compounds for experimental validation in pharmacophore studies.
Advanced Implementations and Hybrid Approaches
Beyond basic clustering implementations, advanced hybrid approaches have emerged that enhance traditional virtual screening. The DTIAM framework exemplifies this evolution, learning drug and target representations from large amounts of label-free data through self-supervised pre-training to accurately extract substructure and contextual information [70]. This approach achieves substantial performance improvement over other state-of-the-art methods, particularly in cold start scenarios where limited labeled data is available [70]. Similarly, modern pharmacophore modeling has evolved to incorporate dynamic aspects through molecular dynamics simulations, addressing the critical limitation of static representations that cannot account for protein flexibility and entropic effects in binding [9]. These advanced implementations demonstrate how cluster-then-predict principles can be integrated with contemporary AI methods to create more robust and effective validation frameworks for pharmacophore modeling.
Essential Research Toolkit
Implementing effective cluster-then-predict workflows requires access to specialized computational tools and libraries. The following table summarizes key resources for researchers developing and validating pharmacophore models using this methodology.
Table 3: Essential Research Toolkit for Cluster-then-Predict Implementation
| Tool/Category | Specific Examples | Primary Function | Application Context |
|---|---|---|---|
| Clustering Libraries | Scikit-learn, Fastcluster, HDBSCAN [68] | Data segmentation algorithms | Identifying molecular families, binding mode clusters |
| Machine Learning Frameworks | XGBoost, Scikit-learn, TensorFlow/PyTorch [66] | Predictive model building | Building cluster-specific classification/regression models |
| Pharmacophore Modeling | dyphAI, LigandScout, PharmaGist [69] [9] | Pharmacophore generation & screening | Creating ensemble pharmacophore models for virtual screening |
| Molecular Dynamics | GROMACS, AMBER, CHARMM [69] | Sampling conformational space | Generating dynamic pharmacophore models |
| Docking & Virtual Screening | AutoDock, GOLD, Glide [70] [71] | Binding pose prediction | Structure-based validation of pharmacophore features |
| Cheminformatics | RDKit, OpenBabel, ChemAxon [9] | Molecular descriptor calculation | Feature engineering for clustering and prediction |
Experimental Validation Methodologies
Validating cluster-then-predict workflows in pharmacophore research requires robust experimental protocols that bridge computational predictions with laboratory verification. Standard approaches include experimental determination of IC₅₀ values for inhibitory activity, as demonstrated in the dyphAI study where nine computationally identified molecules were acquired and tested against human acetylcholinesterase [69]. Additional validation methods include binding affinity measurements (Kd, Ki), selectivity profiling across related targets, and functional assays that measure physiological responses [70] [71]. For comprehensive validation, researchers should employ orthogonal techniques including X-ray crystallography of ligand-target complexes to verify predicted binding modes, isothermal titration calorimetry (ITC) to quantify binding thermodynamics, and surface plasmon resonance (SPR) to measure binding kinetics [9]. These experimental validations are essential for establishing the real-world utility of cluster-then-predict workflows in practical drug discovery settings.
The cluster-then-predict workflow represents a sophisticated methodology for identifying high-performing models in pharmacophore validation and drug discovery. By strategically segmenting data before model building, this approach balances the competing demands of predictive accuracy and interpretability—a crucial consideration for scientific applications where understanding model behavior is as important as performance [66]. The demonstrated success of these methods in identifying novel acetylcholinesterase inhibitors with potent experimental activity confirms their practical utility in real-world drug discovery [69]. As the field advances, the integration of cluster-then-predict principles with emerging technologies such as self-supervised pre-training frameworks [70], large language models [71], and AlphaFold-predicted structures [71] promises to further enhance their capability and applicability. For researchers validating pharmacophore models against experimental data, these workflows offer a systematic framework for navigating complex biological and chemical spaces while maintaining the interpretability needed for scientific insight and decision-making.
Benchmarking and Correlating Model Predictions with Experimental Results
Establishing the Applicability Domain for Your Validated Model
In computational drug discovery, a validated pharmacophore model is a powerful tool for virtual screening and activity prediction. However, the reliability of any model is intrinsically linked to the chemical space it was built upon. The Applicability Domain (AD) defines the boundary in chemical space where a model's predictions are considered reliable. Establishing a well-defined AD is not an optional step but a critical component of model validation, ensuring that the model is used for its intended purpose and that predictions for new compounds are trustworthy. Without a clear AD, researchers risk extrapolating beyond the model's capabilities, leading to false positives, wasted resources, and failed experimental validation. This guide compares key methodologies for establishing the AD, providing a structured framework for researchers to benchmark and select the appropriate strategy for their pharmacophore models within the context of experimental research.
Core Concepts: What Constitutes the Applicability Domain?
The Applicability Domain is a multidimensional space defined by the structural and response information of the training set compounds. A model is considered reliable only when making predictions for compounds that fall within this domain. The AD is characterized by several key aspects:
- Structural and Feature-based Similarity: The new compound should share relevant chemical features and structural motifs with the compounds used to train the model [72].
- Physicochemical Property Range: The model's predictive power is confined to a specific range of molecular descriptors, such as molecular weight, logP, or hydrogen bond donors/acceptors, representative of the training set [2].
- Model-Specific Boundaries: The defined AD is dependent on the model's construction. For instance, a pharmacophore model built on flavonols for anti-HBV activity has an AD primarily relevant to other flavonols and structurally similar compounds [6].
Methodologies for Establishing the Applicability Domain
Several computational approaches are employed to define the AD, each with its strengths and limitations. The choice of method depends on the model type, the available data, and the desired level of stringency. The following workflow outlines the strategic decision process for selecting and implementing these methods.
Distance-Based Methods
Distance-based methods are among the most common approaches for defining the AD. They operate on the principle that a compound is within the AD if it is sufficiently similar to the training set compounds in a defined chemical space.
- Euclidean Distance inDescriptor Space: This method involves calculating the Euclidean distance between a new compound and its nearest neighbor in the training set within a space defined by molecular descriptors (e.g., MACCS keys, physicochemical properties) [72]. A threshold distance (e.g., the maximum distance observed in the training set) is set, beyond which a compound is considered outside the AD.
- t-Distributed Stochastic Neighbor Embedding (t-SNE) for Chemical Space Visualization: t-SNE is a dimensionality reduction technique invaluable for visualizing the chemical space of a training set and a new compound library. By plotting the t-SNE projections, researchers can visually assess whether new compounds fall within the cluster of training compounds or reside in sparsely populated or empty regions of the chemical space, indicating they are outside the AD [72].
One-Class Classification
This machine learning approach is designed to recognize patterns from a single class (the training set). The one-class model learns the boundaries of the training set's chemical space, and any new compound that does not fit this profile is classified as an outlier and considered outside the AD [72]. This method is particularly useful when only active compounds are available for training, or when the goal is to strictly exclude compounds that are structurally divergent.
Range-Based and Geometric Methods
These methods define the AD based on the ranges of individual molecular descriptors or the overall geometry of the training set.
- Descriptor Range Method: The simplest approach, it defines the AD as the maximum and minimum values observed for each molecular descriptor in the training set. A new compound is within the domain only if the values of all its descriptors fall within these ranges [6]. While easy to implement, it can be overly strict if descriptors are correlated.
- Leverage and PCA-Based Methods: The applicability domain can be defined using the leverage matrix, where the critical leverage is calculated based on the number of model descriptors and training set compounds. A new compound with a leverage higher than the critical value is considered influential and may be outside the AD. This is often coupled with Principal Component Analysis (PCA), where the AD is defined by the range of the dominant principal components that explain most of the variance in the training set data [6].
Table 1: Comparison of Key Applicability Domain Establishment Methods
| Method | Underlying Principle | Key Statistical Metric | Best-Suited For | Reported Performance |
|---|---|---|---|---|
| Euclidean Distance [72] | Spatial proximity in descriptor space | Average minimum Euclidean distance | Models with well-defined, continuous descriptor spaces | Effective for intentional domain expansion; success varies |
| One-Class Classification [72] | Recognition of in-class patterns vs. outliers | Outlier detection rate | Scenarios with limited or only active training compounds | Can distinguish meaningful data from noise in expansion studies |
| Descriptor Range [6] | Bounding box of training set descriptor values | Pass/fail against min-max ranges | Simple, interpretable models with few, uncorrelated descriptors | High interpretability but can be overly restrictive |
| Leverage/PCA [6] | Influence and variance within the training set | Critical leverage, Hotelling's T² | Multivariate models where data structure and influence are key | PCA shown to explain >98% variance in validated QSAR models [6] |
Experimental Protocols for AD Validation
Establishing the AD computationally must be followed by experimental validation to confirm its practical relevance and the model's predictive power within its defined boundaries.
Protocol for Test Set Validation
This protocol uses a dedicated, external set of compounds to assess the model's predictive robustness.
- Test Set Curation: Meticulously select a test set of compounds that is independent of the training set. This set should ensure diversity in chemical structures and a broad range of bioactivities to properly benchmark the model [2].
- Activity Prediction: Apply the validated pharmacophore model to predict the biological activities (e.g., pIC50) of the test set compounds [2].
- Performance Metrics Calculation: Rigorously evaluate the accuracy of predictions using established metrics.
- R²pred (Predictive R²): Calculated as per Eq. (4):
R²pred = 1 - [Σ(Y(test) - Ypred(test))² / Σ(Y(test) - Y(training))²], whereY(test)andYpred(test)are the observed and predicted activity values of the test set, andY(training)is the mean activity of the training set [2]. A value greater than 0.5 is generally considered acceptable. - Root-Mean-Square Error (rmse): Calculated using Eq. (3):
rmse = √[Σ(Y - Ypred)² / n], which measures the differences between values predicted by the model and the observed values [2]. A high Q² value and low rmse indicate the model’s better predictive ability.
- R²pred (Predictive R²): Calculated as per Eq. (4):
Protocol for Decoy Set Validation & Enrichment Assessment
This protocol evaluates the model's ability to distinguish active compounds from inactive ones (decoys), which is crucial for virtual screening.
- Decoy Set Generation: Use a database like DUD-E (Directory of Useful Decoys: Enhanced) to systematically generate decoys. These are molecules that are physically similar to active compounds (based on molecular weight, logP, number of hydrogen bond donors/acceptors, etc.) but are chemically distinct to prevent bias [2] [17].
- Virtual Screening: Screen the combined set of active and decoy molecules using the pharmacophore model and predict their activities (e.g., pIC50) [2].
- Confusion Matrix and ROC Analysis: Categorize the results into True Positives (TP), True Negatives (TN), False Positives (FP), and False Negatives (FN). Use this matrix to generate a Receiver Operating Characteristic (ROC) curve and calculate the Area Under the Curve (AUC). A high AUC value (closer to 1.0) indicates excellent ability to enrich active compounds over decoys [2].
Table 2: Key Reagents and Computational Tools for AD Research
| Research Reagent / Tool | Type | Primary Function in AD Studies | Example Source |
|---|---|---|---|
| DUD-E Database | Online Database | Provides unbiased decoy molecules for validation of virtual screening and enrichment assessment [2] [17]. | http://dude.docking.org/ |
| ChEMBL Database | Online Database | A rich source of bioactive, drug-like molecules used to curate training and test sets with experimental bioactivity data [72]. | https://www.ebi.ac.uk/chembl |
| t-SNE Algorithm | Computational Algorithm | Dimensionality reduction for visualizing and comparing the chemical space of training sets and compound libraries to assess AD coverage [72]. | Implemented in various programming languages (e.g., Python's scikit-learn) |
| MACCS Keys | Molecular Descriptor | A set of 166-bit structural keys used to fingerprint molecules, enabling similarity searches and chemical space analysis [72]. | Available in cheminformatics toolkits (e.g., RDKit) |
| Pharmit | Web Tool | Facilitates pharmacophore-based virtual screening and can be used with decoy sets for model validation [17]. | http://pharmit.csb.pitt.edu |
Case Study: Domain Expansion for a CYP2B6 Inhibition Model
A study aimed to expand the AD of a CYP2B6 inhibition machine learning model exemplifies the practical challenges and methodological considerations. The model's initial AD was limited by the small amount of public data available for CYP2B6 compared to other isoforms [72].
- Initial AD Definition: The researchers used a distance-based approach and t-SNE plots to define the initial chemical space of their model's training set [72].
- Targeted Library Selection: They compared this chemical space with a 49-plate drug-repurposing library. Using Euclidean distance as a measure of feature similarity, they identified the plate with the highest average minimum distance from the training set, representing the most structurally diverse compounds to test [72].
- Experimental Testing and Model Retraining: The selected plate was tested in vitro for CYP2B6 inhibition at 10 μM. This new experimental data was then added to the machine learning model's training set [72].
- Outcome and Analysis: The expansion effort successfully increased the diversity of the training set. However, a one-class classification evaluation revealed that the new compounds did not appreciably increase the model's performance or its well-defined AD. The new structural variation was largely interpreted as background noise, showing that intentional expansion is neither simple nor straightforward. Despite this, the experiment successfully identified new inhibitors (vilanterol and allylestrenol), demonstrating the value of the process for lead discovery even if the primary AD goal was not fully met [72].
The following diagram illustrates this integrated computational and experimental workflow.
Establishing the Applicability Domain is a fundamental and non-negotiable step in the workflow of pharmacophore model validation. As demonstrated, methods range from simple descriptor ranges to more complex distance-based and machine-learning approaches. The case study on CYP2B6 highlights that while defining and even expanding the AD is challenging, a rigorous methodology is indispensable for interpreting model predictions correctly. By integrating the computational strategies and experimental protocols outlined in this guide—including test set validation, decoy set screening, and rigorous statistical analysis—researchers can objectively benchmark their models, define their reliable boundaries, and ultimately, make more informed and successful decisions in the drug discovery pipeline.
Correlating Virtual Screening Hits with Experimental IC50 and Binding Affinity Data
In modern drug discovery, the journey from a computational prediction to a experimentally validated hit compound is pivotal. Virtual screening (VS) serves as a powerful computational technique to identify potential hit compounds from vast chemical libraries, but its ultimate value is determined by how well these computational hits correlate with experimental biological activity, typically measured through IC50, Ki, Kd, or percentage inhibition in binding assays [73]. This correlation forms the critical bridge between in silico predictions and tangible drug discovery progress, ensuring that pharmacophore models and other computational approaches generate biologically relevant leads. The validation of these models against experimental data is not merely a supplementary step but a fundamental requirement for establishing credibility in computational findings within the broader scientific community.
Comparative Analysis of Virtual Screening Methodologies and Experimental Correlation
Different virtual screening approaches demonstrate varying success rates in identifying compounds that show meaningful experimental activity. The table below summarizes the performance and characteristics of major VS methodologies based on published studies and benchmarks.
Table 1: Performance Comparison of Virtual Screening Methodologies
| Methodology | Typical Library Size Screened | Average Hit Rate | Typical Experimental Affinity Range | Key Strengths | Experimental Correlation Challenges |
|---|---|---|---|---|---|
| Structure-Based Pharmacophore | 100,000 - 1,000,000 [1] | ~14% (for validated hits) [11] | High micromolar to nanomolar [1] | Direct incorporation of 3D structural information; Good enrichment of actives [1] | Dependent on quality of protein structure; May overlook novel scaffolds |
| Ligand-Based Pharmacophore | 100,000 - 1,000,000 | 10-15% | Low to mid-micromolar [73] | No protein structure required; Can identify diverse chemotypes | Limited by knowledge of existing actives; May perpetuate existing biases |
| Molecular Docking (Traditional) | 1,000,000 - 10,000,000 [73] | 5-10% | Mid to high micromolar [73] | Detailed binding pose prediction; Physical interaction modeling | Scoring function inaccuracies; Limited receptor flexibility |
| AI-Accelerated VS (RosettaVS) | >1,000,000,000 (ultra-large) [74] | 14-44% (target-dependent) [74] | Single-digit micromolar [74] | High speed and accuracy; Models receptor flexibility; Excellent enrichment [74] | Computational intensity; Requires HPC resources |
The performance metrics reveal that while all methods can identify valid hits, the correlation between computational predictions and experimental binding affinity varies significantly. A critical analysis of virtual screening results published between 2007-2011 found that only approximately 30% of studies reported a clear, predefined hit cutoff, indicating a lack of consensus in hit identification criteria that complicates cross-study comparisons [73]. The most successful implementations combine multiple approaches - for instance, using pharmacophore models for initial filtering followed by more rigorous docking studies [11] [1].
Table 2: Analysis of Virtual Screening Hit Criteria from 400+ Studies (2007-2011)
| Hit Identification Metric | Percentage of Studies | Typical Activity Range | Remarks on Experimental Correlation |
|---|---|---|---|
| Percentage Inhibition | ~20% [73] | >50% inhibition at screening concentration | Direct activity measure but lacks potency information |
| IC50/EC50 | ~9% [73] | 1-100 µM | Provides potency data but requires full concentration curves |
| Ki/Kd | ~1% [73] | Nanomolar to micromolar | Direct binding measurement but more resource-intensive |
| Not Reported | ~70% [73] | Variable | Makes correlation assessment difficult |
The data demonstrates that virtual screening hit rates and ligand efficiencies show considerable variation depending on the target, screening library quality, and stringency of hit criteria [73]. Recent advances in AI-accelerated platforms like RosettaVS have demonstrated remarkable improvements, achieving enrichment factors (EF1%) of 16.72 in benchmark studies, significantly outperforming other methods [74].
Experimental Protocols for Validating Virtual Screening Hits
Primary Binding Assays
The initial experimental validation of virtual screening hits typically employs binding assays to confirm direct interaction with the target:
Biochemical Inhibition Assays: For enzymatic targets, compounds are tested in concentration-response format to determine IC50 values. A representative protocol involves testing compounds across a dilution series (typically from 100 µM to 1 nM in half-log increments) against the purified target enzyme, with measurements taken in triplicate [75]. Positive controls (known inhibitors) and negative controls (DMSO vehicle) are essential for normalization. For example, in the validation of GES-5 carbapenemase inhibitors, researchers employed biochemical assays against recombinant enzyme, identifying six hits in the high micromolar range [75].
Direct Binding Measurements: Surface plasmon resonance (SPR) or thermal shift assays provide direct evidence of binding without requiring functional activity. SPR protocols typically involve immobilizing the target protein on a chip surface and measuring compound binding kinetics across a concentration series to determine Kd values [74].
Cellular Activity Assessment
Confirmed binding hits advance to cellular models to assess membrane permeability and functional activity in a more physiologically relevant context:
Cell Viability/Proliferation Assays: For oncology targets, compounds are tested against relevant cancer cell lines using MTT, MTS, or CellTiter-Glo assays. For example, in prostate cancer AR-targeted screening, researchers performed in vitro assays demonstrating that identified compounds significantly inhibited proliferation, migration, and invasion of prostate cancer cells [76].
Mechanistic Cellular Assays: Additional cellular experiments examine target engagement and downstream effects. In the validation of BET inhibitors for neuroblastoma, researchers performed gene expression analysis of MYCN and other downstream targets to confirm mechanism of action [11]. For AR inhibitors, nuclear translocation assays and qPCR measurement of AR-regulated genes (FKBP5, KLK3) provided mechanistic validation [76].
Orthogonal Validation Techniques
X-ray Crystallography: When structurally enabled, determining the co-crystal structure of hit compounds with the target protein provides the highest quality validation of binding mode predictions. The RosettaVS platform demonstrated this capability with a high-resolution X-ray crystallographic structure validating the predicted docking pose for a KLHDC2 ligand complex [74].
Counter-Screening and Selectivity Profiling: To exclude promiscuous binders and assess selectivity, hits are screened against related targets. Approximately 28% of virtual screening studies included counter-screens to confirm selectivity of hits [73].
Figure 1: Experimental Validation Workflow for Virtual Screening Hits. This diagram illustrates the multi-tiered approach for correlating computational predictions with experimental data, from initial binding confirmation to mechanistic understanding.
Signaling Pathways and Molecular Mechanisms
Understanding the biological context of molecular targets is essential for proper interpretation of virtual screening results and their experimental validation.
Figure 2: Key Cancer Signaling Pathways Targeted by Virtual Screening Campaigns. Understanding these pathways is crucial for designing appropriate experimental validation assays and interpreting IC50/binding affinity data in relevant biological context.
The Scientist's Toolkit: Essential Research Reagents and Materials
Successful correlation of virtual screening hits with experimental data requires specific reagents and tools throughout the validation pipeline.
Table 3: Essential Research Reagents for Virtual Screening Validation
| Reagent/Material | Application | Key Function in Validation | Examples from Literature |
|---|---|---|---|
| Recombinant Target Proteins | Biochemical assays | Enables direct binding and inhibition measurements | Recombinant GES-5 carbapenemase [75], XIAP protein [1] |
| Validated Cell Lines | Cellular assays | Provides physiological context for target engagement | Prostate cancer cell lines for AR inhibitors [76], neuroblastoma cells for BET inhibitors [11] |
| Reference Compounds | Assay controls | Benchmark for experimental activity and validation | Enzalutamide for AR-targeted screens [76], known BET inhibitors for comparison [11] |
| Crystallography Reagents | Structural validation | Confirms predicted binding modes when structurally enabled | Crystallization screens, cryoprotectants for structure determination [74] |
| Activity-Based Assay Kits | Functional screening | Standardized measurement of target inhibition | Caspase activity assays for XIAP inhibitors [1], ubiquitination assays for KLHDC2 [74] |
The correlation between virtual screening hits and experimental binding affinity data remains a critical checkpoint in computational drug discovery. The evidence demonstrates that success rates vary significantly based on methodology, target class, and stringency of hit criteria. While traditional virtual screening approaches typically identify hits with mid-micromolar activities, advances in AI-accelerated platforms and improved scoring functions are increasingly delivering hits with single-digit micromolar affinities. The most successful campaigns employ tiered experimental validation protocols that progress from simple binding assays to mechanistic cellular studies and, when possible, structural validation. As virtual screening continues to evolve toward billion-compound libraries, the development of standardized protocols for correlating computational predictions with experimental data will become increasingly important for advancing pharmacophore model validation and accelerating drug discovery.
In the field of computer-aided drug design, pharmacophore modeling and molecular docking represent two fundamental methodologies for identifying and optimizing potential therapeutic compounds. Pharmacophore models abstract the essential steric and electronic features necessary for molecular recognition, while molecular docking predicts the preferred orientation of a small molecule within a protein's binding site. As both techniques are widely employed in virtual screening, understanding their comparative performance, strengths, and limitations is crucial for effective drug discovery pipeline design. This analysis examines their performance characteristics within the context of experimental validation, highlighting how these approaches can be used synergistically rather than as mutually exclusive alternatives.
Theoretical Foundations and Performance Characteristics
Fundamental Principles and Definitions
Pharmacophore modeling operates on the concept that ligands interacting with a specific biological target share common chemical features necessary for binding, such as hydrogen bond donors/acceptors, hydrophobic regions, charged groups, and aromatic rings. These models can be ligand-based (derived from active compounds) or structure-based (derived from protein-ligand complexes). In contrast, molecular docking computationally predicts the binding pose and affinity of a small molecule within a protein's binding site through sampling algorithms and scoring functions, requiring detailed 3D structural information of the target protein.
Comparative Performance Metrics
Table 1: Performance Comparison of Pharmacophore Modeling vs. Molecular Docking
| Performance Metric | Pharmacophore Modeling | Molecular Docking |
|---|---|---|
| Screening Speed | High-throughput; rapid filtering of large libraries | Computationally intensive; slower screening process |
| Chemical Space Exploration | Broad identification of diverse chemotypes | More constrained by predefined binding site geometry |
| Handling Protein Flexibility | Limited in standard implementations | Can incorporate flexibility through ensemble docking or MD simulations |
| Pose Prediction Accuracy | Not designed for precise pose prediction | Specialized for binding mode prediction |
| Enrichment Performance | Excellent for scaffold hopping and diverse hit identification | Effective when binding site geometry is well-defined |
| Dependency on Structural Data | Can operate with or without protein structure | Requires high-quality protein 3D structure |
Recent studies demonstrate that pharmacophore models can achieve excellent enrichment factors (EF) in virtual screening. For X-linked inhibitor of apoptosis protein (XIAP) inhibitors, a structure-based pharmacophore model demonstrated an enrichment factor of 10.0 at the 1% threshold with an AUC value of 0.98, indicating strong ability to distinguish active compounds from decoys [1]. Similarly, in screening for VEGFR-2 and c-Met dual inhibitors, pharmacophore models with AUC >0.7 and EF >2 were considered reliable for virtual screening [77].
Molecular docking excels in binding mode prediction and detailed interaction analysis. In the identification of PKMYT1 inhibitors for pancreatic cancer, molecular docking provided critical insights into specific residue interactions such as those with CYS-190 and PHE-240, which were later validated through molecular dynamics simulations [78]. The hierarchical docking approach (HTVS → SP → XP) implemented in studies allows for efficient processing of large compound libraries while maintaining accuracy in pose prediction [78].
Methodological Approaches and Experimental Protocols
Pharmacophore Model Development Workflow
Structure-based pharmacophore generation typically begins with analysis of protein-ligand complexes. For example, in developing models for XIAP inhibitors, researchers used the LigandScout software to analyze a complex (PDB: 5OQW) and identify 14 chemical features including hydrophobics, hydrogen bond donors/acceptors, and positive ionizable features [1]. The protocol involves:
- Protein-ligand complex preparation - removing water molecules, adding hydrogens, and energy minimization
- Interaction analysis - identifying key protein-ligand interactions
- Feature identification - mapping pharmacophore features to interactions
- Model validation - using known actives and decoys to calculate enrichment metrics
Ligand-based approaches, as implemented in the PHASE module, involve aligning multiple active compounds to identify common features. In a study on type II VEGFR-2 kinase inhibitors, researchers developed hypotheses ADDHRR6 and ADDHRR10 from a set of six active ligands, which demonstrated good predictive capabilities in atom-based 3D QSAR modeling [79].
Molecular Docking Protocols
Standardized docking protocols typically involve:
- Protein preparation - using tools like Protein Preparation Wizard in Schrödinger to add hydrogens, assign bond orders, optimize hydrogen bonding, and minimize energy [78]
- Ligand preparation - generating 3D structures, possible tautomers, and stereoisomers using LigPrep [79]
- Grid generation - defining the binding site based on known ligand coordinates or active site residues
- Hierarchical docking - employing high-throughput virtual screening (HTVS) followed by standard precision (SP) and extra precision (XP) modes for pose refinement and scoring [78]
Advanced implementations may incorporate molecular dynamics simulations to account for protein flexibility. As demonstrated in a study on Src kinase family inhibitors, MD simulations of apo structures provided insights into water dynamics within binding sites, enabling the development of water-based pharmacophore models that captured interaction hotspots missed by static approaches [26].
Integrated Workflows
Diagram: Integrated Virtual Screening Workflow
Figure 1: Sequential virtual screening workflow combining multiple computational approaches for hit identification.
The most effective virtual screening strategies often combine both techniques sequentially. A representative integrated protocol includes:
- Initial filtering using drug-likeness rules (Lipinski's Rule of Five, Veber's parameters)
- Pharmacophore-based screening to rapidly reduce library size
- Molecular docking of top pharmacophore hits for pose prediction and affinity estimation
- Molecular dynamics simulations to assess binding stability and calculate binding free energies
- Experimental validation of top candidates [77] [78]
This cascading approach was successfully implemented in the discovery of VEGFR-2/c-Met dual inhibitors, where screening of 1.28 million compounds from the ChemDiv database identified 18 promising hits through sequential application of pharmacophore modeling and molecular docking [77].
Case Studies in Drug Discovery
Kinase Inhibitor Development
Kinase targets have been particularly amenable to comparative studies of these methods. In targeting VEGFR-2 kinase, researchers developed pharmacophore hypotheses (ADDHRR6 and ADDHRR10) that identified key interactions with Asp1046, Glu885, Glu917, and Cys919 residues. Virtual screening of the Maybridge database using these hypotheses followed by molecular docking identified ten compounds with favorable docking scores and these critical interactions [79]. This demonstrates how pharmacophore models can capture essential interaction patterns, while docking refines the selection based on complementarity and predicted affinity.
For Src family kinases (Fyn and Lyn), a novel water-based pharmacophore modeling approach leveraged MD simulations of explicit water molecules within ligand-free, water-filled binding sites. This strategy identified a flavonoid-like molecule with low-micromolar inhibitory activity, though researchers noted that while conserved core interactions were well-modeled, interactions with flexible regions were less consistently captured [26]. This highlights a limitation of static pharmacophore models in addressing protein flexibility compared to more dynamic approaches.
Emerging AI-Enhanced Approaches
Recent advances in artificial intelligence are creating new opportunities for both methodologies. The DiffPhore framework implements a knowledge-guided diffusion model for 3D ligand-pharmacophore mapping, achieving state-of-the-art performance in predicting ligand binding conformations that surpasses traditional pharmacophore tools and several advanced docking methods [8]. This approach leverages two complementary datasets - CpxPhoreSet (derived from experimental complexes with real but biased mapping scenarios) and LigPhoreSet (generated from energetically favorable ligand conformations with perfect-matching pairs) - to capture both realistic and ideal ligand-pharmacophore relationships.
Integrated Approaches and Synergistic Applications
Synergistic Workflow Design
The most effective virtual screening strategies leverage the complementary strengths of both approaches. Pharmacophore models excel at rapid screening of large chemical libraries and identifying diverse chemotypes through scaffold hopping, while molecular docking provides more accurate pose prediction and detailed interaction analysis for a smaller subset of compounds.
Diagram: Synergistic Application in Hit Identification
Figure 2: Complementary roles of computational methods in the drug discovery pipeline.
Research Reagent Solutions
Table 2: Essential Computational Tools for Virtual Screening
| Tool Category | Representative Software | Primary Function | Application Context |
|---|---|---|---|
| Pharmacophore Modeling | PHASE [79], LigandScout [1], Phase [78] | Generate and screen pharmacophore models | Ligand- and structure-based pharmacophore development |
| Molecular Docking | Glide [79] [78], MOE [80] | Protein-ligand docking and virtual screening | Binding pose prediction and affinity estimation |
| Molecular Dynamics | Desmond [78], Amber [26] | Simulation of biomolecular systems | Assessing binding stability and conformational changes |
| Structure Preparation | Protein Preparation Wizard [78], ChimeraX [26] | Protein structure optimization | Preprocessing for docking and simulations |
| Compound Libraries | ZINC [1], ChemDiv [77], TargetMol [78] | Sources of screening compounds | Virtual screening campaigns |
Discussion and Future Perspectives
Both pharmacophore modeling and molecular docking have demonstrated substantial value in virtual screening, with their performance highly dependent on the specific application context. Pharmacophore models generally excel in early-stage screening where speed and chemical diversity are priorities, while molecular docking provides more detailed interaction insights for lead optimization. The integration of both methods, along with molecular dynamics simulations, creates a powerful pipeline for drug discovery as evidenced by multiple successful applications across various target classes [79] [77] [78].
Future directions in the field include increased incorporation of protein flexibility through MD-derived pharmacophores [26], AI-enhanced approaches like DiffPhore for improved ligand-pharmacophore mapping [8], and more sophisticated water-based pharmacophore models that explicitly account for solvent effects in molecular recognition. As these computational methods continue to evolve, their validation against experimental data remains essential for refining algorithms and increasing predictive accuracy in drug discovery applications.
Using Molecular Dynamics Simulations to Validate Binding Stability and Free Energy (MM-GBSA)
In modern computer-aided drug design, pharmacophore modeling serves as a powerful starting point for identifying potential lead compounds by mapping essential interaction features between a ligand and its biological target. However, the true predictive power of these models hinges on their validation against experimental data, moving beyond simple structural matching to quantitative binding affinity assessment. Within this validation framework, Molecular Dynamics (MD) simulations coupled with Molecular Mechanics with Generalized Born and Surface Area (MM-GBSA) binding free energy calculations have emerged as a robust computational methodology. This approach provides a crucial bridge between initial pharmacophore-based virtual screening and experimental verification by offering atomistic insights into binding stability and quantifying the energetics of molecular recognition.
While pharmacophore models effectively reduce the chemical search space, they often lack the dynamic and energetic components necessary to reliably predict binding affinity. The integration of MD simulations with end-point free energy methods like MM-GBSA addresses this limitation by accounting for target flexibility, solvation effects, and entropic contributions—factors increasingly recognized as critical for accurate binding affinity prediction in drug discovery pipelines. This comparative guide examines how this integrated computational methodology serves as a validation framework within the broader thesis of computational model verification, providing researchers with practical protocols and benchmarks for assessing performance against experimental data.
Methodological Comparison: MM-GBSA in the Computational Toolkit
Multiple computational methods exist for estimating protein-ligand binding affinities, each with distinct trade-offs between accuracy, computational cost, and implementation complexity. The table below provides a systematic comparison of MM-GBSA with other prevalent approaches:
Table 1: Comparison of Computational Methods for Binding Affinity Prediction
| Method | Theoretical Basis | Accuracy/Speed | Key Advantages | Key Limitations |
|---|---|---|---|---|
| Docking & Scoring | Empirical scoring functions | Fast but limited accuracy [81] | High throughput; Pose prediction | Limited correlation with experimental affinity [82] |
| MM/GBSA | End-point method with implicit solvation [81] | Intermediate accuracy & speed [83] | Balances speed/accuracy; Incorporates flexibility [82] | Sensitive to parameters; Implicit solvent approximation [81] |
| MM/PBSA | End-point method with Poisson-Boltzmann solver [81] | Slower than GB; Accuracy system-dependent [83] | More rigorous electrostatics | Computationally demanding; Same limitations as GBSA [81] |
| FEP/TI | Alchemical transformation [83] | High accuracy but slow [83] [82] | Considered gold standard for accuracy [82] | Very high computational cost; Complex setup [83] |
| Machine Learning | Pattern recognition on training data [82] | Fast after training; Accuracy data-dependent [82] | Very high throughput; No force field needed | Black box; Limited extrapolation beyond training data [82] |
For pharmacophore model validation, MM-GBSA occupies a strategic position in this ecosystem, offering significantly better accuracy than docking while remaining computationally feasible for the dozens to hundreds of compounds typically identified through pharmacophore screening [11] [1]. Its intermediate position makes it particularly valuable for rank-ordering compounds after pharmacophore-based virtual screening but before committing to more resource-intensive FEP calculations or experimental testing.
Experimental Protocols: Implementing MD/MM-GBSA for Validation
Integrated Workflow for Pharmacophore Model Validation
The following diagram illustrates the comprehensive workflow for validating pharmacophore models using MD simulations and MM-GBSA, showing how computational and experimental components integrate:
Core Methodological Steps
System Preparation and Molecular Dynamics
The validation protocol begins with preparing the protein-ligand complexes identified through pharmacophore screening. Key steps include:
Structure Preparation: Obtain protein structures from databases like PDB, remove crystallographic water molecules, add missing hydrogen atoms, and assign protonation states appropriate for physiological pH [11] [1]. For ligands, assign charges using appropriate methods such as AM1-BCC or RESP [83].
Solvation and Neutralization: Solvate the system in an explicit water model (e.g., TIP3P) and add counterions to neutralize the system charge [84].
Energy Minimization: Perform steepest descent and conjugate gradient minimization to remove steric clashes [84].
Equilibration: Conduct gradual heating to the target temperature (typically 300K) followed by equilibrium simulations with positional restraints on heavy atoms [84].
Production MD: Run unrestrained simulations typically for 50-100 nanoseconds, saving snapshots at regular intervals (e.g., every 100ps) for subsequent MM-GBSA analysis [11] [1]. Multiple short replicates may be preferable to single long trajectories for improved sampling [84].
MM-GBSA Calculation Protocol
The binding free energy is calculated using the MM-GBSA approach according to the following thermodynamic cycle:
Table 2: MM-GBSA Energy Components and Descriptions
| Energy Component | Description | Calculation Method |
|---|---|---|
| ΔEMM | Molecular mechanics energy in vacuum | Sum of bonded (bond, angle, dihedral) and non-bonded (electrostatic + van der Waals) terms [81] |
| ΔGGB | Polar solvation energy | Generalized Born model [81] |
| ΔGSA | Non-polar solvation energy | Solvent accessible surface area (SASA) model [81] |
| -TΔS | Entropic contribution | Normal mode analysis or interaction entropy approach [85] |
The binding free energy (ΔGbind) is calculated as [81]: ΔGbind = ΔEMM + ΔGsolv - TΔS where ΔGsolv = ΔGGB + ΔGSA
In practice, the entropy term (-TΔS) is often omitted for virtual screening applications due to its high computational cost and potential to introduce noise [81] [85], with researchers relying on the enthalpy-dominated terms (ΔGbind,enthalpy) for rank-ordering compounds.
Performance Benchmarking: Quantitative Assessment of Predictive Power
Comparative Performance Across Methodologies
Multiple studies have systematically evaluated the performance of MM-GBSA against other computational approaches:
Table 3: Performance Comparison of Free Energy Calculation Methods
| Study Context | Comparison | Key Finding | Correlation with Experiment |
|---|---|---|---|
| 4 Protein Targets, 172 Compounds [82] | MM-GBSA vs FEP+ vs Docking | FEP+ outperformed MM-GBSA for targets requiring large conformational changes | Prime MM-GBSA: Competitive for kinases; FEP+: Superior for flexible targets |
| 6 Soluble & 3 Membrane Proteins [83] | MM/PB(GB)SA vs FEP vs Docking | MM/PB(GB)SA showed comparable accuracy to FEP | MM/PB(GB)SA: Competitive with FEP; Docking: Worst performance |
| Kinase Targets [82] | MM-GBSA with varying protein flexibility | Adding protein flexibility did not consistently improve correlations | Prime MM-GBSA (no flexibility): Best balance of accuracy/speed for kinases |
| >1500 Protein-Ligand Systems [85] | Entropy calculation methods | Interaction entropy method recommended for entropic contributions | Improved absolute binding free energies with entropy correction |
Specific Validation Case Studies
Neuroblastoma Drug Discovery
In a study targeting the Brd4 protein for neuroblastoma treatment, researchers employed a comprehensive workflow beginning with structure-based pharmacophore modeling. After virtual screening identified 136 natural compounds, the candidates underwent molecular docking, ADMET analysis, and MD simulations. Four final hits were validated using MM-GBSA, which confirmed their binding stability and provided quantitative binding free energy estimates to prioritize them for experimental testing [11].
XIAP-Targeted Cancer Therapeutics
Another investigation focused on identifying natural XIAP inhibitors for cancer treatment. The researchers developed a structure-based pharmacophore model validated through a decoy set method with an excellent area under the curve (AUC) value of 0.98. After virtual screening and docking identified promising candidates, MD simulations combined with MM-GBSA calculations confirmed the stability and binding free energies of three final compounds, demonstrating the power of this integrated approach for validating pharmacophore models against energetic criteria [1].
Implementation Guide: Practical Considerations for Researchers
The Scientist's Toolkit: Essential Research Reagents
Table 4: Essential Computational Tools for MD/MM-GBSA Studies
| Tool Category | Specific Examples | Primary Function |
|---|---|---|
| MD Simulation Packages | AMBER [84], GROMACS, CHARMM | Perform molecular dynamics simulations |
| MM-GBSA Analysis Tools | MMPBSA.py [84], g_mmpbsa, Prime MM-GBSA [82] | Calculate binding free energies from MD trajectories |
| Pharmacophore Modeling | LigandScout [11] [1], Discovery Studio [33] | Generate and validate structure-based pharmacophore models |
| Virtual Screening | ZINC database [11] [1], DUD-E decoy generator [2] | Compound sourcing and validation set generation |
| Visualization & Analysis | VMD, Chimera [84], PyMOL | Trajectory analysis and figure generation |
Critical Parameters and Optimization Strategies
Successful implementation of MD/MM-GBSA for pharmacophore validation requires careful attention to several methodological considerations:
Dielectric Constant Selection: The internal dielectric constant (εin) significantly impacts predictions. For MD-based MM-GBSA, εin = 1-4 is typically used, with higher values (εin = 4) often providing better correlation with experimental data, particularly when combined with entropy corrections [85].
Sampling Considerations: The single-trajectory approach (using only the complex simulation) is most common and provides favorable error cancellation, but may be inadequate for systems with large conformational changes upon binding. For such cases, a multiple-trajectory approach (simulating complex, receptor, and ligand separately) may be necessary despite increased computational cost and noise [81] [84].
Membrane Protein Systems: For membrane-bound targets (e.g., GPCRs), specialized implementations that account for the heterogeneous membrane environment are essential. Recent advancements in tools like AMBER's MMPBSA.py include automated membrane parameter calculation to address this challenge [84].
Force Field Selection: While MM-GBSA predictions show relative insensitivity to force field choice, the ff03 force field (for proteins) combined with GAFF (for ligands) and AM1-BCC charges has demonstrated excellent performance in systematic evaluations [85].
Within the broader thesis of validating pharmacophore models against experimental data, MD simulations combined with MM-GBSA calculations provide an indispensable methodological framework that substantially enhances the predictive power of structure-based drug discovery. This integrated approach moves beyond static structural matching to incorporate dynamic and energetic components essential for reliable binding affinity prediction. The quantitative benchmarks and case studies presented demonstrate that while MM-GBSA has limitations—particularly regarding implicit solvent approximations and entropic estimation—it occupies a crucial middle ground between high-throughput docking and ultra-high-accuracy FEP methods. For research teams seeking to validate pharmacophore models before committing to expensive synthetic chemistry or experimental testing campaigns, this methodology offers the optimal balance of computational efficiency and predictive accuracy, ultimately accelerating the identification of promising therapeutic candidates with higher probability of experimental success.
Within modern computational drug discovery, pharmacophore modeling serves as a pivotal strategy for translating molecular recognition into actionable, three-dimensional queries. A pharmacophore is defined as an abstract description of the structural and chemical features—such as hydrogen bond donors/acceptors, hydrophobic regions, and charged groups—essential for a ligand's biological activity [27]. As these models become increasingly sophisticated, the critical step that determines their success or failure in a project is rigorous validation. This review synthesizes methodologies and outcomes from recent, high-quality validation studies to provide a standardized framework for evaluating pharmacophore model performance. By comparing validation protocols, statistical metrics, and—most importantly—subsequent experimental confirmation, this guide offers a clear benchmark for assessing model reliability prior to costly experimental investment.
Core Principles of Pharmacophore Model Validation
Validation ensures that a computational pharmacophore model possesses genuine predictive power for identifying biologically active compounds. A well-validated model must demonstrate two key characteristics: discriminative power, the ability to distinguish active from inactive molecules, and robustness, consistent performance across different chemical datasets [27] [6].
The validation process typically involves internal validation using a training set to ensure the model accurately represents the known active compounds, and external validation using a separate, decoy set containing known actives and inactives. External validation assesses the model's predictive capability for new, untested compounds [63] [6]. Key performance metrics include sensitivity (the ability to correctly identify active compounds), specificity (the ability to correctly identify inactive compounds), and the use of Receiver Operating Characteristic (ROC) curves with the corresponding Area Under the Curve (AUC) to provide a comprehensive view of model performance [27] [63].
Comparative Analysis of Validation Methodologies and Outcomes
This section objectively compares published pharmacophore validation studies, summarizing quantitative outcomes and experimental protocols to establish performance benchmarks.
Table 1: Comparative Validation Metrics from Published Pharmacophore Studies
| Therapeutic Target | Validation Type | Key Metric | Reported Value | Reference |
|---|---|---|---|---|
| Anaplastic Lymphoma Kinase (ALK) | Statistical (ROC Analysis) | AUC (Area Under Curve) | 0.889 | [63] |
| Anti-HBV Flavonols | Statistical | Sensitivity | 71% | [6] |
| Specificity | 100% | [6] | ||
| PIM2 Kinase | Experimental (Cell Assay) | IC50 (Cytotoxicity) | 0.839 µM (MDA-231 cells) | [86] |
| PLK1 Kinase (TransPharmer) | Experimental (Enzyme & Cell Assay) | Enzyme Potency (IC50) | 5.1 nM | [62] |
| Cell Proliferation Inhibition | Submicromolar (HCT116 cells) | [62] | ||
| PKMYT1 Kinase (HIT101481851) | In silico & Experimental | Docking Score (Glide XP) | Highly Favorable | [78] |
| Cell Viability Inhibition | Dose-dependent (Pancreatic cancer cells) | [78] |
Detailed Experimental Protocols for Key Validations
The studies summarized in Table 1 employed rigorous, multi-stage protocols to validate their models. The following details the methodologies behind the key results.
Case Study 1: ALK Inhibitors (Statistical Validation). Researchers constructed a structure-based pharmacophore model from five approved ALK inhibitors. The model was validated by screening a library of known active and inactive compounds. The resulting ROC curve with an AUC of 0.889 demonstrated excellent discriminatory power, significantly surpassing the random classification baseline (AUC = 0.5). This high AUC indicates a robust model with a high true positive rate and a low false positive rate, making it suitable for virtual screening [63].
Case Study 2: PIM2 Kinase Inhibitors (QSAR & Cytotoxicity Validation). This study combined a pharmacophore-based QSAR model with experimental cell-based assays. The QSAR model, built from 229 reported PIM2 inhibitors, was used to screen the NCI database. The top hit, compound 230, was then experimentally validated, showing strong activity against MDA-231 cell lines with an IC50 of 0.839 µM and complete PIM2 kinase inhibition at 100 µM. This integrated approach confirms that the model successfully predicted a compound with genuine biological activity [86].
Case Study 3: PLK1 Inhibitors (Generative Model & Multi-Assay Validation). This study validated the TransPharmer generative model, which integrates pharmacophore fingerprints. The model generated novel compounds featuring a 4-(benzo[b]thiophen-7-yloxy)pyrimidine scaffold, distinct from known inhibitors. Out of four synthesized compounds, three showed submicromolar activity in enzyme inhibition assays, with the most potent, IIP0943, achieving a potency of 5.1 nM. Furthermore, IIP0943 demonstrated high selectivity for PLK1 and submicromolar inhibitory activity in HCT116 cell proliferation assays, validating the model's ability to perform "scaffold hopping" and generate bioactive, novel ligands [62].
Visualizing Validation Workflows and Signaling Pathways
The following diagrams illustrate the common pathways targeted in validation studies and the logical flow of integrated validation protocols.
Kinase Inhibition Signaling Pathway
Many validated pharmacophore models target protein kinases, which are critical in cancer. The diagram below illustrates a simplified signaling pathway of a kinase inhibitor, such as those targeting ALK [63] or PKMYT1 [78], leading to cell cycle arrest and apoptosis.
Integrated Computational-Experimental Validation Workflow
A robust validation strategy integrates multiple computational and experimental steps, as seen in several high-impact studies [62] [78] [63]. The workflow below outlines this multi-stage process.
The Scientist's Toolkit: Essential Research Reagents and Solutions
Successful validation relies on a suite of specialized software tools, databases, and experimental assays. The following table catalogs key resources employed in the reviewed studies.
Table 2: Key Research Reagent Solutions for Pharmacophore Validation
| Category | Specific Tool / Assay | Function in Validation | Example Use Case |
|---|---|---|---|
| Computational Software | Schrödinger Suite (Phase, Glide) | Structure-based pharmacophore modeling and molecular docking. | PKMYT1 inhibitor discovery [78]. |
| MOE (Molecular Operating Environment) | Ligand-based pharmacophore modeling and virtual screening. | MMP-12 inhibitor identification [87]. | |
| LigandScout | Creating and visualizing advanced pharmacophore models. | Anti-HBV flavonol model generation [6]. | |
| Chemical Databases | NCI Database | Public library of compounds for virtual screening. | Screening for PIM2 kinase inhibitors [86]. |
| TargetMol Natural Compound Library | Library of natural products for screening. | Virtual screening for PKMYT1 inhibitors [78]. | |
| ChEMBL / PubChem | Repositories of bioactivity data and chemical structures. | Sourcing active ligands for model building [6]. | |
| Experimental Assays | In vitro Enzyme Inhibition Assay | Measures direct inhibition of the target enzyme's activity. | Validation of MMP-12 inhibitors [87]. |
| Cell-based Viability/Proliferation Assay (e.g., IC50) | Measures compound's ability to kill or inhibit growth of cancer cells. | Validation of PIM2 [86] and PKMYT1 [78] inhibitors. | |
| NMR & HRMS | Nuclear Magnetic Resonance and High-Resolution Mass Spectrometry for compound characterization. | Confirming structure and purity of synthesized hits [87]. |
This comparative analysis of recent pharmacophore validation studies reveals a consistent theme: success is defined by a multi-faceted approach that integrates strong statistical performance with corroborating experimental evidence. The most compelling studies move beyond excellent AUC values or fit scores and demonstrate a direct link between computational prediction and biological activity in wet-lab experiments. The emergence of generative AI models like TransPharmer, which are inherently guided by pharmacophore principles, further underscores the enduring value of these features in drug design. These models have demonstrated a remarkable capacity for "scaffold hopping," producing structurally novel compounds with potent, experimentally verified bioactivity [62]. As the field progresses, the standard for validation will likely rise, requiring even tighter integration of computational prediction, rigorous in silico profiling, and multi-assay experimental confirmation to translate virtual hits into viable therapeutic leads.
Conclusion
Validating pharmacophore models against robust experimental data is not a mere final step but a fundamental pillar of credible computational drug discovery. A rigorously validated model transforms a theoretical hypothesis into a powerful tool for virtual screening and lead optimization, significantly de-risking the subsequent experimental pipeline. The future of pharmacophore validation lies in the deeper integration of machine learning for automated model selection and refinement, the increased use of molecular dynamics to account for target flexibility, and the development of more sophisticated, standardized benchmarks. By adhering to the comprehensive validation frameworks outlined here, researchers can generate more reliable, predictive models, thereby accelerating the discovery of novel therapeutics for a wide range of diseases.
References
- 1. Structure based pharmacophore modeling, virtual ... [https://www.nature.com/articles/s41598-021-83626-x]
- 2. Validation of pharmacophore model [https://bio-protocol.org/exchange/minidetail?id=19108364&type=30]
- 3. Pharmacophore model-aided virtual screening combined with ... [https://arabjchem.org/pharmacophore-model-aided-virtual-screening-combined-with-comparative-molecular-docking-and-molecular-dynamics-for-identification-of-marine-natural-products-as-sars-cov-2-papain-like-protease-inhibito/]
- 4. Pharmacophore model-aided virtual screening combined ... [https://www.sciencedirect.com/science/article/pii/S1878535222006505]
- 5. dyphAI dynamic pharmacophore modeling with AI: a tool ... [https://pmc.ncbi.nlm.nih.gov/articles/PMC11865752/]
- 6. Pharmacophore modeling and QSAR analysis of anti-HBV ... [https://journals.plos.org/plosone/article?id=10.1371/journal.pone.0316765]
- 7. pharmacophore generation with diffusion models - PMC [https://pmc.ncbi.nlm.nih.gov/articles/PMC12451294/]
- 8. Knowledge-guided diffusion model for 3D ligand ... [https://www.nature.com/articles/s41467-025-57485-3]
- 9. : advances, limitations, and current utility in Pharmacophore modeling [https://www.dovepress.com/pharmacophore-modeling-advances-limitations-and-current-utility-in-dru-peer-reviewed-fulltext-article-JRLCR]
- 10. Methods for generating and applying pharmacophore ... [https://www.sciencedirect.com/science/article/abs/pii/S1046202314003302]
- 11. Pharmacophore-Model-Based Virtual-Screening Approaches ... [https://pmc.ncbi.nlm.nih.gov/articles/PMC9600652/]
- 12. Structure-Based Pharmacophore Modeling, Virtual ... [https://pmc.ncbi.nlm.nih.gov/articles/PMC8777599/]
- 13. Pharmacophore-based virtual screening versus docking ... [https://www.nature.com/articles/aps2009159]
- 14. Structure-based pharmacophore modeling 1. Automated ... [https://www.sciencedirect.com/science/article/abs/pii/S109332632300027X]
- 15. Ligand-Based Pharmacophore Modeling and Virtual ... [https://pmc.ncbi.nlm.nih.gov/articles/PMC4111740/]
- 16. The importance of choosing a proper validation strategy in ... [https://www.sciencedirect.com/science/article/pii/S0003267025012322]
- 17. Structure-based identification of novel FAK1 inhibitors ... [https://www.nature.com/articles/s41598-025-23203-8]
- 18. Advanced machine learning for innovative drug discovery [https://pmc.ncbi.nlm.nih.gov/articles/PMC12333061/]
- 19. ML-AMPSIT: Machine Learning-based Automated Multi ... - GMD [https://gmd.copernicus.org/articles/18/433/2025/]
- 20. Machine learning accelerates pharmacophore-based ... [https://www.nature.com/articles/s41598-024-58122-7]
- 21. Drug Design by Pharmacophore and Virtual Screening ... [https://pmc.ncbi.nlm.nih.gov/articles/PMC9145410/]
- 22. Garbage In Garbage Out: How Poor Data Quality Hurts ... [https://www.v2solutions.com/blogs/gigo-risks-of-poor-data-quality-business-impact/]
- 23. The True Cost of Poor Data Quality – Infographic Insight [https://www.certlibrary.com/blog/the-true-cost-of-poor-data-quality-infographic-insight/]
- 24. Building shape-focused pharmacophore models for effective ... [https://jcheminf.biomedcentral.com/articles/10.1186/s13321-024-00857-6]
- 25. Identification of pharmacophore synergism for optimization ... [https://www.sciencedirect.com/science/article/pii/S266702242500060X]
- 26. Water-Based Pharmacophore Modeling in Kinase Inhibitor ... [https://pmc.ncbi.nlm.nih.gov/articles/PMC12458683/]
- 27. Pharmacophore modeling in drug design [https://www.sciencedirect.com/science/article/abs/pii/S1054358925000109]
- 28. Discovery of Novel FGFR1 Inhibitors via Pharmacophore ... [https://www.mdpi.com/2813-3137/3/4/35]
- 29. Ligand-Based Pharmacophore Modeling, Molecular ... [https://www.mdpi.com/1422-0067/21/20/7779]
- 30. Pharmacophore model, docking, QSAR, and molecular ... [https://www.sciencedirect.com/science/article/pii/S2405844021007088]
- 31. PharmacoForge: pharmacophore generation with diffusion ... [https://www.frontiersin.org/journals/bioinformatics/articles/10.3389/fbinf.2025.1628800/full]
- 32. Pharmacophore model, docking, QSAR, and molecular ... [https://pmc.ncbi.nlm.nih.gov/articles/PMC8047494/]
- 33. Pharmacophore Modeling, Virtual Screening, and ... [https://www.medsci.org/v10p0265.htm]
- 34. Structure-based pharmacophore modeling 2. Developing a ... [https://www.sciencedirect.com/science/article/abs/pii/S1093326323000864]
- 35. Ligand-based pharmacophore modeling, virtual screening ... [https://pubs.rsc.org/en/content/articlehtml/2021/ra/d0ra10168k]
- 36. Pharmacophore modeling and molecular dynamics ... [https://pubmed.ncbi.nlm.nih.gov/40126740/]
- 37. Benchmarking Sets for Molecular Docking - PMC [https://pmc.ncbi.nlm.nih.gov/articles/PMC3383317/]
- 38. Confidence bands and hypothesis tests for hit enrichment curves [https://jcheminf.biomedcentral.com/articles/10.1186/s13321-022-00629-0]
- 39. Discovery of Novel Glucagon Receptor Antagonists Using ... [https://brieflands.com/journals/ijpr/articles/124882]
- 40. PharmRL: pharmacophore elucidation with deep geometric ... [https://bmcbiol.biomedcentral.com/articles/10.1186/s12915-024-02096-5]
- 41. A pharmacophore-guided deep learning approach for ... [https://www.nature.com/articles/s41467-023-41454-9]
- 42. Computational discovery of BRD4 inhibitors for ... [https://www.nature.com/articles/s41598-025-20714-2]
- 43. Pharmacophore-Model-Based Virtual-Screening ... [https://www.mdpi.com/1467-3045/44/10/329]
- 44. Integration of ALK gene mutations and targeted therapies ... [https://pmc.ncbi.nlm.nih.gov/articles/PMC12577807/]
- 45. Emerging clinical and research approaches in targeted ... [https://www.frontiersin.org/journals/oncology/articles/10.3389/fonc.2025.1553511/full]
- 46. Promising Molecular Targets and Novel Therapeutic ... [https://link.springer.com/article/10.1007/s40495-022-00306-8]
- 47. Discovery of pyroptosis-inducing natural products in ... [https://pmc.ncbi.nlm.nih.gov/articles/PMC12276684/]
- 48. Pharmacophore-Guided Generative Design of Novel Drug- ... [https://arxiv.org/html/2510.01480v1]
- 49. Federated Learning for ADMET Prediction [https://www.apheris.com/resources/blog/federated-learning-for-admet-prediction-expanding-model-applicability]
- 50. Machine learning approaches for next-generation ADMET ... [https://www.sciencedirect.com/science/article/abs/pii/S1359644625002004]
- 51. Computational toxicology in drug discovery: applications of ... [https://pubmed.ncbi.nlm.nih.gov/41052279/?utm_source=WordPress&utm_medium=rss&utm_campaign=pubmed-2&utm_content=1xy-1_DjTDyd-wB9jZEeBbNC7P9XerP1w4IuKVF68u4vGBZgJ8&fc=20230802115945&ff=20251014052634&v=2.18.0.post9+e462414]
- 52. Ligand-based Pharmacophore Modeling, Virtual Screening ... [https://www.sciencedirect.com/science/article/pii/S2001037018302617]
- 53. Recent advances in AI-based toxicity prediction for drug ... [https://www.frontiersin.org/journals/chemistry/articles/10.3389/fchem.2025.1632046/full]
- 54. AI-based toxicity prediction models using ToxCast data [https://www.sciencedirect.com/science/article/pii/S0300483X25001891]
- 55. A New Pharmacophore Model for the Design of Sigma-1 ... [https://www.frontiersin.org/journals/pharmacology/articles/10.3389/fphar.2019.00519/full]
- 56. how reliable training data improved a virtual screening ... [https://www.frontiersin.org/journals/pharmacology/articles/10.3389/fphar.2023.1193282/full]
- 57. Garbage in, garbage out, same old story | by David "Dap" ... [https://medium.com/@dapscience/garbage-in-garbage-out-same-old-story-82d72dc3b615]
- 58. “Garbage In, Garbage Out”: How to Stop Your AI from ... - Shelf.io [https://shelf.io/blog/garbage-in-garbage-out-ai-implementation/]
- 59. How AI and Machine Learning are Forging the Next ... [https://www.drugpatentwatch.com/blog/how-ai-and-machine-learning-are-forging-the-next-frontier-of-pharmaceutical-ip-strategy/?srsltid=AfmBOoqHic5ijDcHKP_R3ofFSO5Pfwqq2ekY4boRq67U4oEmfGJC8s9S]
- 60. Establishing the foundations for a data-centric AI approach ... [https://elifesciences.org/reviewed-preprints/97821]
- 61. Structure‐based pharmacophore modeling for precision ... [https://pmc.ncbi.nlm.nih.gov/articles/PMC11299079/]
- 62. Accelerating discovery of bioactive ligands with ... [https://www.nature.com/articles/s41467-025-56349-0]
- 63. Multiscale Computational and Pharmacophore-Based ... [https://www.mdpi.com/1424-8247/18/8/1207]
- 64. Machine Learning‐Based Model Selection and Averaging ... [https://pmc.ncbi.nlm.nih.gov/articles/PMC12521055/]
- 65. Benchmarking Cluster-Then-Predict Models to Challenge ... [https://scholarspace.manoa.hawaii.edu/items/6cd8108a-4767-451d-a6f3-f115c8c5a40f]
- 66. A rescaled cluster-then-predict approach for enhanced ... [https://www.sciencedirect.com/science/article/abs/pii/S1057521923005215]
- 67. A Rescaled Cluster-then-Predict Approach for Enhanced ... [https://papers.ssrn.com/sol3/papers.cfm?abstract_id=4355268]
- 68. Benchmarking Performance and Scaling of Python Clustering ... [https://hdbscan.readthedocs.io/en/latest/performance_and_scalability.html]
- 69. dyphAI dynamic pharmacophore modeling with AI: a tool ... [https://www.frontiersin.org/journals/chemistry/articles/10.3389/fchem.2025.1479763/full]
- 70. DTIAM: a unified framework for predicting drug-target ... [https://www.nature.com/articles/s41467-025-57828-0]
- 71. In silico methods for drug-target interaction prediction - PMC [https://pmc.ncbi.nlm.nih.gov/articles/PMC12570315/]
- 72. Applicability Domain Expansion Studies for Machine ... [https://www.sciencedirect.com/science/article/abs/pii/S009095562509169X]
- 73. Hit Identification and Optimization in Virtual Screening [https://pmc.ncbi.nlm.nih.gov/articles/PMC3772997/]
- 74. An artificial intelligence accelerated virtual screening ... [https://www.nature.com/articles/s41467-024-52061-7]
- 75. First virtual screening and experimental validation of ... [https://pubmed.ncbi.nlm.nih.gov/30603820/]
- 76. Virtual screening and experimental validation of small ... [https://link.springer.com/article/10.1007/s11030-025-11359-4]
- 77. Pharmacophore screening, molecular docking, and MD ... [https://www.frontiersin.org/journals/pharmacology/articles/10.3389/fphar.2025.1534707/full]
- 78. Structure-based discovery and experimental validation of ... [https://www.frontiersin.org/journals/pharmacology/articles/10.3389/fphar.2025.1605741/full]
- 79. Integrated pharmacophore‐based screening and docking ... [https://www.sciencedirect.com/science/article/abs/pii/S3050475924000034]
- 80. Pharmacophore modelling based virtual screening and ... [https://www.nature.com/articles/s41598-024-63555-1]
- 81. The MM/PBSA and MM/GBSA methods to estimate ligand- ... [https://pmc.ncbi.nlm.nih.gov/articles/PMC4487606/]
- 82. Machine Learning Methods as a Cost-Effective Alternative ... [https://www.mdpi.com/1420-3049/29/4/830]
- 83. MM/PB(GB)SA benchmarks on soluble proteins and ... [https://pmc.ncbi.nlm.nih.gov/articles/PMC9751045/]
- 84. Extending MMPBSA for membrane proteins: Addressing ... [https://www.sciencedirect.com/science/article/abs/pii/S0006349525003182]
- 85. Assessing the performance of MM/PBSA and MM/GBSA ... [https://pubs.rsc.org/en/content/articlelanding/2018/cp/c7cp07623a]
- 86. A comprehensive in-silico approach (pharmacophoric ... [https://www.sciencedirect.com/science/article/pii/S157018082500017X]
- 87. Identification and Biological Validation of MMP-12 ... [https://pmc.ncbi.nlm.nih.gov/articles/PMC12573026/]