Structure-Based vs Ligand-Based Virtual Screening: A Comprehensive Guide to Methods, Validation, and AI-Driven Integration
This article provides a comprehensive examination of structure-based and ligand-based virtual screening (SBVS and LBVS) for researchers and drug development professionals.
Structure-Based vs Ligand-Based Virtual Screening: A Comprehensive Guide to Methods, Validation, and AI-Driven Integration
Abstract
This article provides a comprehensive examination of structure-based and ligand-based virtual screening (SBVS and LBVS) for researchers and drug development professionals. It covers the foundational principles of both approaches, detailing their respective methodologies, from molecular docking and pharmacophore modeling to machine learning-enhanced similarity searches. The content explores advanced troubleshooting and optimization strategies to mitigate common pitfalls, and delivers a critical comparative analysis of their validation performance based on real-world benchmarks and case studies. Finally, it synthesizes key takeaways and outlines the future trajectory of virtual screening, emphasizing the growing power of integrated, AI-accelerated platforms to navigate ultra-large chemical spaces in modern drug discovery.
Virtual Screening 101: Core Principles of Structure-Based and Ligand-Based Approaches
Virtual screening (VS) has become an indispensable component of modern drug discovery, serving as a computational counterpart to experimental high-throughput screening [1]. By leveraging sophisticated algorithms and computational power, VS enables researchers to sift through vast chemical libraries containing millions or even billions of compounds to identify promising candidates with a high probability of biological activity against a specific therapeutic target [2] [3]. This in silico approach dramatically reduces the time and cost associated with the early stages of drug development by prioritizing a manageable number of compounds for experimental validation [1]. The foundation of VS rests on understanding the physicochemical properties of molecules, including their three-dimensional shapes, electrostatic potentials, hydrophobic characteristics, and the spatial distribution of functional groups—all critical determinants of drug-target interactions [1].
Within the VS paradigm, two principal strategies have emerged: structure-based virtual screening (SBVS) and ligand-based virtual screening (LBVS). These approaches differ fundamentally in their underlying principles and information requirements, yet share the common goal of efficiently identifying bioactive compounds [4] [5]. SBVS relies on knowledge of the three-dimensional structure of the biological target, typically obtained through experimental methods such as X-ray crystallography, NMR spectroscopy, or cryo-electron microscopy, or increasingly through computational predictions like AlphaFold2 [4] [1]. In contrast, LBVS operates without target structural information, instead leveraging the chemical and biological properties of known active compounds to identify novel hits through similarity principles [3] [1]. The complementary nature of these approaches has spurred continued innovation in hybrid strategies that seek to harness their combined strengths while mitigating their individual limitations [6] [4] [5].
Core Principles and Methodologies
Structure-Based Virtual Screening (SBVS): A Target-Centric Approach
SBVS methodologies center on predicting the molecular interaction between a compound and its target binding site. The most widely employed SBVS technique is molecular docking, which computationally simulates the binding of small molecule ligands to a protein target [3] [1]. The docking process involves two key components: pose generation, which explores possible orientations and conformations of the ligand within the binding site, and scoring, which ranks these poses based on estimated binding affinity using scoring functions [1]. These scoring functions employ various computational approaches, including force-field based methods that calculate energy terms, empirical functions that parameterize experimental data, knowledge-based potentials derived from structural databases, and increasingly, machine learning-based models that learn complex patterns from large datasets [4] [1].
The SBVS workflow typically begins with target preparation, which involves processing the protein structure, defining the binding site, and potentially accounting for flexibility in the receptor [1]. Simultaneously, compound libraries are prepared through chemical standardization and generation of plausible three-dimensional conformations. The docking process then screens each compound against the target, generating predicted binding modes and associated scores that prioritize candidates for experimental testing [1]. A significant advantage of SBVS is its ability to identify novel chemotypes that may be structurally distinct from known activators, as it focuses on complementarity to the binding site rather than similarity to existing ligands [1] [5]. However, SBVS faces challenges including the accurate prediction of binding affinities, accounting for full protein flexibility and solvation effects, and reliance on the quality and relevance of the available target structure [1] [5].
Ligand-Based Virtual Screening (LBVS): A Chemical-Centric Approach
LBVS methodologies operate under the similarity property principle, which states that structurally similar molecules are likely to exhibit similar biological activities [3] [5]. This approach requires one or more known active compounds as reference templates, from which various molecular descriptors are computed to represent key chemical features and properties [1]. These descriptors can be categorized by dimensionality: 1D descriptors encode bulk properties like molecular weight and lipophilicity; 2D descriptors represent topological features such as structural fingerprints and molecular graphs; and 3D descriptors capture spatial characteristics including molecular shape, volume, and pharmacophoric features [5].
Common LBVS techniques include similarity searching, which quantifies the resemblance between molecules using metrics like the Tanimoto coefficient applied to structural fingerprints [3] [7]; pharmacophore modeling, which identifies essential steric and electronic features necessary for molecular recognition [1] [7]; and quantitative structure-activity relationship (QSAR) modeling, which establishes statistical correlations between molecular descriptors and biological activity through machine learning algorithms [4] [7]. The primary strength of LBVS lies in its computational efficiency, enabling the rapid screening of extremely large compound collections without requiring target structural information [1]. However, LBVS is constrained by its dependence on the quality and diversity of known actives, potential bias toward familiar chemotypes, and limited ability to identify novel scaffolds that diverge significantly from established templates [4] [5].
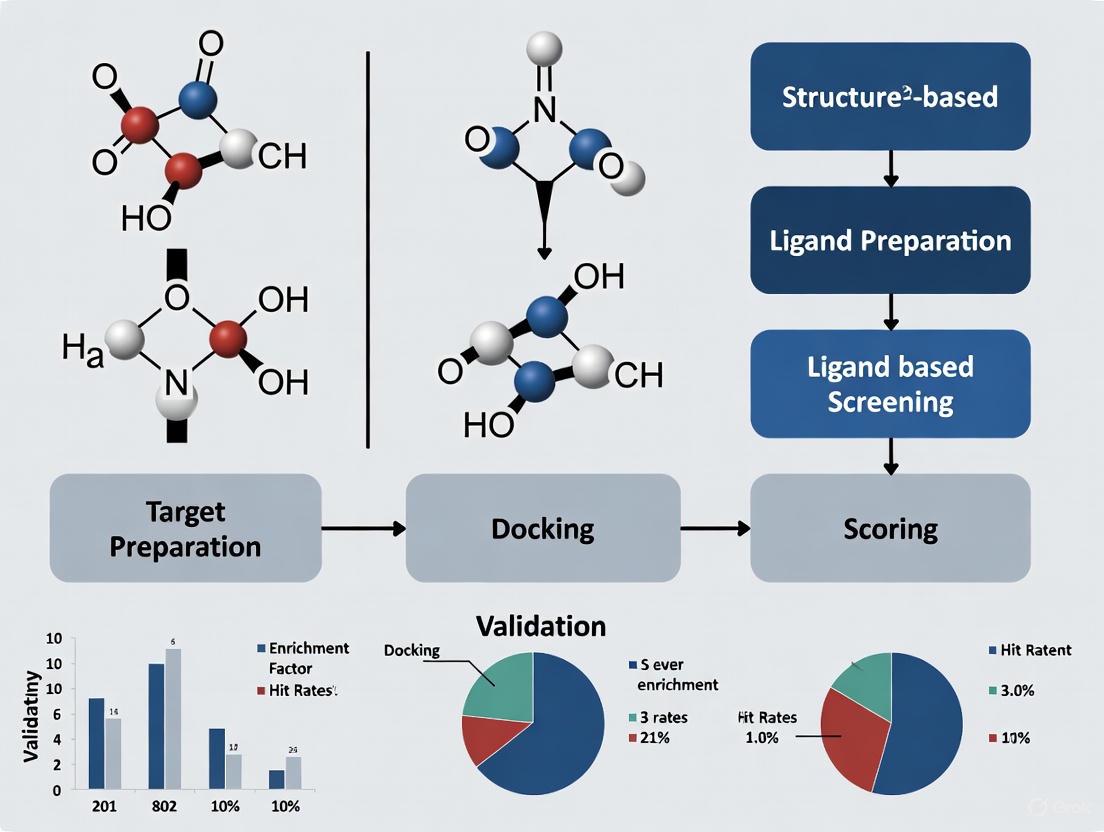
Figure 1: Virtual Screening Workflow Strategies. This diagram illustrates the fundamental workflows for structure-based (SBVS) and ligand-based (LBVS) virtual screening approaches, as well as their combination in hybrid methods [4] [1] [5].
Comparative Analysis: SBVS vs. LBVS
Table 1: Fundamental Characteristics of SBVS and LBVS
| Feature | Structure-Based Virtual Screening (SBVS) | Ligand-Based Virtual Screening (LBVS) |
|---|---|---|
| Information Requirement | 3D structure of target protein | Known active compounds |
| Core Principle | Molecular complementarity to binding site | Chemical similarity to known actives |
| Primary Methodology | Molecular docking and scoring | Similarity searching, pharmacophores, QSAR |
| Chemical Novelty | High potential for novel scaffold identification | Limited by similarity to known chemotypes |
| Computational Cost | Higher (docking computationally intensive) | Lower (rapid similarity calculations) |
| Target Flexibility | Challenging to account for fully | Not applicable (no target structure used) |
| Key Strengths | Identifies novel scaffolds; provides structural insights | High efficiency; no target structure needed |
| Major Limitations | Dependent on quality of target structure; scoring inaccuracies | Limited by knowledge of existing actives; scaffold bias |
Information Requirements and Applicability Domains
The fundamental distinction between SBVS and LBVS lies in their information prerequisites, which directly influences their applicability to different drug discovery scenarios. SBVS requires detailed three-dimensional structural information of the biological target, typically derived from experimental methods such as X-ray crystallography, NMR spectroscopy, or cryo-electron microscopy [1]. With the recent breakthroughs in protein structure prediction via AlphaFold2, SBVS is becoming applicable to a broader range of targets previously lacking experimental structures [4]. This structural foundation enables atomic-level insights into binding interactions and facilitates the identification of completely novel chemotypes that share no obvious structural similarity to known ligands [1] [5].
In contrast, LBVS relies exclusively on knowledge of compounds with confirmed activity against the target of interest, making it particularly valuable for targets with poorly characterized or unknown structures [3] [1]. The performance of LBVS is heavily dependent on the quantity, quality, and structural diversity of known actives, with robust QSAR models typically requiring substantial datasets spanning multiple chemical series and potency ranges [7]. While LBVS excels at finding analogs similar to established chemotypes, it may struggle to identify structurally distinct compounds that interact with the target through novel binding modes [4] [5].
Performance Considerations and Methodological Challenges
Both SBVS and LBVS face distinct methodological challenges that impact their performance and reliability. SBVS methodologies, particularly molecular docking, contend with the accurate prediction of binding affinities—a persistent challenge due to simplifications in scoring functions and the complexities of molecular recognition [1]. The treatment of protein flexibility represents another significant hurdle, as conventional docking often treats receptors as rigid entities despite the dynamic conformational changes that frequently accompany ligand binding [1] [5]. Additionally, the handling of solvent effects, particularly the role of water molecules in mediating protein-ligand interactions, remains computationally demanding and can significantly impact pose prediction and scoring accuracy [5].
LBVS faces its own set of limitations, primarily centered around the "analog bias" or "ligand bias," where overreliance on similar chemical templates may limit structural diversity in screening outputs [7]. The molecular representations and similarity metrics used in LBVS may not fully capture the complex physicochemical properties governing biological activity, potentially leading to false positives or missed opportunities [5] [7]. Furthermore, LBVS models require careful validation to avoid overfitting, particularly with complex machine learning approaches applied to limited training data [7] [8]. The target-dependent performance of both approaches necessitates careful method selection and validation for each specific application [5].
Table 2: Performance Metrics from Comparative Studies
| Evaluation Metric | SBVS Performance | LBVS Performance | Hybrid Methods | Notes |
|---|---|---|---|---|
| Enrichment Factor (EF1%) | Variable (target-dependent) | Variable (target-dependent) | 29.73-52.77 (ENS-VS) [8] | Higher values indicate better early enrichment |
| Area Under Curve (AUC) | ~0.7-0.9 (typical range) | ~0.7-0.9 (typical range) | 0.793-0.982 (ENS-VS) [8] | Measure of overall classification performance |
| Scaffold Novelty | Higher | Lower | Intermediate | SBVS better for identifying novel chemotypes |
| False Positive Rate | Median ~83% in docking [1] | Varies with similarity threshold | Reduced compared to single methods | Significant challenge in SBVS scoring |
| Computational Efficiency | Lower (docking intensive) | Higher (rapid similarity) | Intermediate | LBVS enables larger library screening |
Validation Frameworks and Benchmarking
Benchmarking Datasets and Validation Protocols
Robust validation is essential for assessing the performance of virtual screening methods and guiding their application in prospective drug discovery campaigns. The development of standardized benchmarking datasets has been crucial for objective comparison of SBVS and LBVS approaches [9] [7]. These datasets typically consist of known active compounds paired with "decoys"—carefully selected molecules presumed to be inactive that serve as negative controls [9] [7]. The Directory of Useful Decoys (DUD) and its enhanced version DUD-E have emerged as widely adopted benchmarks containing 102 targets with over 20,000 active compounds and approximately 50 property-matched decoys per active [7] [8]. Other notable resources include DEKOIS, MUV, and target-specific databases designed to minimize biases in performance evaluation [7].
Standard validation protocols involve screening benchmarking datasets and calculating enrichment metrics that quantify the ability to prioritize active compounds over decoys [9] [7]. Common metrics include enrichment factors (EF), which measure the concentration of actives in the top-ranked fraction compared to random selection; receiver operating characteristic (ROC) curves, which plot the true positive rate against the false positive rate across all ranking thresholds; and area under the ROC curve (AUC), which provides an aggregate measure of classification performance [9] [7]. These quantitative assessments enable direct comparison of different screening methods and inform selection of the optimal approach for specific targets or discovery contexts.
Addressing Biases in Benchmarking
The construction of unbiased benchmarking datasets presents significant challenges, as identified in methodological research [9] [7]. Early benchmarking efforts suffered from "artificial enrichment," where decoys differed substantially from actives in simple physicochemical properties, enabling trivial discrimination based on properties like molecular weight rather than specific complementarity [9] [7]. The "analog bias" occurs when actives within a benchmark share high structural similarity, potentially inflating LBVS performance through over-representation of certain chemotypes [7]. Additionally, the potential inclusion of undiscovered active compounds within decoy sets ("false negatives") can lead to underestimated performance metrics [7].
Modern benchmarking databases address these issues through sophisticated decoy selection strategies that match physicochemical properties between actives and decoys while ensuring structural dissimilarity [9] [7]. Tools like DecoyFinder and best practices guidelines enable researchers to generate target-specific benchmarking sets that minimize biases and provide realistic assessment of virtual screening performance [9] [7]. These advances support more reliable method evaluation and translation of retrospective performance to prospective screening success.
Hybrid Approaches: Integrating SBVS and LBVS
Combination Strategies and Workflows
Recognizing the complementary strengths and limitations of SBVS and LBVS, researchers have developed hybrid strategies that integrate both approaches to enhance screening performance [4] [5]. These hybrid methods can be categorized into three primary architectures: sequential, parallel, and fully integrated approaches [4] [5]. Sequential strategies apply LBVS and SBVS in consecutive steps, typically using faster ligand-based methods for initial filtering followed by more computationally intensive structure-based techniques for refined assessment [5]. This funnel-based approach optimizes the trade-off between computational efficiency and screening accuracy, though it may discard true positives that perform poorly in the initial filtering stage [4] [5].
Parallel strategies execute LBVS and SBVS independently and subsequently combine their results through data fusion algorithms that reconcile rankings from both approaches [4] [5]. These methods require careful normalization of heterogeneous scores from different techniques but preserve the individual strengths of each approach [4]. Integrated hybrid methods merge ligand- and structure-based information into a unified framework, such as interaction fingerprint techniques that encode protein-ligand interaction patterns while incorporating ligand structural features [6] [4]. For example, the Fragmented Interaction Fingerprint (FIFI) combines extended connectivity fingerprints of ligands with spatial proximity to binding site residues, retaining sequence order information that distinguishes similar interactions with different residues [6].
Machine Learning-Enhanced Hybrid Methods
The integration of machine learning has significantly advanced hybrid virtual screening approaches, enabling more effective leveraging of both ligand and structure information [4] [8]. ML-based methods can learn complex relationships between molecular features and bioactivity from training data, often outperforming traditional scoring functions [4] [8]. Ensemble learning approaches, such as the ENS-VS method, integrate multiple classifiers including support vector machines, decision trees, and Fisher linear discriminant analysis to improve prediction accuracy and robustness across diverse targets [8]. These methods typically use combined descriptors incorporating both protein-ligand interaction energy terms and ligand structural features to capture complementary information [8].
Interaction fingerprint-based approaches represent another promising direction for hybrid screening, encoding protein-ligand interaction patterns as bit vectors that can be used with machine learning models [6] [4]. These fingerprints, such as PLEC, EIFP, and the recently developed FIFI, facilitate hybrid virtual screening by simultaneously representing ligand structural characteristics and their interactions with the binding site [6]. Retrospective evaluations demonstrate that these hybrid methods can achieve superior performance compared to individual LBVS or SBVS approaches, particularly when limited active compounds are available for training [6].
Figure 2: Hybrid Virtual Screening Strategies. Three primary architectures for combining SBVS and LBVS: sequential, parallel, and integrated approaches [4] [5].
Experimental Protocols and Case Studies
Representative Experimental Protocols
Protocol 1: FIFI (Fragmented Interaction Fingerprint) Implementation
The FIFI method represents a recent advancement in hybrid virtual screening that integrates ligand-based and structure-based information through interaction fingerprints [6]. The protocol begins with preparation of protein-ligand complexes, typically through docking of known active compounds into the target binding site. For each complex, FIFI is constructed by identifying extended connectivity fingerprint (ECFP) atom environments of the ligand that are proximal to protein residues in the binding site [6]. Each unique ligand substructure within each amino acid residue is encoded as a bit while retaining the sequence order of residues, distinguishing it from previous interaction fingerprints like PLEC that do not preserve sequence information [6]. The resulting FIFI vectors are then used with machine learning classifiers (such as Random Forest or Support Vector Machines) trained on known active and inactive compounds. In retrospective validation across six biological targets, FIFI demonstrated consistently higher prediction accuracy compared to existing interaction fingerprints, particularly when limited active compounds were available for training [6].
Protocol 2: ENS-VS (Ensemble Learning Virtual Screening) Workflow
The ENS-VS method employs ensemble learning to improve virtual screening performance through the following steps [8]: First, all active and decoy compounds from benchmarking datasets like DUD-E are docked into the target binding site using Autodock Vina, with the best pose selected for each ligand based on docking score. Next, five protein-ligand interaction energy terms are calculated alongside structure vectors of the ligands to create combined descriptors that capture both interaction energetics and ligand structural features [8]. To address class imbalance between active and decoy compounds, ENS-VS implements a sampling ensemble approach that generates multiple balanced training subsets. Finally, an ensemble classifier integrating Support Vector Machine, Decision Tree, and Fisher Linear Discriminant algorithms predicts compound activity, with majority voting determining the final classification [8]. This approach demonstrated significant improvements in early enrichment (EF1% = 29.73-52.77) compared to traditional docking or single-classifier methods across multiple benchmarking datasets [8].
Application in Real-World Discovery Campaigns
Virtual screening approaches have demonstrated substantial impact in prospective drug discovery campaigns across diverse therapeutic areas. In antiviral drug discovery, SBVS has been successfully employed to identify potential inhibitors against targets including SARS coronavirus protease, leading to the recognition of existing drugs like cinanserin that could be repurposed for antiviral treatment [1]. The integration of virtual screening with ultra-large compound libraries has proven particularly valuable, with recent campaigns screening billions of commercially available compounds through efficient computational workflows [4] [1].
The CACHE (Critical Assessment of Computational Hit-finding Experiments) competition provides objective assessment of virtual screening performance in real-world scenarios [4]. In Challenge #1 focused on finding ligands for the LRRK2-WDR domain, participating teams employed diverse strategies with most incorporating molecular docking alongside various filtering approaches [4]. The results demonstrated that successful virtual screening campaigns typically combine multiple approaches—integrating SBVS for binding mode prediction with LBVS for chemical similarity assessment and additional filters for drug-like properties and synthetic feasibility [4]. These real-world applications underscore the complementary value of both structure-based and ligand-based approaches in addressing the complex challenge of hit identification in drug discovery.
Essential Research Reagents and Computational Tools
Table 3: Key Resources for Virtual Screening Implementation
| Resource Category | Specific Tools/Solutions | Application Function |
|---|---|---|
| SBVS Software | AutoDock Vina, GOLD, Glide, DOCK | Molecular docking and pose prediction |
| LBVS Software | OpenBabel, RDKit, ChemAxon | Molecular descriptor calculation and similarity searching |
| Benchmarking Datasets | DUD-E, DEKOIS 2.0, MUV | Performance validation and method comparison |
| Compound Libraries | ZINC, Enamine REAL, PubChem | Sources of screening compounds |
| Protein Structure Resources | PDB, AlphaFold Protein Structure Database | Source of target structures for SBVS |
| Hybrid Methods | FIFI, PLEC, ENS-VS | Integrated LBVS+SBVS implementations |
| Machine Learning Libraries | scikit-learn, TensorFlow, PyTorch | Implementation of ML-based scoring classifiers |
SBVS and LBVS represent complementary paradigms in computer-aided drug design, each with distinct strengths, limitations, and application domains. SBVS offers the advantage of identifying novel chemotypes through direct modeling of target-ligand interactions but requires high-quality structural information and faces challenges in scoring accuracy [1] [5]. LBVS provides computational efficiency and independence from target structure but may be constrained by chemical bias toward known scaffolds [4] [5]. The integration of these approaches through hybrid methods has emerged as a powerful strategy that leverages their complementary strengths while mitigating individual limitations [6] [4] [5].
Future developments in virtual screening will likely be shaped by several converging trends. The rapid advancement of machine learning and artificial intelligence is transforming both SBVS and LBVS through improved scoring functions, molecular representations, and activity prediction models [4] [8]. The availability of ultra-large chemical libraries encompassing billions of synthesizable compounds necessitates continued optimization of screening efficiency and accuracy [4] [1]. Furthermore, the integration of experimental structural biology with computational predictions creates iterative cycles of model refinement and validation [1]. As these technologies mature, the distinction between SBVS and LBVS may increasingly blur in favor of holistic approaches that seamlessly integrate diverse data types to accelerate therapeutic discovery.
Structure-Based Virtual Screening (SBVS) has become a cornerstone technique in modern drug discovery, providing a computational pipeline to identify novel bioactive molecules by leveraging the three-dimensional (3D) structure of a biological target [10] [11]. This approach serves as a rational and cost-effective alternative or complement to experimental high-throughput screening (HTS), allowing researchers to prioritize the most promising compounds from libraries containing millions to billions of molecules before committing to costly laboratory tests [1]. The fundamental principle of SBVS is the prediction of how small molecule ligands interact with a specific binding site on a target protein, enabling the identification of hits with a high likelihood of biological activity [12].
The primary advantage of SBVS over its counterpart, Ligand-Based Virtual Screening (LBVS), is its ability to discover structurally novel compounds without reliance on known active molecules [8] [13]. While LBVS uses similarity to known actives to find new candidates, SBVS relies on the physical and chemical principles of molecular recognition, making it indispensable for targets with few known modulators or when scaffold hopping is desired [5]. The success of SBVS is evident from its contribution to several marketed drugs, including captopril, saquinavir, and dorzolamide, demonstrating its tangible impact on pharmaceutical development [11].
The Core SBVS Workflow: A Step-by-Step Guide
The typical SBVS workflow is a multi-stage process that transforms a target structure and a compound library into a shortlist of candidates for experimental testing. The general protocol involves careful preparation of both the receptor and the ligands, followed by docking and scoring, and culminates in post-processing to select the final hits [10].
Target Protein Preparation
The first critical step involves preparing the 3D structure of the target protein. The success of the entire SBVS campaign hinges on the quality and biological relevance of this structure [10].
- Source of Structure: The target structure is typically obtained from experimental methods like X-ray crystallography, NMR spectroscopy, or cryo-electron microscopy. When an experimental structure is unavailable, homology modeling can be used to predict the structure from its amino acid sequence [10] [11].
- Preparation Tasks:
- Adding Hydrogens and Assigning Protonation States: Determining the correct protonation states of amino acid residues at a given pH is crucial for accurate electrostatics. Tools like PROPKA and H++ are commonly used for this purpose [10].
- Treating Water Molecules: A decision must be made on which, if any, crystallographic water molecules to retain. These can be crucial for mediating ligand binding but can also lead to false positives if handled incorrectly. Methods like WaterMap and 3D-RISM help evaluate the thermodynamic stability of water molecules [10].
- Filling Missing Loops and Side Chains: Low-resolution structures may have missing segments that need to be modeled.
- Energy Minimization: The structure is gently minimized to relieve steric clashes introduced during the addition of hydrogen atoms [10].
Compound Library Preparation
The virtual chemical library, which can range from thousands to billions of compounds, must also be preprocessed to ensure chemical correctness and relevance [10] [12].
- Format Standardization: Converting 2D structural representations (e.g., SMILES strings) into 3D coordinate models.
- Tautomer and Stereoisomer Enumeration: Generating all possible tautomers and stereoisomers for each compound, as the correct form is unknown prior to docking.
- Protonation State Assignment: Similar to the protein, generating plausible protonation states for ligands at physiological pH.
- Conformer Generation: For flexible docking, multiple low-energy 3D conformations may be generated for each molecule to account for ligand flexibility. Tools like GINGER enable rapid GPU-accelerated conformer generation for ultra-large libraries [12].
Molecular Docking and Scoring
This is the computational heart of SBVS, where each prepared molecule is "docked" into the binding site of the prepared protein.
- Docking Algorithm: The docking program performs a conformational search, exploring possible orientations (poses) and conformations of the ligand within the binding site. The goal is to find the most favorable binding mode [10] [1].
- Scoring Function: Each generated pose is evaluated and ranked using a scoring function, which is a mathematical model that approximates the binding affinity. These functions can be physics-based, empirical, knowledge-based, or, increasingly, machine learning-based [11]. Despite their utility, the inaccurate prediction of true binding affinity remains a key challenge for classical scoring functions [1].
Post-Docking Analysis and Hit Selection
The top-ranking compounds from the docking simulation are not guaranteed hits and require careful post-processing.
- Pose Inspection: Researchers visually inspect the predicted binding modes of top-scoring compounds to check for sensible interactions, such as hydrogen bonds, hydrophobic contacts, and pi-stacking.
- Interaction Fingerprints: Tools like FIFI (Fragmented Interaction Fingerprint) and PLEC (Protein-Ligand Extended Connectivity) encode the pattern of interactions into a bit vector, which can be used with machine learning models to prioritize compounds with interaction patterns similar to known actives [6].
- ADMET Filtering: Compounds are filtered based on predicted Absorption, Distribution, Metabolism, Excretion, and Toxicity properties to increase the likelihood of drug-like candidates.
- Consensus Scoring: Using multiple scoring functions or methods to rank compounds can reduce false positives and improve hit rates. Compounds that rank highly across different methods are considered more reliable [11].
The following diagram illustrates the logical flow and decision points within this core SBVS workflow.
Advanced SBVS Protocols and Machine Learning Enhancements
To address the limitations of standard docking and scoring, several advanced protocols have been developed, with machine learning (ML) playing an increasingly transformative role.
Accounting for Flexibility: Ensemble and 4D Docking
A major limitation of classical docking is treating the protein as a rigid body. In reality, proteins are dynamic, and their binding sites can adopt multiple conformations [5].
- Ensemble Docking: This involves docking compound libraries against an ensemble of multiple protein structures, which can be derived from different experimental crystal structures, NMR models, or molecular dynamics (MD) simulation snapshots. This approach accounts for protein flexibility and increases the chance of finding compounds that bind to different conformational states [10] [12].
- Induced Fit Docking: More computationally intensive than ensemble docking, these protocols allow for both ligand and protein side-chain (and sometimes backbone) flexibility during the docking simulation.
Machine Learning-Augmented Scoring and Workflows
Traditional scoring functions are often a bottleneck in SBVS. ML-based approaches are now being used to overcome this challenge [4] [8].
- Target-Specific ML Scoring: Methods like ENS-VS use ensemble learning models (e.g., combining Support Vector Machines, Decision Trees, and Fisher linear discriminant) trained on target-specific active and decoy compounds. These models use a combination of protein-ligand interaction energy terms and ligand structure vectors as descriptors, significantly improving enrichment over classical scoring functions [8].
- Interaction Fingerprints with ML: Fingerprints like FIFI and PLEC encode the specific interaction patterns between a ligand and its target. These fingerprints can be used as features to train ML classifiers that distinguish active from inactive compounds, combining the strengths of structure-based and ligand-based approaches [6].
- Deep Learning for Binding Affinity Prediction: Advanced deep learning architectures, particularly graph neural networks that model the protein-ligand complex as a graph of atoms, are being developed to predict binding affinity with higher accuracy than classical scoring functions [4] [13].
The diagram below maps the evolution of these advanced SBVS methodologies, from foundational concepts to AI-integrated techniques.
Performance Comparison: SBVS and Its Hybrid Variants
The performance of virtual screening methods is typically measured by metrics such as the Enrichment Factor (EF), which indicates how much better a method is at identifying true active compounds compared to random selection, and the Area Under the ROC Curve (AUC), which measures the overall ability to distinguish actives from inactives [8].
The following table summarizes quantitative performance data from retrospective studies, comparing classical SBVS with advanced and hybrid methods.
Table 1: Performance Comparison of Virtual Screening Methods on Benchmark Datasets
| Method Category | Specific Method / Protocol | Performance Metric | Result (Mean) | Benchmark Dataset |
|---|---|---|---|---|
| Classical SBVS | Autodock Vina (Standard Docking) | Enrichment Factor at 1% (EF1%) | Baseline (e.g., 8.80) | DUD-E [8] |
| Advanced ML-SBVS | ENS-VS (Ensemble Learning) | EF1% | 52.77 | DUD-E [8] |
| ENS-VS (Ensemble Learning) | AUC | 0.982 | DUD-E [8] | |
| Hybrid VS | FIFI (IFP with ML) | Prediction Accuracy | Consistently higher than other IFPs | Six Diverse Targets [6] |
| Sequential LB→SB | LBVS followed by SBVS | Hit Rate | Competitive, widely used standard [5] | Various Case Studies [5] |
The data demonstrates that machine learning-augmented methods like ENS-VS can achieve a dramatic improvement in early enrichment (EF1%) compared to classical docking with Vina, making them far more efficient at identifying the most promising candidates from a large library [8]. Furthermore, hybrid interaction fingerprints like FIFI show stable and high prediction accuracy across diverse targets, validating the strategy of merging ligand and structure-based information [6].
The Scientist's Toolkit: Essential Reagents and Software for SBVS
A successful SBVS campaign relies on a suite of specialized computational tools and databases. The following table details key resources and their functions in the workflow.
Table 2: Essential Research Reagent Solutions for SBVS
| Tool / Resource Name | Type | Primary Function in SBVS | Key Features / Notes |
|---|---|---|---|
| Protein Data Bank (PDB) | Database | Repository for experimental 3D structures of proteins and nucleic acids. | The primary source for target protein structures [11]. |
| DUD-E / DEKOIS 2.0 | Database | Benchmarking sets containing known active compounds and property-matched decoys. | Used for developing and validating new SBVS methods [8]. |
| AutoDock Vina, GOLD, Glide | Software | Molecular docking programs for pose prediction and scoring. | Vina is widely used for its speed and accuracy; Glide and GOLD offer advanced scoring [8] [1] [11]. |
| ICM-Pro | Software | Commercial software suite for molecular modeling, docking, and VS. | Used in professional VS services for docking and pharmacophore modeling [12]. |
| PROPKA, H++ | Software | Tools for predicting pKa values and protonation states of protein residues. | Critical for accurate protein preparation and electrostatic calculations [10]. |
| PLEC, FIFI | Descriptor | Interaction Fingerprints that encode protein-ligand interaction patterns. | Used for post-docking analysis and training ML models for hybrid VS [6]. |
| GINGER | Software | GPU-based tool for high-quality, rapid conformer generation. | Enables processing of ultra-large compound libraries (e.g., 10M compounds/day) [12]. |
| ZINC, Enamine REAL | Database | Public and commercial databases of purchasable and virtual compounds for screening. | Enamine REAL contains billions of make-on-demand compounds for ultra-large VS [12] [4]. |
The SBVS workflow, centered on leveraging target 3D structure for molecular docking, is a powerful and evolving pillar of computer-aided drug design. While the core steps of protein and ligand preparation, docking, and post-processing remain fundamental, the field is being rapidly advanced by protocols that account for system flexibility and, most notably, by the integration of machine learning. The quantitative data shows that these advanced methods, particularly those using ensemble learning and hybrid fingerprints, offer significant performance gains over classical docking. As computational power increases and AI models become more sophisticated, SBVS is poised to become even more accurate and integral to the drug discovery process, enabling the efficient exploration of vast chemical spaces to identify novel therapeutics for untreated diseases.
Ligand-Based Virtual Screening (LBVS) is a foundational computational technique in modern drug discovery, employed to efficiently identify novel bioactive compounds from extensive chemical libraries. This approach is predicated on the chemical similarity principle, which posits that structurally similar molecules are likely to exhibit similar biological activities [14] [15]. LBVS is particularly invaluable in scenarios where the three-dimensional structure of the target protein is unavailable, as it relies exclusively on the structural and physicochemical information of known active ligands [16] [17]. The core objective of a typical LBVS workflow is to enrich a subset of a virtual compound library with molecules that share key characteristics with a set of known actives, thereby increasing the probability of identifying new hit compounds while conserving the resources required for synthesis and biological testing [18] [17].
The versatility of LBVS allows it to be used as a rapid pre-screening filter for ultra-large libraries containing billions of compounds before applying more computationally intensive structure-based methods, or as a standalone approach for lead identification and optimization [16] [18]. Advances in computational power and algorithm design have significantly enhanced the performance and adoption of LBVS, making it a cost-effective and fast alternative to high-throughput screening for discovering new drugs [19].
Core Components of the LBVS Workflow
A robust LBVS workflow integrates several key components, each critical for ensuring the successful identification of novel active compounds.
Query and Ligand Preparation
The initial and a crucial step in LBVS involves the careful selection and preparation of known active compounds, which serve as the query templates for the screening process. The quality and representativeness of these query ligands directly influence the success of the entire campaign [17]. This stage involves:
- Data Collection: Active ligands and their experimental bioactivity data (e.g., Ki, IC50) are retrieved from public databases such as ChEMBL, PubChem, or BindingDB [14] [17].
- Ligand Standardization: Molecular structures must be standardized to ensure consistency. This includes tautomer canonicalization, charge neutralization, and salt removal using tools like MolVS or commercial software [16] [17].
- Conformational Sampling: For 3D LBVS methods, generating a representative set of low-energy conformers for each query ligand is essential. Algorithms such as RDKit's ETKDGv3 are widely used for this purpose, as they efficiently explore the conformational space [16] [17]. The failure to include the bioactive conformation can severely limit the success of subsequent screening steps [17].
Library Preparation
The virtual screening library, which could be an in-house collection or a public database like ZINC, must undergo a similar preparation process [17]. This involves standardizing structures, generating relevant tautomers and protonation states at physiological pH, and, for 3D methods, generating multiple conformers to ensure the bioactive pose is represented [16] [17]. Proper library preparation ensures that the screened molecules are chemically reasonable and that the calculated similarities are meaningful.
Molecular Descriptors and Similarity Searching
The heart of LBVS lies in quantifying the similarity between query and database molecules using molecular descriptors. These can be broadly categorized into 2D and 3D methods.
- 2D Fingerprints: These encode the molecular structure as a bit string based on the presence or absence of specific substructures or topological patterns. Common examples include Morgan fingerprints (also known as ECFP/FCFP), RDKit topological fingerprints, and MACCS keys [16] [14]. Similarity is typically calculated using the Tanimoto coefficient, with values closer to 1.0 indicating higher similarity [14] [15].
- 3D Methods: These approaches compare molecules based on their three-dimensional shape and pharmacophoric features.
- Shape-Based Screening: This method maximizes the overlap of molecular volumes between a query and a database compound. Tools like ROCS are industry standards for this approach [16] [19].
- Pharmacophore-Based Screening: This technique identifies compounds that share a common set of critical functional features (e.g., hydrogen bond donors/acceptors, hydrophobic regions) in a specific spatial arrangement [15] [20].
Table 1: Key Molecular Descriptors and Similarity Metrics in LBVS
| Descriptor Type | Examples | Similarity Metrics | Key Applications |
|---|---|---|---|
| 2D Fingerprints | Morgan (ECFP4), RDKit, MACCS keys | Tanimoto, Tversky, Dice | Rapid screening of large libraries, scaffold hopping [16] [14] |
| 3D Shape | ROCS, VSFlow's shape mode | TanimotoCombo, ShapeTanimoto | Identifying isofunctional molecules with different scaffolds [16] [15] |
| 3D Pharmacophore | Phase, Ligand-Based Pharmacophores | Fit score, RMSD | Filtering for essential interaction features [21] [20] |
Post-Screening Analysis and Hit Selection
The final stage involves analyzing and prioritizing the top-ranking compounds from the similarity search. This is not merely about selecting the highest similarity scores. Researchers must employ chemical diversity analysis to select a set of hits representing distinct scaffolds, thereby reducing redundancy and mitigating the risk of attrition in later stages [17]. Furthermore, manual inspection is critical to verify that key pharmacophoric features are conserved and that the proposed hits are synthetically accessible and possess drug-like properties, often evaluated using rules like Lipinski's Rule of Five or more advanced Multi-Parameter Optimization (MPO) tools [18] [17].
Experimental Protocols and Validation
Validating the performance of an LBVS workflow is essential to establish its reliability and predictive power before prospective application.
Benchmarking Datasets and Protocols
A standard validation protocol involves using benchmark datasets where active compounds and confirmed inactives (decoys) are known. The Directory of Useful Decoys (DUD) is a widely used dataset for this purpose, containing 40 protein targets with active ligands and property-matched decoys [19] [15]. The typical protocol is as follows:
- Define a Query Set: One or more known active compounds are selected from the benchmark dataset to serve as queries.
- Screen the Benchmark Library: The LBVS method is used to rank all molecules (actives and decoys) in the dataset based on their similarity to the query.
- Evaluate Performance: The ranking is analyzed to determine how effectively the method prioritizes known active compounds over decoys.
Key Performance Metrics
The performance of LBVS methods is quantitatively assessed using several standard metrics:
- Area Under the ROC Curve (AUC): Measures the overall ability of the method to distinguish actives from inactives. A perfect classifier has an AUC of 1.0, while random selection yields 0.5 [19] [15].
- Enrichment Factor (EF): Quantifies the concentration of active compounds found within a specific top percentage of the ranked list compared to a random selection. For example, EF1% measures the enrichment in the top 1% of the list [22] [19].
- Hit Rate (HR): The percentage of active compounds recovered within a given top percentage of the ranked list [19].
Table 2: Performance Comparison of Representative LBVS Methods on Benchmark Datasets
| Method / Tool | Descriptor Type | Key Feature | Reported Performance |
|---|---|---|---|
| VSFlow [16] | 2D Fing., Substructure, 3D Shape | Open-source, command-line tool | High speed; enables quick visualization of results. |
| MOST [14] | 2D Fingerprints (Morgan) | Uses explicit bioactivity of the most-similar ligand | Avg. Accuracy: 0.95 (pKi ≥5, cross-validation) |
| HWZ Score [19] | 3D Shape | Novel scoring function for shape overlap | Avg. AUC: 0.84; Avg. HR (top 1%): 46.3% (DUD) |
| CSNAP3D [15] | Hybrid 3D (Shape + Pharmacophore) | Chemical similarity network analysis | High true positive rate (up to 95%) for target prediction |
| ROCS [15] | 3D Shape & Pharmacophore | Industry-standard shape-based screening | ComboScore AUC: 0.59 (Scaffold Hopping benchmark) |
LBVS in the Broader VS Context: Hybrid Approaches
While powerful, LBVS has limitations, including a potential bias towards the chemical space of the query ligands, which can restrict the identification of structurally novel scaffolds (the "dark side" of VS) [17]. To mitigate this and leverage the strengths of different methodologies, hybrid approaches that combine LBVS with Structure-Based Virtual Screening (SBVS) like molecular docking are increasingly adopted [21] [18].
These hybrid strategies can be implemented in several ways:
- Sequential Workflow: A rapid LBVS method (e.g., 2D similarity) is first used to filter a multi-billion compound library down to a manageable size (e.g., millions). This enriched subset is then subjected to more computationally expensive SBVS methods like docking for further refinement [21] [18]. This approach optimizes the trade-off between computational cost and model complexity.
- Parallel Workflow: LBVS and SBVS are run independently on the same library. The final hit list is compiled by either taking the union of top-ranked compounds from both methods or by creating a consensus ranking that integrates scores from both approaches [21] [18]. Evidence suggests that a hybrid model averaging predictions from both LB and SB methods can perform better than either method alone, as errors from one approach can be canceled out by the other [18].
The following diagram illustrates how these methods can be integrated into a single, powerful drug discovery pipeline.
Diagram 1: Integration of LBVS and SBVS in a virtual screening workflow.
Successful implementation of an LBVS workflow relies on a suite of software tools and data resources.
Table 3: Essential Resources for the LBVS Workflow
| Resource Category | Name | Description | Access |
|---|---|---|---|
| Cheminformatics Toolkit | RDKit | Open-source toolkit for cheminformatics; core engine for many custom LBVS tools (e.g., VSFlow) and fingerprint generation [16] [14]. | Open-Source |
| 3D Shape Screening | ROCS | Industry-standard software for rapid 3D shape similarity screening and pharmacophore comparison [19] [15]. | Commercial |
| Bioactivity Databases | ChEMBL | Manually curated database of bioactive, drug-like molecules with binding, functional and ADMET data [14] [17]. | Public |
| Compound Libraries | ZINC | Freely available database of commercially available compounds for virtual screening, containing over 230 million molecules [16] [17]. | Public |
| Workflow & GUI Tools | VSFlow | Open-source command-line tool that integrates substructure, fingerprint, and shape-based screening in one package [16]. | Open-Source |
Ligand-Based Virtual Screening remains a powerful, efficient, and indispensable method in the drug discovery arsenal. Its core strength lies in leveraging the principle of chemical similarity to rapidly identify potential hit compounds from vast chemical spaces, especially when structural data for the target is lacking. As demonstrated by tools like VSFlow and methodologies like the HWZ score and MOST, continued development in similarity algorithms and scoring functions is yielding consistently high performance in benchmark studies, with some achieving average AUC values over 0.8 and hit rates above 45% in the top 1% of ranked lists [14] [19].
However, the full potential of LBVS is often realized when it is used not in isolation, but as part of a strategically integrated workflow that includes structure-based methods. The emerging paradigm of hybrid LB/SB screening, whether sequential or parallel, offers a more robust framework by combining the pattern recognition strength of LBVS with the atomic-level insights of SBVS. This synergistic approach helps overcome the individual limitations of each method, reduces false positives, and increases confidence in the final selection of hits for experimental validation, ultimately accelerating the journey toward discovering novel therapeutic agents [21] [18].
Key Advantages and Inherent Limitations of Each Method
Virtual screening (VS) is a cornerstone of modern computational drug discovery, providing a powerful and cost-effective strategy for identifying bioactive molecules from vast chemical libraries. The two primary computational strategies are structure-based virtual screening (SBVS), which relies on the three-dimensional structure of a target protein, and ligand-based virtual screening (LBVS), which leverages the known properties of active ligands [4] [1]. In the contemporary research landscape, the choice between these methods—or their intelligent integration—is critical for the success of hit-finding campaigns. This guide provides an objective comparison of SBVS and LBVS, detailing their respective advantages, limitations, and performance data to inform their application and validation within drug discovery pipelines.
Core Principles and Methodologies
Structure-Based Virtual Screening (SBVS)
SBVS requires a known or modeled three-dimensional structure of the target protein, typically derived from X-ray crystallography, cryo-electron microscopy (cryo-EM), or computational prediction tools like AlphaFold [18] [1]. The core of SBVS is molecular docking, a computational process that predicts how a small molecule (ligand) binds to a protein's binding site. The workflow generally involves several key steps [23] [1]:
- Target Preparation: The protein structure is processed by removing water molecules, adding hydrogen atoms, and optimizing side-chain conformations.
- Ligand Preparation: Small molecules from a chemical library are converted into a format suitable for docking, often generating multiple 3D conformations for each.
- Docking and Scoring: Algorithms sample possible binding poses for each ligand in the binding site and rank them using a scoring function. This function estimates the binding affinity based on complementary factors like shape, electrostatics, and hydrogen bonding [22].
Ligand-Based Virtual Screening (LBVS)
LBVS is employed when a high-quality protein structure is unavailable, but data on known active compounds exists. It operates on the "similarity-property principle," which states that structurally similar molecules are likely to have similar biological activities [4] [18]. Key LBVS methodologies include:
- Pharmacophore Modeling: This approach identifies and maps the essential 3D features responsible for a ligand's biological activity (e.g., hydrogen bond donors/acceptors, hydrophobic regions). New compounds are screened for their ability to match this spatial arrangement [18].
- Quantitative Structure-Activity Relationship (QSAR): These models use statistical learning to correlate quantitative molecular descriptors of a set of ligands with their biological activity, enabling the prediction of activity for new compounds [4].
- Molecular Similarity Searching: This method uses molecular fingerprints or other descriptors to computationally screen large libraries for compounds that are structurally similar to known actives [18].
Table 1: Overview of Fundamental Methodologies
| Method | Core Requirement | Key Techniques | Underlying Principle |
|---|---|---|---|
| Structure-Based (SBVS) | 3D Protein Structure | Molecular Docking, Scoring Functions | Physical simulation of molecular recognition and binding complementarity. |
| Ligand-Based (LBVS) | Known Active Ligands | Pharmacophore Modeling, QSAR, Similarity Search | Similarity-Property Principle: structurally similar molecules have similar biological activity. |
Direct Comparative Analysis: Advantages and Limitations
SBVS and LBVS offer distinct strengths and face different challenges. A head-to-head comparison reveals their complementary nature.
Key Advantages
Table 2: Key Advantages of SBVS and LBVS
| Aspect | Structure-Based (SBVS) | Ligand-Based (LBVS) |
|---|---|---|
| Scaffold Discovery | High potential for identifying novel and diverse chemotypes that are structurally distinct from known ligands [24]. | Limited by known ligand templates, leading to a tendency to find analogs and similar scaffolds [4]. |
| Mechanistic Insight | Provides atomic-level interaction details (e.g., hydrogen bonds, hydrophobic contacts), offering a hypothesis for the binding mode [18] [1]. | Provides little to no direct information on the binding mode or protein-ligand interactions [4]. |
| Requirement Flexibility | Dependent on a high-quality protein structure, which can be a limitation for some targets. | Can be applied when no protein structure is available, using only ligand information [4] [18]. |
| Computational Efficiency | Computationally intensive, especially for flexible docking and large libraries. | Generally faster and less costly, enabling rapid screening of ultra-large libraries [4] [18]. |
Inherent Limitations and Challenges
Table 3: Inherent Limitations of SBVS and LBVS
| Challenge | Structure-Based (SBVS) | Ligand-Based (LBVS) |
|---|---|---|
| Scoring Accuracy | Scoring functions are a major limitation, often struggling to predict true binding affinity accurately, leading to high false positive rates [22] [1]. | Accuracy depends heavily on the quality and diversity of the known active ligand set used to build the model [4]. |
| Protein Flexibility | Treating the protein as rigid can neglect conformational changes upon binding, though ensemble docking and flexible side-chain methods are emerging solutions [23] [22]. | Not applicable, as the method does not use protein structure. |
| Structural Dependency | Performance is highly sensitive to the quality and resolution of the input protein structure. AlphaFold models may require refinement for reliable docking [18]. | Not applicable. |
| Chemical Novelty | Not applicable. | Strong bias towards known chemical series, potentially missing novel scaffolds that do not match the 2D or 3D similarity queries [4]. |
Experimental Performance and Benchmarking Data
Quantitative benchmarks are essential for validating the performance of virtual screening methods. The following data, drawn from recent studies, highlights the performance of various SBVS tools and the significant impact of machine learning (ML) enhancements.
Table 4: Virtual Screening Performance on Benchmark Datasets
| Study & Method | Target / Dataset | Key Performance Metric | Reported Result |
|---|---|---|---|
| SBVS Benchmarking [23] | PfDHFR (Malaria enzyme) | Enrichment Factor at 1% (EF1%) | PLANTS + CNN-Score: EF1% = 28FRED + CNN-Score: EF1% = 31 |
| RosettaVS [22] | CASF-2016 (285 complexes) | Enrichment Factor at 1% (EF1%) | RosettaGenFF-VS: EF1% = 16.72 |
| HelixVS [25] | DUD-E (102 targets) | Enrichment Factor at 1% (EF1%) | HelixVS: EF1% = 26.968AutoDock Vina: EF1% = 10.022 |
| Ultra-Large Library Screen [24] | CB2 Receptor (GPCR) | Experimental Hit Rate | 55% (6 out of 11 synthesized compounds were active) |
Detailed Experimental Protocol: SBVS Benchmarking
To illustrate a standard validation protocol, the following workflow is adapted from a benchmarking study on the malaria target Plasmodium falciparum Dihydrofolate Reductase (PfDHFR) [23]:
- Protein Structure Preparation: Crystal structures for wild-type (PDB ID: 6A2M) and quadruple-mutant (PDB ID: 6KP2) PfDHFR were obtained from the Protein Data Bank. Structures were prepared using OpenEye's "Make Receptor" by removing water molecules and ions, adding hydrogens, and optimizing hydrogen bonding networks.
- Benchmark Set Curation: The DEKOIS 2.0 protocol was used to create a benchmark set containing 40 known bioactive molecules and 1,200 structurally similar but presumed inactive decoy molecules for each PfDHFR variant (a 1:30 active-to-decoy ratio).
- Docking Experiments: Three docking programs—AutoDock Vina, PLANTS, and FRED—were used to screen the benchmark sets. Grid boxes were defined to encompass the binding site of each variant.
- Machine Learning Re-scoring: The top poses generated by each docking tool were re-scored by two pretrained ML scoring functions: CNN-Score and RF-Score-VS v2.
- Performance Evaluation: Screening performance was quantified using:
- Enrichment Factor (EF1%): Measures the concentration of active compounds in the top 1% of the ranked list.
- pROC-AUC: The area under the semi-log ROC curve, assessing the overall ability to distinguish actives from decoys.
- pROC-Chemotype Plots: Analyzes the chemical diversity of the enriched actives.
This study concluded that re-scoring docking outcomes with ML-based functions, particularly CNN-Score, consistently enhanced performance and enriched diverse, high-affinity binders for both wild-type and drug-resistant PfDHFR variants [23].
Integrated Workflows and Visualization
Given their complementary strengths, the most effective strategies often combine LBVS and SBVS. Integrated workflows can be sequential, parallel, or hybrid [4] [18].
Virtual Screening Strategy Selection
Hybrid Screening Strategies
The Scientist's Toolkit: Key Research Reagents and Solutions
Table 5: Essential Software and Resources for Virtual Screening
| Category | Tool / Resource | Primary Function | Key Application |
|---|---|---|---|
| SBVS Software | AutoDock Vina [23] [22] | Molecular docking with a fast scoring function. | Widely used open-source tool for standard docking tasks. |
| RosettaVS [22] | Physics-based docking with receptor flexibility. | High-precision docking and screening of challenging targets. | |
| FRED, PLANTS [23] | Rigid-body and flexible-ligand docking algorithms. | Benchmarking and structure-based screening campaigns. | |
| LBVS Software | ROCS, eSim [18] | 3D shape- and electrostatic-based similarity searching. | Rapid ligand-based screening and scaffold hopping. |
| QuanSA [18] | 3D-QSAR model building and affinity prediction. | Quantitative affinity prediction from ligand structures. | |
| ML & AI Platforms | HelixVS [25] | Multi-stage VS integrating docking and deep learning scoring. | High-throughput, high-accuracy screening with improved enrichment. |
| CNN-Score, RF-Score [23] | Re-scoring docking poses with machine learning models. | Improving ranking and active enrichment after initial docking. | |
| Chemical Libraries | Enamine REAL, ZINC [24] | Ultra-large libraries of commercially available compounds. | Providing synthetically accessible chemical space for screening. |
| Benchmarking Sets | DEKOIS 2.0, DUD-E [23] [25] | Curated datasets with known actives and decoys. | Objective performance evaluation and validation of VS methods. |
Virtual screening (VS) is a cornerstone of modern computational drug discovery, employed to efficiently identify promising hit compounds from vast chemical libraries. The two primary computational strategies are ligand-based virtual screening (LBVS) and structure-based virtual screening (SBVS). The choice between these methods is not a matter of superiority but is fundamentally dictated by the nature and quantity of available data for the biological target of interest. LBVS relies on the knowledge of known active ligands to find similar compounds, whereas SBVS requires the three-dimensional structure of the target protein to computationally dock and score small molecules [26]. With the advent of machine learning (ML) and artificial intelligence (AI), the capabilities of both approaches have been significantly augmented, leading to the development of sophisticated hybrid strategies [4] [22]. This guide provides an objective, data-driven framework to help researchers select the optimal virtual screening path, validated by performance data from benchmark studies and real-world applications.
Core Methodologies and Their Applications
Ligand-Based Virtual Screening (LBVS)
LBVS methods are used when the structure of the target protein is unknown or uncertain, but information about molecules that bind to it is available.
- Principle: These methods operate on the "similarity-property principle," which states that structurally similar molecules are likely to have similar biological activities [4].
- Key Techniques:
- 2D Similarity Search: This is one of the simplest and most widely used LBVS tools. It encodes molecules into fingerprints (bit strings representing molecular features) and uses metrics like the Tanimoto coefficient to rank compounds in a database by their similarity to known active ligands [26] [27].
- Pharmacophore Modeling: A pharmacophore represents the essential molecular features (e.g., hydrogen bond donors/acceptors, hydrophobic regions) responsible for a ligand's biological activity. Pharmacophore models can be derived from a set of active ligands and used as a 3D query to screen compound libraries [27].
- Quantitative Structure-Activity Relationship (QSAR): This machine learning approach builds a statistical model that correlates numerical descriptors of a set of molecules with their measured biological activity. The model can then predict the activity of new, untested compounds [4] [27].
Structure-Based Virtual Screening (SBVS)
SBVS comes into play when a reliable 3D structure of the target protein (e.g., from X-ray crystallography, NMR, or high-quality models like AlphaFold2) is available [4] [28].
- Principle: SBVS, primarily molecular docking, computationally simulates how a small molecule (ligand) binds to the target's binding site. It aims to predict the optimal binding pose and estimate the binding affinity using a scoring function [28] [26].
- Key Considerations:
- Target Flexibility: Proteins are dynamic. Accounting for side-chain or even backbone flexibility through methods like ensemble docking can improve screening accuracy [28].
- Scoring Functions: These are mathematical functions used to rank docked compounds. They can be physics-based, empirical, or knowledge-based. Recent advances include machine learning-based scoring functions (ML SFs), which have shown superior performance in distinguishing active from inactive compounds [23] [22].
Decision Framework: Choosing Your Path
The following diagram illustrates the decision-making process for selecting a virtual screening strategy, integrating both classical and ML-augmented approaches.
Performance Benchmarking: Quantitative Comparisons
The effectiveness of virtual screening strategies is quantitatively measured using benchmark datasets like DEKOIS and DUD, which contain known active compounds and inactive "decoys" [23]. Key metrics include Enrichment Factor (EF), which measures the concentration of active compounds at the top of a ranked list, and Area Under the Curve (AUC).
Benchmarking of Docking and ML Re-scoring
The table below summarizes data from a benchmarking study on Plasmodium falciparum Dihydrofolate Reductase (PfDHFR), comparing three docking tools and their performance when enhanced with ML re-scoring [23].
Table 1: Performance of Docking and ML Re-scoring for Wild-Type (WT) and Quadruple-Mutant (Q) PfDHFR
| Target Variant | Docking Tool | ML Re-scoring Function | Performance (EF1%) | Key Finding |
|---|---|---|---|---|
| Wild-Type (WT) | AutoDock Vina | None (Standard Scoring) | Worse-than-random | Standard scoring performed poorly. |
| Wild-Type (WT) | AutoDock Vina | RF-Score-VS v2 / CNN-Score | Better-than-random | ML re-scoring significantly improved performance from worse-than-random to better-than-random. |
| Wild-Type (WT) | PLANTS | CNN-Score | 28 | This combination yielded the best enrichment for the WT variant. |
| Quadruple-Mutant (Q) | FRED | CNN-Score | 31 | This combination yielded the best enrichment for the resistant Q variant. |
Abbreviation: EF1%: Enrichment Factor at the top 1% of the screened library.
Conclusion: The study demonstrates that re-scoring docking outputs with ML-based functions like CNN-Score consistently augments SBVS performance and is crucial for identifying diverse, high-affinity binders, especially against resistant mutant variants [23].
Comparison of State-of-the-Art SBVS Tools
The following table compares the performance of various SBVS tools on standard benchmarks, highlighting the impact of advanced force fields and flexibility.
Table 2: Performance Comparison of Advanced SBVS Methods on Public Benchmarks
| Method / Platform | Key Feature | Reported Performance | Reference / Benchmark |
|---|---|---|---|
| RosettaVS (RosettaGenFF-VS) | Physics-based force field with receptor flexibility (side-chains, partial backbone). | EF1% = 16.72; Superior docking & screening power. | CASF-2016 Benchmark [22] |
| CNN-Score | Deep learning-based scoring function. | Hit rate ~3x higher than Vina at top 1%. | Independent Validation [23] |
| RF-Score-VS | Random forest-based scoring function for virtual screening. | Hit rate >3x higher than DOCK3.7 at top 1%. | Independent Validation [23] |
| AutoDock Vina | Widely used, traditional docking program. | Baseline performance (lower than ML-augmented methods). | Multiple Benchmarks [23] [22] |
Experimental Protocols for Key Methodologies
Protocol for a Typical SBVS Workflow with ML Re-scoring
This protocol is adapted from benchmarking studies and the development of the OpenVS platform [23] [22].
Target Preparation:
- Obtain the 3D structure of the target protein (PDB ID: e.g., 6A2M for WT PfDHFR).
- Using a tool like OpenEye's "Make Receptor," remove water molecules, unnecessary ions, and redundant chains.
- Add and optimize hydrogen atoms. Define the binding site coordinates for docking.
Compound Library Preparation:
- Select a database (e.g., ZINC, Enamine REAL). For benchmarking, use a dedicated set like DEKOIS 2.0, which contains active compounds and matched decoys.
- Prepare ligands: generate multiple low-energy 3D conformations for each compound using a tool like OMEGA.
- Convert ligand files into the required format for docking (e.g., PDBQT, mol2).
Molecular Docking:
- Perform docking with a selected tool (e.g., AutoDock Vina, PLANTS, FRED) into the prepared binding site.
- Critical Step: Ensure consistent and appropriate grid box dimensions to encompass the entire binding site.
Machine Learning Re-scoring:
- Extract the top poses (e.g., top 1-10) generated by the docking program for each compound.
- Submit these poses to a pre-trained ML scoring function such as CNN-Score or RF-Score-VS v2.
- Re-rank the entire library of compounds based on the new scores provided by the ML model.
Hit Identification and Validation:
- Select the top-ranked compounds (e.g., top 100-500) from the ML-re-scored list for experimental testing (e.g., biochemical assays, SPR).
Protocol for a Hybrid LBVS/SBVS Screening Strategy
This sequential protocol, informed by successful campaigns in competitions like CACHE, uses LBVS to filter an ultra-large library before more costly SBVS [4].
Ligand-Based Filtering:
- If known active ligands are available, use a fast 2D similarity search (e.g., Tanimoto similarity with a high threshold) or a pharmacophore model to screen a multi-billion compound library.
- Goal: Rapidly reduce the library size from billions to a few hundred thousand diverse compounds that are likely active.
Structure-Based Docking:
- Take the filtered compound set from Step 1 and subject it to molecular docking against the target structure.
- This step adds a structure-based constraint, prioritizing compounds that not only look like actives but also fit well into the binding pocket.
Post-Processing and Analysis:
- Apply additional filters (e.g., drug-likeness, synthetic accessibility).
- Visually inspect the top-ranked docking poses to check for sensible binding interactions.
- Select a final, manageable number of compounds for experimental validation.
Essential Research Reagent Solutions
The table below lists key computational tools and databases that form the essential "reagent kit" for conducting virtual screening.
Table 3: Key Virtual Screening Tools and Databases
| Category | Name | Function / Description |
|---|---|---|
| Public Compound Databases | ZINC | A free database of commercially available compounds for virtual screening. |
| ChEMBL | A manually curated database of bioactive molecules with drug-like properties. | |
| PubChem | A public database with information on biological activities of small molecules. | |
| SBVS Software | AutoDock Vina | A widely used, open-source molecular docking program. |
| RosettaVS | An open-source SBVS method with receptor flexibility and advanced scoring. | |
| Schrödinger Glide | A high-performance docking software suite (commercial). | |
| LBVS & ML Tools | RDKit | An open-source toolkit for cheminformatics and machine learning. |
| CNN-Score / RF-Score-VS | Pre-trained ML scoring functions for re-scoring docking poses. | |
| Benchmarking Sets | DEKOIS | Provides benchmark sets with actives and decoys to evaluate VS methods. |
| DUD (Directory of Useful Decoys) | A classic benchmark set for virtual screening evaluation. |
The decision framework presented here underscores that the choice between LBVS and SBVS is direct and data-driven. SBVS dominates when a reliable protein structure is available, especially with the integration of ML re-scoring and considerations for target flexibility. LBVS is the go-to method in the absence of structural information, provided a set of known active ligands exists. The most powerful strategies, as validated by benchmark studies and real-world applications, combine both approaches in a sequential or parallel manner to leverage their synergistic effects and mitigate their individual limitations [4] [23].
The future of virtual screening is inextricably linked to AI and machine learning. We are witnessing a trend away from traditional, rigid scoring frameworks toward physical-informed, interaction-based models that promise greater generalizability and interpretability [4]. The successful application of open-source, AI-accelerated platforms like OpenVS to screen billion-member libraries in a matter of days signals a new era of efficiency and scale in drug discovery [22]. As these technologies mature, the decision framework will evolve, but the foundational principle will remain: the optimal virtual screening strategy is dictated by a clear-eyed assessment of the available data.
From Theory to Practice: Implementing SBVS and LBVS in Drug Discovery Campaigns
Structure-based virtual screening (SBVS) is a powerful computational approach in modern drug discovery, enabling the rapid identification of hit compounds by leveraging the three-dimensional structure of a biological target. By systematically evaluating large chemical libraries, SBVS predicts how strongly small molecules bind to a target, prioritizing those with the highest potential for further development. This guide details the essential steps of the SBVS workflow—target preparation, library design, and docking protocols—and provides a objective performance comparison with ligand-based virtual screening (LBVS) approaches, supported by experimental data from recent studies.
Target Protein Selection and Preparation
The foundation of a successful SBVS campaign is a high-quality, well-prepared protein structure.
Target Selection and Assessment
The process begins with selecting a suitable protein target, typically one with a known or homology-modeled 3D structure whose modulation is expected to produce a therapeutic effect. The reliability of the entire screening process depends heavily on the quality and resolution of this structure.
- Source and Validation: Obtain the target structure from the Protein Data Bank (PDB) or through comparative homology modeling if an experimental structure is unavailable. The structure should be validated, paying close attention to the resolution (for crystal structures) and the completeness of key regions, especially the binding site.
- Binding Site Identification: Define the binding site coordinates. This can be done by locating the co-crystallized ligand, referencing known mutagenesis data, or using computational tools to predict cryptic or allosteric pockets.
Pre-processing Steps
Before docking, the protein structure must be processed to correct for inconsistencies and optimize its physicochemical state.
- Structure Cleaning: Remove extraneous components like water molecules, ions, and non-relevant co-crystallized ligands. However, structurally important water molecules that mediate protein-ligand interactions should be retained.
- Hydrogen Addition and Protonation States: Add hydrogen atoms and assign correct protonation states to amino acid residues (e.g., Asp, Glu, His, Lys) at the intended physiological pH. This ensures accurate hydrogen bonding and electrostatic interactions.
- Energy Minimization: Perform a limited energy minimization to relieve steric clashes introduced during the addition of hydrogens and assignment of charges, resulting in a more stable and physically realistic structure.
Table 1: Key Steps in Target Preparation
| Step | Description | Common Tools/Functions |
|---|---|---|
| Structure Sourcing | Acquiring 3D structure from PDB or via homology modeling | PDB, MODELLER, SWISS-MODEL |
| Binding Site Definition | Identifying the pocket where ligands will bind | Co-crystallized ligand location, site prediction algorithms |
| Structure Cleaning | Removing non-essential water molecules, ions, and ligands | Molecular visualization software (PyMOL, UCSF Chimera) |
| Hydrogen Addition | Adding H atoms and setting correct protonation states | Molecular docking suites (AutoDock Tools, Schrodinger Maestro) |
| Energy Minimization | Relaxing the structure to remove atomic clashes | Molecular dynamics or docking software force fields |
Chemical Library Design and Preparation
The chemical library is the source of potential hits, and its composition directly influences screening outcomes.
Library Selection and Curation
- Database Sources: Commercially available databases like the ZINC database are widely used, containing millions of purchasable compounds in ready-to-dock 3D formats [29] [30]. These often include specialized subsets, such as natural product libraries or lead-like compounds.
- Chemical Space and Drug-Likeness: Apply filters such as Lipinski's Rule of Five and other criteria to enrich the library with molecules that have desirable pharmacokinetic properties, thereby increasing the likelihood of identifying viable lead compounds.
Ligand Preparation
- Tautomer and Stereoisomer Generation: Generate plausible tautomers and stereoisomers for each compound to ensure the correct bioactive form is represented during docking.
- Energy Minimization: Optimize the 3D geometry of each ligand using molecular mechanics force fields to achieve a low-energy conformation, which provides a more realistic starting point for docking simulations.
Diagram 1: Chemical library preparation workflow for SBVS.
Molecular Docking Protocols and Validation
Docking involves predicting the binding pose and affinity of each small molecule within the target's binding site.
Docking Methodology and Execution
- Algorithm Selection: Choose a docking program (e.g., AutoDock Vina, Glide, GOLD) based on the target and project requirements. Each program uses different search algorithms and scoring functions to sample ligand conformations and rank them.
- Parameter Configuration: Define the search space by creating a grid or box that encompasses the entire binding site. Set parameters for exhaustiveness or number of runs to ensure adequate sampling of possible binding modes.
- Pose Prediction and Scoring: The docking software generates multiple binding poses for each ligand and assigns a score representing the predicted binding affinity, which is used for initial ranking.
Post-Docking Analysis and Validation
- Pose Clustering and Interaction Analysis: Inspect the top-ranked poses. Group similar poses together and critically analyze the protein-ligand interactions (e.g., hydrogen bonds, hydrophobic contacts, pi-stacking) to ensure they are chemically meaningful.
- Validation with Known Binders: A critical step is to validate the docking protocol by attempting to re-dock a known active ligand or inhibitor and reproduce its experimental binding mode (root-mean-square deviation, or RMSD, of <2.0 Å is typically considered successful).
Performance Comparison: SBVS vs. Ligand-Based Virtual Screening
While SBVS relies on the target's 3D structure, LBVS uses the known properties of active compounds to find new ones. The choice between them often depends on data availability and the project's goals. The table below summarizes a performance comparison based on published studies.
Table 2: SBVS vs. LBVS Performance Comparison from Case Studies
| Study & Target | Screening Approach | Key Experimental Protocol | Reported Outcome |
|---|---|---|---|
| Adenosine A1 Receptor [31] | SBVS: Docking of 4.6M compounds to A1/A2A crystal structures. | Molecular docking to exploit non-conserved subpocket; experimental testing of 20 predicted ligands. | 7 of 20 (35%) were confirmed antagonists; optimization yielded nanomolar potency & up to 76-fold selectivity. |
| TRPV4 Channel [32] | SBVS (Comparative Model) & LBVS (Pharmacophore). | SBVS: Docking to a comparative model. LBVS: Pharmacophore based on known antagonists. | 5 tested hits all inhibited TRPV4; one (Z1213735368) showed IC50 of 8 µM. Primarily structure-based hits were pursued. |
| Brd4 Protein [30] | SBVS (Structure-Based Pharmacophore). | Structure-based pharmacophore model generation from PDB: 4BJX, followed by virtual screening & molecular docking. | Model validation showed excellent AUC (1.0); screening identified 4 stable natural compounds with good binding affinity. |
| XIAP Protein [29] | SBVS (Structure-Based Pharmacophore). | Structure-based pharmacophore generation from PDB: 5OQW, validated via ROC curve (AUC: 0.98). | Virtual screening, docking, and MD simulation identified three stable natural compounds as potential leads. |
Diagram 2: Decision pathway for choosing between SBVS and LBVS approaches.
A successful virtual screening project relies on a suite of software tools and databases.
Table 3: Key Research Reagent Solutions for SBVS
| Resource Category | Example | Primary Function in SBVS |
|---|---|---|
| Protein Structure Database | Protein Data Bank (PDB) | Repository for experimentally determined 3D structures of proteins and nucleic acids. |
| Ready-to-Dock Compound Libraries | ZINC Database [29] [30] | A curated collection of commercially available chemical compounds prepared for virtual screening. |
| Molecular Docking Software | AutoDock Vina, Glide, GOLD | Programs that predict the binding pose and affinity of small molecules to a macromolecular target. |
| Structure Preparation Suites | Schrodinger Maestro, OpenBabel | Software used to add hydrogens, assign charges, and energy-minimize protein and ligand structures. |
| Pharmacophore Modeling Tools | LigandScout [29] [30] | Software for creating and visualizing structure-based or ligand-based pharmacophore models for screening. |
| Validation & Decoy Sets | DUD-E (Database of Useful Decoys: Enhanced) [29] [30] | Provides decoy molecules to test and validate the ability of a virtual screening method to identify true actives. |
The comparative analysis of SBVS and LBVS demonstrates that structure-based strategies are highly effective, particularly when high-resolution target structures are available and the goal is to discover novel chemical scaffolds. The success of SBVS hinges on a rigorous and well-validated protocol encompassing meticulous target preparation, a thoughtfully designed compound library, and a carefully executed and validated docking process. As computational power increases and structural data becomes more abundant, the integration of SBVS into the drug discovery pipeline is poised to become even more impactful, accelerating the identification of promising therapeutic candidates.
This guide provides an objective comparison of three core Ligand-Based Virtual Screening (LBVS) techniques—2D Fingerprints, 3D Shape Comparison, and Pharmacophore Modeling. Framed within the broader validation of structure-based versus ligand-based research, we summarize their performance, detail experimental protocols, and highlight key research solutions.
Performance Comparison at a Glance
The table below summarizes the performance characteristics and optimal use cases for each LBVS method, drawing from recent studies and benchmarks.
Table 1: Comparative Performance of LBVS Techniques
| Feature | 2D Fingerprints | 3D Shape Comparison | Pharmacophore Modeling |
|---|---|---|---|
| Core Principle | Encodes structural features from molecular connection tables [33] | Calculates overlap volume of molecular shapes [34] | Identifies essential steric and electronic features for bioactivity [35] |
| Molecular Representation | 1D bit vectors (e.g., ECFP4, ErG) [36] [33] | 3D molecular structures and volumes [34] | 3D spatial arrangement of features (e.g., H-bond donors, acceptors, hydrophobic regions) [20] [34] |
| Typical Application | Similarity searching, QSAR, scaffold hopping [35] [33] | Identifying structurally diverse compounds with similar bioactivity [34] | Virtual screening, de novo molecular design, scaffold hopping [35] [20] |
| Key Performance Metric | Predictive Accuracy (e.g., in QSAR) [33] | 3D Similarity Score (Phase Sim) [34] | Pharmacophoric Similarity (Spharma), Deviation in Feature Counts (Dcount) [20] |
| Reported Performance | Competes with 3D structure-based models in toxicity, solubility, and ligand-based binding affinity prediction [33] | Area Under ROC Curve of 0.7 for multi-ADE identification [34] | TransPharmer model generated molecules with higher pharmacophoric similarity than baselines (e.g., LigDream, PGMG) [20] |
| Computational Speed | Fast [33] | Slower (requires conformational analysis and alignment) [34] | Moderate to Slow (depends on model complexity and conformational sampling) [35] |
| Key Advantage | Speed, simplicity, proven effectiveness for many QSAR tasks [33] | Can identify bioactive molecules with different 2D structures [34] | Direct link to bioactivity; high interpretability; strong scaffold-hopping potential [20] |
| Main Limitation | Limited to relatively simple geometry; may miss 3D-structure-dependent activity [33] | Computationally intensive; sensitive to the quality of 3D conformations [34] | May not fully capture factors like binding affinity; dependent on reference ligand quality [36] |
Detailed Experimental Protocols
To ensure reproducibility and provide a deeper understanding of the methodologies, this section outlines standard experimental workflows for each LBVS technique.
Protocol for 2D Fingerprint-Based Screening and QSAR
This protocol is commonly used for rapid similarity searching and building predictive activity models [33] [37].
- Dataset Curation and Preparation: Collect a set of known active and inactive compounds for a specific target. Standardize molecular structures (e.g., neutralize charges, remove salts) and generate canonical Simplified Molecular-Input Line-Entry System (SMILES) or structure-data file (SDF) formats.
- Fingerprint Generation: Calculate 2D fingerprint vectors for all molecules using cheminformatics toolkits like RDKit or OpenBabel. Common choices include Extended-Connectivity Fingerprints (ECFP4), MACCS keys, or pharmacophore-based fingerprints like ErG [36] [33].
- Model Training (for QSAR): For machine learning, generate molecular descriptors and fingerprints from the training set using software like PaDEL-Descriptor [37]. Use the fingerprint vectors as features to train a supervised learning algorithm (e.g., Random Forest, Gradient Boosting, or Deep Neural Networks) to distinguish between active and inactive compounds. Optimize model parameters using cross-validation [36] [38].
- Similarity Searching or Prediction: For similarity search, calculate the Tanimoto coefficient between the fingerprint of a query active compound and all compounds in a screening library. For QSAR, use the trained model to predict the activity or property of new compounds in a test set [35].
- Validation: Evaluate model performance using metrics like accuracy, precision, recall, and Area Under the Curve (AUC) from a receiver operating characteristic (ROC) curve [37].
Protocol for 3D Shape-Based Screening
This protocol uses the 3D shape and pharmacophoric overlap of molecules to identify potential hits [34].
- 3D Structure Preparation: Obtain or generate the 3D structures of the query molecule(s) and the screening library. For each drug, generate different protonation states and enantiomers if chirality is unspecified.
- Conformational Analysis: Perform a conformational search for all molecules to identify low-energy 3D conformations. This is typically done using a force field (e.g., OPLS_2005) and a search engine like Monte Carlo Multiple Minimum (MCMM), retaining the global minimum energy structure for subsequent steps [34].
- Shape and Feature Alignment: Align each candidate molecule from the library to the 3D template of the query molecule. This step identifies similar shapes and overlapping pharmacophoric features (e.g., hydrogen bond donors/acceptors, aromatic rings, charged groups) between the pair.
- 3D Similarity Scoring: Calculate a 3D similarity score (e.g., Phase Sim) for each aligned pair. This score measures the overlap volume between pharmacophoric sites of the same type and ranges from 0 (dissimilar) to 1 (highly similar) [34].
- Hit Identification: Rank all compounds in the screening library based on their 3D similarity score to the query. Select top-ranking compounds for further experimental validation.
Protocol for Pharmacophore Model-Based Screening
This approach creates an abstract model of essential interaction features, which can be used for screening and de novo molecular design [35] [20].
- Training Set Selection: Compile a set of known active ligands for the target. For a robust model, include structurally diverse compounds with a range of potencies.
- Pharmacophore Feature Extraction & Model Generation: Identify common chemical features (e.g., using the ErG fingerprint) and their spatial relationships from the active ligands. Use this information to build a pharmacophore model, which consists of a set of features like hydrogen bond acceptors/donors, hydrophobic regions, and aromatic rings in 3D space [36] [20].
- Model Validation: Test the model's ability to discriminate between known active and inactive compounds not used in the model generation process.
- Virtual Screening: Use the validated pharmacophore model as a 3D query to screen large compound databases. The screening process identifies molecules that can spatially orient their features to match the model's constraints.
- Hit Evaluation & Experimental Testing: Evaluate the fitness of the screened hits and select the most promising candidates for synthesis and experimental testing in biochemical or cellular assays [20].
The Scientist's Toolkit: Essential Research Reagents & Solutions
Successful implementation of LBVS relies on a combination of software tools, databases, and computational resources.
Table 2: Key Research Reagents and Solutions for LBVS
| Item | Function in LBVS | Example Tools & Databases |
|---|---|---|
| Cheminformatics Toolkits | Generate 2D/3D molecular structures, calculate fingerprints and descriptors, and perform basic molecular operations. | RDKit [36] [33], OpenBabel [33] [37], PaDEL-Descriptor [37] |
| Pharmacophore Modeling Software | Develop, validate, and use pharmacophore models for virtual screening and molecular design. | Molecular Operating Environment (MOE) [36], Phase [34] |
| Machine Learning Platforms | Build and train predictive QSAR/QSPR models using fingerprint and descriptor data. | Scikit-learn, XGBoost [36] [33], Deep Neural Networks (e.g., TensorFlow, PyTorch) [33] [38] |
| Compound Databases | Source of known active compounds for model training and large chemical libraries for virtual screening. | ZINC [37], ChEMBL, DrugBank [34], PROTAC-DB [36] |
| High-Performance Computing (HPC) | Provides the computational power needed for processing large libraries and running complex algorithms like 3D shape matching or deep learning. | Local Clusters, Cloud Computing (AWS, Google Cloud, Azure) [38] |
Workflow and Method Selection Logic
The following diagram illustrates the logical relationship between the different LBVS techniques and their role in the broader drug discovery context, including integration with structure-based methods.
Diagram 1: LBVS Method Selection in Drug Discovery Workflow.
The selection of an appropriate LBVS method depends on the available data and the specific project goals. 2D fingerprints offer speed and effectiveness for standard similarity searches and QSAR. 3D shape comparison excels at scaffold hopping by identifying molecules with similar shapes but different 2D structures. Pharmacophore modeling provides a highly interpretable, feature-based approach that powerfully connects molecular structure to bioactivity and is increasingly integrated with generative AI for de novo design.
Framed within the broader thesis of LBVS versus SBVS, the evidence shows that LBVS methods remain highly competitive, and sometimes superior, to SBVS for tasks based solely on ligand information, such as predicting toxicity and solubility [33]. However, for predicting protein-ligand binding affinity when a reliable 3D protein structure is available, SBVS methods that incorporate complex 3D structural information maintain an advantage [4] [33]. The most powerful modern strategies often involve a synergistic combination of both LBVS and SBVS approaches to leverage their complementary strengths [4] [37].
The field of virtual screening is undergoing a profound transformation driven by artificial intelligence and machine learning technologies. Traditional virtual screening approaches, broadly categorized as structure-based virtual screening (SBVS) and ligand-based virtual screening (LBVS), have historically operated with distinct limitations—SBVS requiring precise 3D protein structures and substantial computational resources, while LBVS struggled with structural novelty and dependency on known active compounds [4]. The integration of machine learning, particularly deep learning and chemical language models, is now bridging these methodological divides, creating powerful hybrid approaches that enhance screening efficiency, accuracy, and applicability across diverse drug discovery scenarios.
Contemporary virtual screening platforms now leverage vast chemical datasets and sophisticated algorithms to navigate ultra-large chemical libraries containing billions of molecules, a task that was computationally prohibitive with traditional docking methods alone [4] [39]. The emergence of transformer-based architectures pre-trained on massive molecular datasets has further accelerated this paradigm shift, enabling models to learn complex chemical patterns and structure-activity relationships without explicit structural information [40] [41]. This technological evolution is critically important for drug development professionals seeking to optimize early hit identification campaigns against increasingly challenging biological targets, including mutated enzymes and resistant pathogen variants [42] [23].
Comparative Performance of ML-Enhanced Screening Approaches
Quantitative Performance Metrics Across Methods
Table 1: Performance comparison of virtual screening methods across diverse targets
| Method Category | Specific Approach | Target/Application | Performance Metrics | Reference |
|---|---|---|---|---|
| Traditional Docking | AutoDock Vina | SARS-CoV-2 Mpro (Wild-type) | Better-than-random enrichment | [42] |
| ML-Re-scored Docking | AutoDock Vina + CNN-Score | PfDHFR (Quadruple Mutant) | EF1% = 31 (Significant improvement over docking alone) | [23] |
| Hybrid Architecture | GCN + LLM Embeddings | Kinase targets | Accuracy: 88.7% (vs. 86.8% for GCN alone) | [43] |
| Chemical Language Model | MLM-FG (RoBERTa, 100M) | ClinTox classification | AUC-ROC: 0.96 (Superior to baselines) | [40] |
| Conditional CLM | SAFE-T | Virtual Screening (LIT-PCBA) | Performance comparable or better than existing approaches, significantly faster | [41] |
The quantitative data reveals distinct performance advantages across different ML-enhanced screening paradigms. For structure-based approaches, machine learning re-scoring of traditional docking outputs consistently enhances enrichment factors, particularly for challenging drug-resistant targets. Against the quadruple-mutant Plasmodium falciparum DHFR variant, re-scoring AutoDock Vina results with CNN-Score achieved an exceptional early enrichment factor (EF1%) of 31, dramatically improving the identification of true active compounds from decoys [23]. This demonstrates ML re-scoring's critical value in addressing resistance mutations that alter binding site geometries and complicate drug discovery.
For ligand-based screening, chemical language models pre-trained on massive molecular datasets show remarkable performance across diverse property prediction tasks. The MLM-FG model, which incorporates a novel functional group masking strategy during pre-training, achieved state-of-the-art results on 9 of 11 benchmark molecular property predictions, outperforming both SMILES-based and 3D-graph-based models without requiring explicit structural information [40]. This highlights how advanced pre-training strategies can capture complex chemical patterns directly from SMILES sequences, offering exceptional representation learning capabilities.
Emerging hybrid architectures that combine different AI approaches demonstrate synergistic effects. A novel graph convolutional network (GCN) architecture enhanced with large language model (LLM) embeddings achieved 88.7% accuracy on kinase-related datasets, outperforming standalone GCN (86.8%), Molformer (85.1%), and traditional machine learning models like XGBoost (85.0%) [43]. This performance advantage stems from the model's progressive enrichment of molecular representations with global chemical context throughout the network layers, enabling more expressive molecular featurization.
Performance in Real-World Discovery Campaigns
The practical utility of these advanced screening methods is increasingly validated through real-world applications and competitive benchmarks. In the Critical Assessment of Computational Hit-finding Experiments (CACHE) Challenge #1, which focused on finding ligands for the LRRK2-WDR domain with no known ligands available, hybrid approaches combining docking with various machine learning filters demonstrated superior performance [4]. Successful teams typically employed docking to navigate ultra-large libraries (36 billion compounds), supplemented with ML-based property predictions and similarity searching to prioritize compounds with favorable drug-like properties.
Conditional chemical language models like SAFE-T further expand these capabilities by enabling zero-shot predictions across diverse biological contexts without target-specific training data [41]. This framework models the conditional likelihood of molecular sequences given biological prompts (e.g., protein targets or mechanisms of action), supporting both virtual screening and molecular design tasks with interpretable, fragment-level attribution that captures known structure-activity relationships.
Experimental Protocols and Workflows
Integrated Structure-Based Screening with ML Re-scoring
Table 2: Key research reagents and computational tools for ML-enhanced virtual screening
| Category | Tool/Reagent | Specific Function | Application Context | |
|---|---|---|---|---|
| Docking Software | AutoDock Vina 1.5.7 | Generates initial protein-ligand poses and scores | Structure-based screening initial phase | [42] [23] |
| ML Scoring Functions | CNN-Score, RF-Score-VS v2 | Re-scores docking poses using machine learning | Improving enrichment after initial docking | [23] |
| Benchmarking Sets | DEKOIS 2.0 | Provides active compounds and decoys for performance evaluation | Method validation and comparison | [42] [23] |
| Molecular Descriptors | PaDEL-Descriptor | Generates 797 molecular descriptors and 10 fingerprint types | Feature generation for machine learning | [37] |
| Language Models | MLM-FG, SAFE-T | Learns chemical patterns from large-scale SMILES data | Property prediction and molecule generation | [40] [41] |
A representative protocol for ML-enhanced structure-based screening begins with preparation of protein structures from the Protein Data Bank, removing water molecules, unnecessary ions, and redundant chains, then adding and optimizing hydrogen atoms [23]. For the benchmarking phase, researchers compile known active molecules and generate decoys using tools like DEKOIS 2.0, which creates challenging benchmark sets with a typical ratio of 1 active to 30 decoys to rigorously test screening performance [42] [23].
The docking phase employs tools like AutoDock Vina, FRED, or PLANTS with carefully defined grid boxes encompassing the binding site of interest. For example, in SARS-CoV-2 Mpro benchmarking, grid dimensions of approximately 20×20×20 Å with 1 Å spacing ensured comprehensive coverage of the binding site [42]. Following docking, the critical ML re-scoring phase applies pretrained scoring functions like CNN-Score or RF-Score-VS v2 to the generated poses, significantly improving enrichment over traditional scoring functions [23].
Validation typically involves molecular dynamics simulations using software like GROMACS to assess binding stability, followed by MM-GBSA/MM-PBSA calculations to estimate binding affinities [42]. This comprehensive protocol, combining traditional docking with ML re-scoring and biophysical validation, has demonstrated particular utility against resistant targets where conventional screening methods struggle.
Figure 1: Structure-based virtual screening workflow with ML re-scoring
Ligand-Based Screening with Chemical Language Models
For ligand-based approaches, the experimental workflow centers on chemical language models pre-trained on massive molecular datasets. The MLM-FG protocol begins with large-scale pre-training on 100 million unlabeled molecules from PubChem, employing a novel functional group masking strategy that randomly masks chemically significant subsequences in SMILES strings, forcing the model to learn contextual relationships between molecular substructures [40].
The fine-tuning phase adapts the pre-trained model to specific property prediction tasks using benchmark datasets from MoleculeNet, with scaffold splitting ensuring rigorous evaluation of generalizability to structurally distinct molecules [40]. For virtual screening applications, models like SAFE-T employ conditional generation, where the model learns the likelihood of molecular sequences given biological context (e.g., protein targets or mechanisms of action), enabling both scoring and generation of molecules aligned with biological objectives [41].
These models support interpretability analysis through fragment-level attribution, revealing which molecular substructures drive predicted bioactivity and providing chemical insights that complement traditional quantitative structure-activity relationship (QSAR) models [41]. This entire workflow operates without requiring explicit 3D structural information, making it broadly applicable across diverse targets including those without experimentally determined structures.
Figure 2: Chemical language model training and application workflow
Comparative Analysis: Structure-Based vs. Ligand-Based in the AI Era
The integration of machine learning has reshaped the traditional strengths and limitations of structure-based and ligand-based screening approaches. While structure-based methods maintain advantages for novel targets with known structures, ligand-based methods have gained significant ground through chemical language models that capture deep chemical patterns without requiring structural information.
Performance Across Target Types
For well-established targets with substantial known active compounds, ligand-based methods leveraging chemical language models demonstrate exceptional efficiency and accuracy. The MLM-FG model achieved superior performance on 9 of 11 benchmark tasks including BBBP, ClinTox, Tox21, HIV, and MUV, with AUC-ROC values up to 0.96, outperforming even 3D-graph-based models that explicitly incorporate structural information [40]. This demonstrates that pre-training on massive molecular datasets can effectively capture complex structure-activity relationships without costly 3D structure generation.
For targets with binding site mutations or resistance mechanisms, structure-based approaches with ML re-scoring provide critical advantages. Against the quadruple-mutant PfDHFR variant, traditional docking alone showed worse-than-random enrichment, but ML re-scoring with CNN-Score dramatically improved performance to EF1% = 31, successfully identifying diverse, high-affinity binders against this challenging resistant target [23]. This underscores the continued importance of explicit structural consideration for drug-resistant targets.
Practical Implementation Considerations
From a practical implementation perspective, ligand-based chemical language models offer significant computational efficiency advantages, with models like SAFE-T demonstrating performance comparable to or better than existing approaches while being significantly faster [41]. This enables screening of ultra-large libraries that would be computationally prohibitive with traditional docking approaches.
However, structure-based methods provide invaluable mechanistic insights through explicit modeling of binding interactions, which can guide lead optimization campaigns. The combination of both approaches in sequential or parallel workflows represents an emerging best practice, leveraging the complementary strengths of each method [4]. Successful implementations in competitive benchmarks like CACHE Challenge #1 typically employ docking for initial screening followed by ML-based filtering and prioritization [4].
The field of virtual screening continues to evolve rapidly, with several emerging trends shaping its future trajectory. Multi-modal approaches that combine structural information with chemical language model embeddings show particular promise, as demonstrated by hybrid GCN-LLM architectures that achieve superior performance by progressively enriching molecular representations with global chemical context [43]. These approaches effectively bridge the historical divide between structure-based and ligand-based paradigms.
The development of better benchmarking practices remains crucial for fair comparison and advancement of the field. Standardized benchmark sets like DEKOIS 2.0 and rigorous evaluation metrics including early enrichment factors and chemotype diversity analysis provide essential frameworks for methodological assessment [42] [23]. As library sizes expand into the billions of compounds, proper benchmarking becomes increasingly important for distinguishing genuine methodological advances from random variations.
In conclusion, machine learning and artificial intelligence have fundamentally transformed virtual screening from both methodological and practical perspectives. The integration of deep learning architectures, chemical language models, and traditional physics-based approaches has created a new generation of screening tools with enhanced accuracy, efficiency, and applicability across diverse drug discovery scenarios. For researchers and drug development professionals, this technological evolution offers unprecedented opportunities to navigate expanding chemical spaces and address increasingly challenging biological targets, ultimately accelerating the discovery of novel therapeutic agents.
This guide objectively compares the performance of structure-based virtual screening (SBVS) and ligand-based virtual screening (LBVS) by analyzing real-world data from the Critical Assessment of Computational Hit-finding Experiments (CACHE) challenges and recent peer-reviewed literature. The CACHE initiative provides a unique, unbiased platform for experimentally benchmarking computational hit-finding methods through blind predictions and rigorous experimental validation [44] [45].
The discovery of novel bioactive molecules is a critical, resource-intensive first step in drug development. For decades, the computational drug discovery community has been divided between two primary strategies: structure-based virtual screening (SBVS), which relies on the three-dimensional structure of a protein target to identify binders via molecular docking, and ligand-based virtual screening (LBVS), which uses known active ligands to find new compounds with similar properties or pharmacophores [28] [4]. While both have documented successes, claims of superiority are often based on retrospective studies or internal benchmarks, lacking independent, prospective experimental validation.
The CACHE challenges were established to address this need, providing a level playing field to evaluate diverse computational methods through cycles of prediction and experimental testing [44]. The results from these challenges, along with other recent case studies, provide the most objective data available to assess the real-world performance, strengths, and weaknesses of these approaches. The overarching thesis is that while SBVS currently dominates the identification of novel chemical matter, particularly for targets with little prior ligand data, hybrid methods that intelligently combine LBVS and SBVS principles are emerging as the most powerful and reliable strategies [4].
CACHE Challenge Case Studies
CACHE Challenge #4: Targeting the TKB Domain of CBLB
CACHE Challenge #4 focused on finding ligands for the TKB domain of the Cbl Proto-Oncogene B (CBLB) protein. An analysis of the methods used by participating teams reveals a strong preference for structure-based techniques, often enhanced by machine learning and AI [46].
Table 1: Representative Methodologies from CACHE Challenge #4
| Method/Team Name | Primary Approach | Key Software & Tools | LBVS/SBVS Combination |
|---|---|---|---|
| VirtualFlow/Ultra-Large Virtual Screens | Structure-based ultra-large virtual screening | VirtualFlow, AutoDock Vina, Smina [46] | Primarily SBVS |
| Frag2Hits | Structure-based screening enhanced by generative modeling | FTMap server, RDKit, ReLeaSE [46] | Primarily SBVS |
| CPI-MD | Rapid screening followed by binding pose/affinity prediction | Pytorch, ChemBERT, GROMACS [46] | Sequential LBVS->SBVS |
| PyRMD2Dock | Ligand-based screening to accelerate docking | PyRMD, AutoDock-GPU [46] | Sequential LBVS->SBVS |
| Evolutionary Chemical Binding Similarity (ECBS) | Primary screening with ligand-based model | RDKit, AutoDock VINA, DOCK6 [46] | Sequential LBVS->SBVS |
Key Observations from Challenge #4:
- SBVS Dominance: The vast majority of teams employed molecular docking as their core screening methodology [46].
- AI/ML Enhancement: Many methods incorporated machine learning, either to improve scoring functions, to generate novel molecular structures, or to pre-filter compounds before more costly physics-based docking [46].
- Sequential Combination: A common strategy was to use faster, less computationally intensive methods (including LBVS or simple ML models) to filter ultra-large libraries down to a manageable size for more rigorous, physics-based SBVS [46]. The PyRMD2Dock protocol is a prime example, using the ligand-based PyRMD tool to rapidly screen massive databases before passing the top candidates to AutoDock-GPU for docking [46].
The First CACHE Challenge: Targeting the LRRK2-WDR Domain
The inaugural CACHE challenge tasked participants with finding binders for the WD-40 repeat (WDR) domain of LRRK2, a target with a known apo structure but no publicly available active ligands—a scenario that inherently favors SBVS [4] [45]. A comprehensive review of the results concluded that "docking was conducted by each participant to either directly screen the large library or further prioritize the compounds," while LBVS-style QSAR models were less frequently used, mentioned only as in-house models without detailed disclosure [4].
This challenge highlighted a key limitation of pure LBVS: its reliance on known ligand data. For a target like LRRK2-WDR with no such data, SBVS was the only viable starting point for most teams. The results underscored the value of consensus scoring—combining rankings from multiple docking programs or scoring functions—to improve the robustness of hit selection [4].
Recent Literature Success Stories
Independent studies from academic groups further validate and illustrate the trends observed in CACHE.
AI-Accelerated Virtual Screening for KLHDC2 and NaV1.7
Researchers developed an AI-accelerated virtual screening platform called OpenVS, which uses active learning to efficiently triage billions of compounds for physics-based docking with RosettaVS [22]. In a rigorous test, they targeted two unrelated proteins: the ubiquitin ligase KLHDC2 and the ion channel NaV1.7.
Table 2: Performance Results from AI-Accelerated Virtual Screening [22]
| Target Protein | Library Size Screened | Experimental Hit Rate | Best Binding Affinity (KD) | Screening Time |
|---|---|---|---|---|
| KLHDC2 (Ubiquitin Ligase) | Multi-billion compound library | 14% (7 hits from 50 tested) | Single-digit µM | < 7 days |
| NaV1.7 (Sodium Channel) | Multi-billion compound library | 44% (4 hits from 9 tested) | Single-digit µM | < 7 days |
This case study demonstrates the potent combination of SBVS and AI. The platform leveraged the strengths of physics-based docking (RosettaVS) for accurate pose and affinity prediction, while using AI-driven active learning to make the screening of billions of compounds computationally feasible. The success was further validated by an X-ray crystallographic structure that confirmed the predicted binding pose for a KLHDC2 ligand [22].
Combined LBVS and SBVS in the AI Era
A 2024 review article synthesized the emerging best practices for combining LBVS and SBVS, which can be implemented in three primary ways [4]:
- Sequential Combination: Using one method (e.g., LBVS) as a fast filter to reduce the chemical space for a more computationally expensive method (e.g., SBVS). This is a pragmatic approach for managing resources.
- Hybrid Combination: Integrating both approaches into a single, unified framework, such as developing machine learning scoring functions that use both ligand-based descriptors and protein-ligand interaction fingerprints.
- Parallel Combination: Running LBVS and SBVS independently and then merging their ranked outputs using data fusion algorithms to create a final priority list.
The review emphasizes that ML is rapidly advancing both paradigms: LBVS is evolving with chemical language models, while SBVS is breaking traditional scoring limitations with deep learning. The most promising future direction lies in hybrid "physical-informed interaction-based models" that can leverage the strengths of both while gaining generalizability and interpretability [4].
Experimental Protocols & Workflows
The success stories above share common elements in their experimental designs. Below is a detailed protocol for a typical hybrid virtual screening campaign, reflecting the strategies used by top-performing CACHE teams.
Detailed Protocol for a Hybrid Virtual Screening Campaign
Phase 1: Preparation of Inputs
- Target Preparation: Obtain the 3D structure of the target protein (e.g., from PDB or via homology modeling). Use protein preparation software (e.g., within Schrödinger Maestro or BIOVIA Discovery Studio) to add hydrogen atoms, assign protonation states, and optimize side-chain conformations for residues not directly involved in binding [46] [28].
- Library Preparation: Curate a library of purchasable or synthesizable compounds (e.g., from the Enamine REAL database). Prepare all ligands by generating likely tautomers, stereoisomers, and protonation states at physiological pH (e.g., using OpenBabel or RDKit) [28] [22].
- Binding Site Definition: Define the binding site coordinates based on a known co-crystal structure or by using binding site detection algorithms (e.g., FTMap or P2Rank) [46].
Phase 2: Sequential LBVS -> SBVS Screening
- LBVS Pre-filtering: Apply a ligand-based method to rapidly reduce the library size. This could involve:
- Chemical Similarity Search: Using molecular fingerprints (e.g., ECFP4) to find compounds similar to a known active ligand.
- Pharmacophore Model: Screening for compounds that match a 3D pharmacophore derived from known actives or the binding site structure.
- Machine Learning Model: Using a pre-trained QSAR or graph neural network model to predict activity [4].
- Molecular Docking (SBVS): Dock the remaining compounds (typically 10,000 - 1,000,000) into the binding site using a docking program such as AutoDock Vina, Glide, or rDOCK. Generate multiple poses per ligand [46] [22].
- Pose Scoring and Ranking: Score all generated poses using one or more scoring functions (e.g., the built-in function of the docking software, a custom ML-based function, or a consensus of multiple functions). Rank the compounds based on their best docking score [28] [22].
Phase 3: Post-Processing and Selection
- Interaction Analysis: Visually inspect the top-ranked poses to check for key ligand-protein interactions (e.g., hydrogen bonds, pi-stacking, hydrophobic contacts). Reject compounds with nonsensical binding modes.
- Property Filtering: Apply drug-likeness filters (e.g., Lipinski's Rule of Five) and assess other physicochemical properties to prioritize compounds with favorable developability profiles.
- Compound Acquisition: Select the final hit list (typically 50-500 compounds) for experimental purchase and testing in binding assays (e.g., Surface Plasmon Resonance) [44].
Workflow Visualization
The following diagram illustrates the logical flow of a sequential hybrid virtual screening workflow, as implemented by several CACHE teams.
Figure 1: A sequential hybrid virtual screening workflow that combines LBVS and SBVS.
The Scientist's Toolkit: Essential Research Reagents & Solutions
The following table details key software tools, databases, and resources that are essential for conducting modern virtual screening campaigns, as evidenced by their repeated use in CACHE challenges and recent literature.
Table 3: Essential Virtual Screening Research Toolkit
| Tool/Resource Name | Type | Function in Virtual Screening | License |
|---|---|---|---|
| AutoDock Vina/GPU | Docking Software | Performs molecular docking to predict ligand binding poses and scores [46] [22]. | Free |
| Schrödinger Glide | Docking Software | High-accuracy molecular docking for pose prediction and virtual screening [46] [28]. | Commercial |
| RDKit | Cheminformatics | Open-source toolkit for cheminformatics, used for molecule manipulation, descriptor calculation, and fingerprinting [46] [4]. | Free |
| OpenBabel | Cheminformatics | A chemical toolbox designed to speak the many languages of chemical data, crucial for file format conversion [46]. | Free |
| Enamine REAL / ZINC | Compound Database | Providers of ultra-large libraries of commercially available compounds for virtual screening [46] [4]. | Commercial / Free |
| PyTorch/TensorFlow | Machine Learning | Frameworks for building and training custom ML and deep learning models for scoring or compound prioritization [46] [22]. | Free |
| GROMACS | Molecular Dynamics | Software for performing molecular dynamics simulations to refine docking poses or assess binding stability [46]. | Free |
| CETSA | Experimental Validation | Cellular Thermal Shift Assay used for validating direct target engagement in intact cells, confirming computational predictions [47]. | Commercial / Assay |
The real-world data from the CACHE challenges and recent high-profile publications lead to several definitive conclusions in the ongoing validation thesis of SBVS vs. LBVS:
- SBVS is the dominant and most versatile starting point, especially for targets with known structures but limited ligand information (e.g., CACHE #1 and #4). Its ability to identify novel chemical scaffolds without relying on pre-existing SAR data is a decisive advantage [46] [4].
- Pure LBVS is constrained by ligand data availability but remains highly valuable as a pre-filter or in hybrid models when active compound data exists [4].
- Hybrid strategies that combine LBVS and SBVS, particularly in a sequential manner, offer a pragmatic balance of computational efficiency and screening power [46] [4].
- AI and ML are not replacements but powerful accelerators for physics-based methods. They enable the screening of billion-member libraries and improve scoring function accuracy, as demonstrated by the OpenVS platform's success [22].
The future of computational hit-finding lies not in choosing between structure-based or ligand-based methods, but in the intelligent, synergistic integration of both, powered by machine learning and validated through rigorous, independent benchmarks like the CACHE challenges.
The advent of synthetically accessible ultra-large chemical libraries, containing billions or even trillions of compounds, has fundamentally transformed virtual screening in drug discovery. While these vast libraries offer unprecedented opportunities for hit identification, they present a formidable computational challenge: the brute-force evaluation of every compound through physics-based docking methods is often prohibitively expensive or completely unfeasible without supercomputing infrastructure [48]. This limitation has catalyzed the development of innovative computational strategies that balance thoroughness with practicality. These approaches broadly fall into two categories: AI-accelerated screening workflows that intelligently prioritize compounds for detailed evaluation, and hybrid methods that integrate ligand-based and structure-based techniques to maximize effectiveness [22] [18]. The performance of these methods is particularly crucial for challenging targets like protein-protein interactions (PPIs), where traditional docking methods face limitations due to shallow, solvent-exposed binding interfaces [48]. This guide provides an objective comparison of current platforms and methodologies for navigating billion-compound spaces, presenting experimental data to help researchers select appropriate strategies for their specific discovery campaigns.
Performance Comparison of Virtual Screening Platforms
Quantitative Performance Metrics Across Platforms
Table 1: Virtual Screening Platform Performance Benchmarks
| Platform/Method | Screening Speed (Molecules/Day) | Enrichment Factor (EF) at 1% | Hit Rate in Prospective Studies | Key Advantages |
|---|---|---|---|---|
| Deep Docking [48] | Not specified | Not specified | 50.0% (STAT3); 42.9% (STAT5b) | Exceptional hit rates; Economic (docked ~120,000 compounds) |
| HelixVS [25] | >10 million | 26.968 | >10% (multiple targets) | Multi-stage screening; 159% more actives than Vina; 15x faster than Vina |
| RosettaVS [22] | Completed billion-library in <7 days | EF1% = 16.72 (CASF2016) | 14% (KLHDC2); 44% (NaV1.7) | Models receptor flexibility; Superior pose prediction |
| VirtuDockDL [49] | Not specified | Not specified | 99% accuracy (HER2 benchmark) | Graph Neural Network; Superior to DeepChem (89%) and Vina (82%) |
| AutoDock Vina [25] | ~300 | 10.022 | Baseline for comparison | Widely used; Open source |
| Consensus Holistic Screening [50] | Not specified | Not specified | AUC: 0.90 (PPARG); 0.84 (DPP4) | Combines QSAR, pharmacophore, docking, 2D similarity |
Strategic Implications of Performance Data
The quantitative data reveals distinct strategic trade-offs between screening platforms. AI-accelerated methods like Deep Docking and HelixVS demonstrate exceptional cost-effectiveness by drastically reducing the number of compounds requiring full docking evaluation while maintaining high hit rates [48] [25]. RosettaVS excels in accuracy metrics, particularly in pose prediction and enrichment factors, making it valuable for targets where binding mode accuracy is paramount [22]. The multi-stage approach of HelixVS, which combines classical docking with deep learning-based affinity scoring, offers a balanced strategy that leverages the strengths of both physical and machine learning methods [25]. For research teams with limited computational resources, consensus approaches that combine multiple simpler methods can provide robust performance without requiring specialized platforms [50].
Workflow Architectures for Ultra-Large Library Screening
AI-Accelerated Screening Workflows
Table 2: Characteristic Workflow Stages of AI-Accelerated Platforms
| Workflow Stage | Deep Docking [48] | HelixVS [25] | RosettaVS/OpenVS [22] |
|---|---|---|---|
| Initial Filtering | Deep learning model predicts docking scores | QuickVina 2 docking, multiple conformations retained | Active learning selects compounds for docking |
| Refinement | Iterative model retraining on docked subsets | DL-based affinity scoring (RTMscore-enhanced) | Virtual Screening High-precision (VSH) mode |
| Final Selection | Top-ranked compounds by predicted score | Binding mode filtering, clustering for diversity | Physics-based ranking with flexibility |
| Key Innovation | AI prioritization for docking | Multi-conformation, multi-isomer analysis | Target-specific neural network training |
Hybrid and Consensus Screening Approaches
For research teams without access to specialized platforms, hybrid workflows combining ligand-based and structure-based methods offer a practical alternative. These typically follow either sequential or parallel configurations [18]. In sequential workflows, rapid ligand-based filtering reduces large compound libraries to a manageable subset for more computationally expensive structure-based refinement [18]. Parallel screening runs both approaches independently, with results combined through consensus scoring frameworks that either select top candidates from both methods or create unified rankings through multiplicative or averaging strategies [18]. Studies demonstrate that hybrid models averaging predictions from both structure-based and ligand-based approaches can outperform either method alone through partial cancellation of errors [18].
Experimental Protocols and Methodologies
Benchmarking Standards and Validation
To ensure fair comparison across methods, researchers should employ established benchmarking datasets and metrics:
- DUD-E Dataset: Contains 102 proteins across 8 diverse families with 22,886 active molecules and property-matched decoys [25]. This is the most widely used benchmark for virtual screening performance evaluation.
- CASF-2016 Benchmark: Consists of 285 diverse protein-ligand complexes specifically designed for scoring function evaluation [22].
- Key Metrics:
For method validation, prospective applications with experimental testing of top-ranked compounds provide the most convincing evidence of utility, as demonstrated by multiple platforms achieving double-digit hit rates in real drug discovery campaigns [48] [22] [25].
Implementation Considerations for Different Target Classes
Performance varies significantly across target classes, requiring tailored approaches:
- Protein-Protein Interactions: Shallow, solvent-exposed interfaces challenge traditional docking. Deep Docking has shown exceptional hit rates (50.0%) for STAT3-SH2 domain, a difficult PPI target [48].
- Traditional Binding Pockets: Methods like RosettaVS excel here, particularly with flexible sidechain modeling [22].
- Dual-Target Screening: HelixVS has successfully identified actives in difficult dual-target scenarios [25].
Essential Research Reagent Solutions
Table 3: Key Computational Tools for Virtual Screening Workflows
| Tool/Category | Specific Examples | Primary Function | Application Context |
|---|---|---|---|
| Chemical Libraries | Enamine REAL (5.51B compounds), Mcule-in-stock, DrugBank | Source of screening compounds | Ultra-large libraries for novel hit identification; Focused libraries for repurposing |
| Docking Software | AutoDock Vina, QuickVina 2, Rosetta GALigandDock | Pose generation and scoring | Baseline docking; High-accuracy docking with flexibility |
| Machine Learning Frameworks | RDKit, PyTorch Geometric, KNIME | Molecular featurization, model building | Fingerprint calculation, graph neural networks, workflow automation |
| Benchmarking Resources | DUD-E, CASF-2016 | Method validation and comparison | Standardized performance assessment |
| Consensus Scoring | Custom pipelines (e.g., "w_new" metric) | Multi-method integration | Improved robustness over single methods |
Visualizing Screening Workflows
AI-Accelerated Multi-Stage Screening Architecture
Hybrid Ligand and Structure-Based Screening Strategy
The evolving landscape of ultra-large library screening offers multiple pathways for efficient navigation of billion-compound spaces. AI-accelerated platforms like Deep Docking, HelixVS, and RosettaVS provide specialized solutions for research teams with access to these tools, delivering validated performance with exceptional hit rates and reduced computational costs [48] [22] [25]. For broader research applications, hybrid methodologies that combine ligand-based and structure-based approaches through sequential or parallel workflows offer robust alternatives that can be implemented with open-source tools [18] [50]. The choice between these strategies should be guided by target class, available structural information, computational resources, and required throughput. As chemical libraries continue to expand into the trillions of compounds, these intelligent navigation strategies will become increasingly essential for efficient drug discovery.
Beyond the Basics: Overcoming Pitfalls and Enhancing Virtual Screening Performance
Addressing Target Flexibility and Solvation Effects in SBVS
This guide compares modern computational strategies for tackling two of the most persistent challenges in Structure-Based Virtual Screening (SBVS): the dynamic nature of protein targets (flexibility) and the critical role of water molecules (solvation effects). Within the broader thesis of validating SBVS against Ligand-Based Virtual Screening (LBVS), effectively managing these factors is a key differentiator for SBVS, enabling the discovery of novel bioactive compounds where LBVS, reliant on known ligand information, may struggle.
In SBVS, molecular docking is used to predict how a small molecule (ligand) binds to a target protein. Traditional docking often treats the protein as a rigid static structure and can oversimplify the role of water, which risks missing promising compounds or identifying false positives. Target flexibility refers to the conformational changes a protein undergoes upon ligand binding, ranging from side-chain rotations to large loop movements. Solvation effects involve the influence of water molecules, which can mediate ligand-protein interactions or need to be displaced for binding to occur. Ignoring these phenomena significantly limits the predictive power of SBVS. Advanced protocols, as detailed below, are essential for improving the accuracy and success rate of virtual screening campaigns.
Comparative Analysis of Strategic Approaches
The following table summarizes the core strategies for addressing flexibility and solvation, along with their performance considerations.
Table 1: Comparison of Strategic Approaches to Key SBVS Challenges
| Challenge | Strategic Approach | Methodology | Reported Performance Impact |
|---|---|---|---|
| Target Flexibility | Ensemble Docking [28] | Docking against multiple protein conformations (e.g., from crystal structures or MD simulations). | Improved identification of novel inhibitors; one study discovered a highly potent (69 nM) inhibitor for DAPK [28]. |
| Machine Learning Scoring [6] [4] | Using ML models trained on structural data to rescore docking poses, implicitly learning flexible interactions. | Shown stable and high prediction accuracy across multiple targets; can outperform classical scoring functions [6]. | |
| Solvation Effects | Structural Water & Ions [28] | Explicitly including key crystallographic water molecules and metal ions in the docking simulation. | Considered a key environmental factor for understanding ligand-target interactions; crucial for targets like metalloenzymes [28] [51]. |
| MD/MM-GBSA Post-Processing [51] | Using Molecular Dynamics and implicit solvation models to refine docking results and calculate binding free energy. | Significantly improved binding affinity estimates; one study identified a compound with a ΔG of -35.77 kcal/mol vs. -18.90 kcal/mol for a control [51]. |
Advanced Experimental Protocols
This section details the methodologies behind the strategies outlined above, providing a blueprint for their implementation.
Protocol 1: Ensemble Docking for Target Flexibility
Objective: To account for protein conformational changes and identify ligands that bind to different low-energy states of the target.
Workflow:
- Conformational Ensemble Generation: Collect multiple experimental structures from the Protein Data Bank (PDB) for the same target, particularly those co-crystallized with different ligands. If experimental structures are limited, generate conformations using Molecular Dynamics (MD) simulations. A recommended method involves running MD with multiple ligands simultaneously in the binding site to generate a diverse ensemble [28].
- Conformer Selection: Select a representative set of conformers. A simple heuristic is to prioritize structures co-crystallized with the largest ligands, as they often induce more representative binding site shapes [28].
- Parallel Docking: Perform molecular docking (e.g., using AutoDock Vina or Glide) of the compound library against each protein conformer in the ensemble.
- Result Consolidation: Combine the results from all docking runs. Rank compounds based on their best binding score across the entire ensemble.
The following diagram illustrates this multi-conformation workflow.
Figure 1: Ensemble Docking Workflow for Target Flexibility
Protocol 2: MD and MM/GBSA for Solvation and Stability
Objective: To rigorously evaluate binding stability and affinity by explicitly simulating the dynamic protein-ligand complex in an aqueous environment.
Workflow:
- Docking & Pose Selection: Perform standard molecular docking to generate initial protein-ligand complex poses. Select top-ranked poses for further analysis.
- System Preparation: Solvate the protein-ligand complex in a water box (e.g., TIP3P model) and add ions to neutralize the system's charge.
- Molecular Dynamics Simulation: Run a full MD simulation (e.g., for 100-300 ns) using software like AMBER, GROMACS, or NAMD. This allows the system to equilibrate and captures flexible interactions and explicit water dynamics.
- Binding Free Energy Calculation: Use the Molecular Mechanics/Generalized Born Surface Area (MM/GBSA) method on snapshots from the MD trajectory. This method calculates binding free energy by combining gas-phase energies with solvation terms, offering a more accurate estimate than docking scores alone [51].
- Interaction Analysis: Analyze the final MD trajectories to identify stable key interactions, including water-mediated hydrogen bonds.
The workflow for this more rigorous, dynamics-based approach is shown below.
Figure 2: MD/MM-GBSA Workflow for Solvation and Stability
The Scientist's Toolkit: Essential Research Reagents
Successful implementation of the aforementioned protocols relies on a suite of computational tools and data resources.
Table 2: Key Research Reagent Solutions for Advanced SBVS
| Category | Item/Software | Function in Protocol |
|---|---|---|
| Software & Platforms | AutoDock Vina, Glide, GOLD [28] | Core molecular docking engines for pose generation and initial scoring. |
| GROMACS, AMBER, NAMD | Software for running Molecular Dynamics simulations to study flexibility and solvation. | |
| HelixVS, RTMscore [25] | Deep learning-enhanced platforms for more accurate pose scoring and affinity prediction. | |
| Data Resources | Protein Data Bank (PDB) [6] | Primary repository for experimentally-determined protein structures to build conformational ensembles. |
| ZINC, PubChem, ChEMBL [28] [6] | Public databases of purchasable and annotated chemical compounds for screening libraries. | |
| Computational Methods | MM/GBSA, MM/PBSA [51] | Post-docking methods to calculate binding free energy, incorporating solvation effects. |
| Interaction Fingerprints (e.g., FIFI, PLEC) [6] | Hybrid method encoding protein-ligand interaction patterns, usable with ML for activity prediction. |
Performance Data and Validation
The superiority of these advanced methods is demonstrated by both retrospective benchmarks and real-world applications.
Table 3: Quantitative Performance Comparison of Screening Methods
| Screening Method | Reported Enrichment Factor (EF₁%) | Key Advantages | Application Context |
|---|---|---|---|
| Classic Docking (Vina) | 10.022 [25] | Fast, widely used, good for initial filtering. | Baseline performance on the DUD-E benchmark. |
| Deep Learning Platform (HelixVS) | 26.968 [25] | 2.6x higher EF than Vina; integrates ML scoring and is >10x faster. | Successful identification of µM/nM inhibitors in real drug development projects [25]. |
| MD/MM-GBSA Post-Processing | N/A | Provides superior binding affinity (ΔG) estimates and stability data. | Identified a natural product with ΔG of -35.77 kcal/mol for NDM-1, much better than control [51]. |
| Hybrid VS (IFP with ML) | High, stable accuracy [6] | Leverages both structural and ligand information; performs well with limited known actives. | Retrospective evaluation on six diverse biological targets [6]. |
The integration of machine learning is particularly transformative. For example, HelixVS incorporates a deep learning-based scoring model which, when used to rescore poses from a fast docking program, led to a 159% increase in the number of active molecules identified compared to using the docking program alone [25]. Furthermore, ML-based QSAR models can efficiently pre-filter massive natural product libraries before docking, streamlining the discovery of potent inhibitors like those targeting NDM-1 [51].
Ligand-Based Virtual Screening (LBVS) is a cornerstone of modern drug discovery, leveraging known active compounds to identify new hits with similar structural or pharmacophoric features. However, its efficacy is critically dependent on the integrity of its design and validation protocols. A primary threat to this integrity is analog bias, a form of circular reasoning where the method used to select compounds is unduly influenced by the very structural analogues used to develop the screening model. This bias, often embedded within the training data and benchmark libraries, can lead to spectacularly inflated performance during retrospective validation and profound disappointment in prospective screening campaigns. This occurs because models may simply learn to recognize chemical features over-represented in the training set, rather than the underlying principles of biological activity [52]. The issue is compounded by library design flaws, where decoy molecules (presumed inactives) are selected in a way that makes them trivially distinguishable from actives based on superficial properties, not true bioactivity [52] [53]. Within the broader thesis of validating structure-based versus ligand-based methods, understanding and mitigating these biases is paramount. It ensures that the observed performance of an LBVS method reflects a genuine capacity to identify novel chemotypes, rather than an artifact of a flawed experimental setup.
The Analog Bias Problem: Definition and Experimental Evidence
Analog bias arises when the set of known active compounds used to train or validate an LBVS model lacks sufficient chemical diversity. If the active set is densely populated with close structural analogues, a model can achieve high performance by simply memorizing common molecular sub-structures, without generalizing the true pharmacophoric pattern required for binding. This creates a model that is excellent at finding more of the same but fails when tasked with scaffold hopping to novel chemotypes.
Experimental Evidence from Benchmark Dataset Analysis
A critical analysis of benchmark datasets has revealed the profound impact of analog bias. In a landmark study, researchers investigated the Directory of Useful Decoys: Enhanced (DUD-E), a dataset widely used to train and evaluate machine learning models [52]. The study constructed tests to isolate the contributions of different information sources to model performance.
Key Experimental Protocol & Findings:
- Objective: To determine whether Convolutional Neural Network (CNN) models were learning the underlying physics of protein-ligand interactions or the biases inherent in the DUD-E dataset.
- Methodology: The researchers carefully constructed training and test set combinations to isolate the effects of:
- Protein-ligand interactions: The genuine physics of molecular recognition.
- Analogue bias: Chemical correlations between binders of the same target.
- Decoy bias: Patterns resulting from the topological dissimilarity criteria used to select decoys.
- Results: The superior enrichment efficiency reported in many CNN models was attributed not to successful generalization of interaction patterns, but to the analogue and decoy biases hidden in DUD-E. Models could distinguish actives from decoys based on the biased feature patterns rather than true binding affinity predictions [52].
Table 1: Impact of Data Bias on Deep Learning Model Performance in Virtual Screening
| Bias Type | Definition | Effect on Model Performance | Experimental Finding |
|---|---|---|---|
| Analog Bias | Over-representation of structural analogues in the active compound set. | Inflates performance by allowing model to "memorize" common scaffolds. | Model performance dropped when tested on scaffolds not represented in the training data [52]. |
| Decoy Bias | Decoys are topologically dissimilar to actives but easily distinguishable by simple chemical descriptors. | Makes discrimination a trivial task, not reflective of real-world screening. | Models distinguished actives from decoys based on selection criteria artifacts, not binding physics [52]. |
| Artificial Enrichment Bias | Bias introduced when decoys do not adequately match the physicochemical properties of actives. | Leads to over-optimistic enrichment factors. | Newer benchmarks (MUBDsyn) controlling for this bias provide a more realistic performance assessment [53]. |
Library Design as a Source of Bias
The selection of decoy molecules is a critical and often overlooked aspect of LBVS validation. The ideal decoy set should be "hard to distinguish"—meaning the decoys should possess similar physicochemical properties (e.g., molecular weight, logP, number of hydrogen bond donors/acceptors) to the actives, but be topologically dissimilar and experimentally confirmed or highly likely to be inactive. Flaws in this process can introduce decoy bias, which severely compromises the validity of a benchmarking exercise.
The DUD-E Case Study and the Evolution of Benchmarks
The DUD-E dataset was constructed with the explicit goal of providing a rigorous benchmark. Its decoys were selected to be physicochemically similar to actives but topologically dissimilar [52]. However, this very design principle introduced a systematic bias. Machine learning models, particularly deep learning models, excel at finding patterns and can exploit the subtle, consistent differences in topological descriptors between actives and decoys. Consequently, a model may appear highly accurate by learning the "signature" of the decoy set rather than the signature of bioactivity [52]. This has spurred the development of next-generation benchmarks with more sophisticated decoy selection strategies.
Experimental Protocol for Next-Generation Benchmark (MUBDsyn) Validation:
- Objective: To develop a benchmark with reduced artificial enrichment, analogue, and domain bias using synthetic decoys [53].
- Methodology:
- Decoy Generation: Deep reinforcement learning (using REINVENT) was leveraged to generate synthetic decoys. The model's objective was customized to incorporate debiasing algorithms from the Maximal Unbiased Benchmarking Datasets (MUBD).
- Multi-Objective Optimization: The scoring function balanced multiple criteria to ensure decoys were physicochemically matched yet topologically challenging to distinguish from actives.
- Validation: The resulting benchmark, MUBDsyn, was compared to DUD-E, DeepCoy, and others on metrics like molecular docking and fingerprint-based similarity search.
- Results: MUBDsyn demonstrated superior control over domain bias, artificial enrichment bias, and analogue bias. Assessments of machine learning models based on MUBDsyn were less affected by data clumping, providing a more challenging and realistic setting for benchmarking, especially for deep learning models [53].
Methodological Solutions and Advanced Workflows
Combating bias in LBVS requires a multi-pronged approach, from using better data to implementing more robust computational workflows.
Strategies for Mitigating Bias
- Use of Unbiased Benchmarks: Prioritize benchmarks designed to minimize known biases, such as MUBD and its successor MUBDsyn, which use advanced algorithms to generate well-controlled synthetic decoys [53].
- Hybrid LB/SB Workflows: Integrate LBVS with Structure-Based (SB) methods like docking to cross-validate results. A consensus approach reduces reliance on a single, potentially biased method [21] [18].
- Reinforcement Learning for Decoy Generation: Employ deep reinforcement learning models, like REINVENT, for objective-oriented decoy generation. This shifts from chemical library-based screening to a generation strategy that directly optimizes for unbiased molecular features [53].
- Sequential and Parallel Screening Designs:
- Sequential: Use fast LBVS to filter large libraries, then apply more computationally expensive SB methods to the enriched subset. This conserves resources while adding a orthogonal validation step [21] [18].
- Parallel: Run LBVS and SBVS independently and combine results using consensus scoring. This increases the likelihood of identifying true actives and mitigates the limitations inherent to each method alone [18].
The following diagram illustrates a robust hybrid workflow that leverages both LB and SB techniques to control for bias and improve hit identification confidence.
Table 2: Key Research Reagents and Computational Tools for Unbiased LBVS
| Item / Resource | Type | Primary Function in Bias Mitigation |
|---|---|---|
| MUBDsyn Benchmark [53] | Computational Dataset | Provides a benchmark with synthetic decoys generated via reinforcement learning to minimize analogue and artificial enrichment biases. |
| REINVENT [53] | Software (Generative Model) | A deep reinforcement learning framework used for objective-oriented generation of unbiased decoy molecules. |
| Knowledge Graph [54] | Data Resource | Integrates diverse biomedical data to provide a broad, unbiased representation of biological knowledge for target and ligand identification. |
| DUD-E Dataset [52] | Computational Dataset | A widely used but cautionary benchmark; understanding its biases is essential for proper experimental design and interpretation. |
| QuanSA [18] | Software (Ligand-Based) | A 3D-QSAR method that constructs interpretable binding-site models, helping to move beyond simple pattern matching of analogues. |
The perils of analog bias and flawed library design present significant challenges to the validity of LBVS. As the field advances with more sophisticated machine learning models, the adage "garbage in, garbage out" becomes ever more critical. The reliance on biased benchmarks like DUD-E has been shown to misleadingly inflate performance metrics, creating a gap between retrospective validation and prospective success. The path forward requires a concerted shift towards rigorously designed, unbiased benchmarking datasets like MUBDsyn and the adoption of hybrid workflows that leverage the complementary strengths of LB and SB methods. By prioritizing strategies that explicitly control for analog and decoy bias, researchers can ensure their virtual screening campaigns are built on a foundation of robust validation, ultimately increasing the likelihood of discovering truly novel and effective therapeutic compounds.
In the relentless pursuit of new therapeutics, virtual screening (VS) stands as a critical computational technique for identifying promising hit compounds from vast chemical libraries. The field primarily leverages two methodological paradigms: structure-based virtual screening (SBVS), which utilizes the three-dimensional structure of the target protein to dock and score compounds, and ligand-based virtual screening (LBVS), which leverages known active ligands to identify new hits based on similarity or pharmacophoric features [4] [18]. Individually, each approach possesses intrinsic strengths and flaws; SBVS can provide atomic-level interaction insights but is computationally expensive and relies on the availability of high-quality protein structures, while LBVS is computationally efficient and does not require a protein structure but may lack novelty and struggle with scaffold hopping [4] [18].
The burgeoning availability of ultra-large chemical libraries, containing billions of synthesizable compounds, has intensified the challenge of achieving both high throughput and high accuracy [22]. This context validates the central thesis of modern virtual screening research: that a strategic combination of LBVS and SBVS methods mitigates their individual limitations and delivers superior performance compared to any single approach [4] [18]. By leveraging their complementary nature, researchers can achieve a more robust and reliable hit identification process. This guide objectively compares the performance of the three principal combined workflows—sequential, parallel, and hybrid—providing drug development professionals with the experimental data and protocols needed to inform their screening strategy.
Unveiling the Combined Workflow Strategies
Combined virtual screening strategies can be classified into three distinct architectures, each with a specific operational logic and integration methodology.
Sequential Workflows: The Funnel Strategy
The sequential combination is a funnel-based strategy that applies LBVS and SBVS in consecutive steps to filter large compound libraries in a computationally economic manner [4]. This workflow adheres to single-objective optimization, where an initial, faster method (often LBVS) rapidly reduces the chemical space, and a subsequent, more precise method (often SBVS) refines the top candidates [18]. For instance, a typical protocol might involve using a rapid ligand-based pharmacophore screen to narrow a library of millions of compounds to a few thousand, which are then subjected to more computationally intensive molecular docking [18].
The primary advantage of this approach is its efficiency in managing computational resources. However, a significant challenge is that if the initial filtering step uses criteria incompatible with the subsequent step, it may inadvertently exclude true positive hits, potentially generating false negatives [4].
Parallel Workflows: The Consensus Strategy
Parallel workflows involve running LBVS and SBVS independently and simultaneously on the same compound library [4] [18]. Each method generates its own ranked list of compounds, and the results are subsequently integrated using a data fusion or consensus scoring framework. This strategy offers two main paths for final candidate selection:
- Parallel Scoring: Selecting top-ranking candidates from each list without forcing a consensus. This approach maximizes the breadth of identified hits and helps mitigate the inherent limitations of each method, reducing the chance of missing promising compounds [18].
- Hybrid (Consensus) Scoring: Creating a single, unified ranking by combining the scores from both methods, for instance, through multiplicative or averaging strategies. This approach prioritizes compounds that rank highly across both methods, thereby increasing confidence in the selection of true positives, albeit potentially at the cost of chemical diversity [18].
The major challenge in parallel workflows lies in the data fusion algorithm, which must normalize the heterogeneous scoring data from different methods, often with varying units, scales, and offsets [4].
Hybrid Workflows: Unified Models
The hybrid combination aims to integrate ligand-based and structure-based techniques into a single, unified framework from the outset, leveraging their synergistic effects directly within the model [4]. This can be achieved through interaction-based methods that use interaction fingerprints to inform the screening process, or by developing standalone models that are trained on both protein structure and ligand information simultaneously [4]. This strategy represents the most deeply integrated approach, moving beyond simple sequential or parallel layering of distinct methods.
Table 1: Comparison of Combined Virtual Screening Workflow Types
| Workflow Type | Operational Logic | Key Advantage | Primary Challenge |
|---|---|---|---|
| Sequential | Consecutive filtering steps [4] | Computational economic benefits; efficient resource management [4] [18] | Risk of discarding true positives early; single-objective optimization [4] |
| Parallel | Independent simultaneous runs with fused results [4] [18] | Mitigates limitations of individual methods; increases hit breadth or confidence [18] | Data fusion complexity; normalizing heterogeneous scores [4] |
| Hybrid | Deep integration into a unified model [4] | Leverages synergistic effects directly; can cancel out prediction errors [4] [18] | Higher development complexity; requires sophisticated model design [4] |
Performance Comparison and Experimental Data
Quantitative benchmarking and real-world case studies demonstrate the tangible benefits of employing combined and consensus strategies.
Quantitative Benchmarking of Workflow Performance
Platforms that implement multi-stage, combined workflows consistently show superior performance in identifying active compounds. For example, the HelixVS platform, which integrates classical docking with a deep learning-based affinity scoring model, demonstrated a significant improvement over using molecular docking alone. On the standard DUD-E benchmark dataset, HelixVS achieved an Enrichment Factor at 1% (EF1%) of 26.968, compared to 10.022 for Autodock Vina, meaning it found 159% more active molecules [25]. Similarly, the RosettaVS method, which combines physics-based force fields with a model for entropy changes, achieved a top 1% enrichment factor (EF1%) of 16.72 on the CASF-2016 benchmark, outperforming the second-best method (EF1% = 11.9) by a significant margin [22].
Case Study Evidence and Hit Rates
Evidence from successful drug discovery campaigns further validates the power of consensus. In a collaboration between Optibrium and Bristol Myers Squibb to optimize LFA-1 inhibitors, a hybrid model that averaged predictions from a ligand-based method (QuanSA) and a structure-based method (FEP+) performed better than either method alone. The hybrid model achieved a lower mean unsigned error (MUE), demonstrating that the partial cancellation of errors between the two methods led to more accurate affinity predictions [18].
Furthermore, platforms deployed in real-world screening campaigns show impressive results. The RosettaVS-based OpenVS platform was used to screen multi-billion compound libraries against two unrelated targets, KLHDC2 and NaV1.7. The campaign discovered hits for both targets, achieving a 44% hit rate for NaV1.7 and a 14% hit rate for KLHDC2, with all hits exhibiting single-digit micromolar binding affinity—all completed in less than seven days [22]. Similarly, HelixVS consistently identified active compounds with low micromolar or even nanomolar activity in multiple drug development projects, with over 10% of the molecules tested in wet labs demonstrating activity [25].
Table 2: Experimental Performance Metrics of Modern Virtual Screening Platforms
| Platform / Method | Benchmark / Application | Key Performance Metric | Result | Comparative Baseline (Result) |
|---|---|---|---|---|
| HelixVS [25] | DUD-E Dataset | EF1% | 26.968 | Vina (10.022) |
| HelixVS [25] | DUD-E Dataset | Screening Speed (molecules/day/core) | >300 | Vina (~300) |
| RosettaVS [22] | CASF-2016 Dataset | EF1% | 16.72 | Second-best method (11.9) |
| OpenVS (with RosettaVS) [22] | NaV1.7 Target (Wet-Lab) | Hit Rate | 44% | N/A |
| Hybrid (QuanSA + FEP+) [18] | LFA-1 Inhibitors (Prediction) | Mean Unsigned Error (MUE) | Significant Reduction | Individual methods (Higher MUE) |
Essential Workflows and Methodologies
This section details the standard experimental protocols and the underlying logic of the combined workflows.
Detailed Experimental Protocols
Protocol 1: Sequential Screening for Library Enrichment
- Library Preparation: Prepare a database of small molecule compounds in a suitable format (e.g., SDF, MOL2), ensuring correct protonation states and generating plausible 3D conformations [25] [32].
- Ligand-Based Pre-filtering: Apply a rapid LBVS method. This could be:
- Pharmacophore Screening: Screen the library against a pharmacophore model built from known active ligands to identify compounds matching essential features [18].
- Similarity Search: Use molecular fingerprinting (e.g., ECFP4) to calculate Tanimoto similarity against known actives and retain top-ranked compounds [4].
- Structure-Based Docking: Take the top 1-5% of compounds from step 2 and dock them into the defined binding site of the target protein using a docking program like AutoDock Vina or QuickVina [25] [32].
- Pose Scoring and Ranking: Score the generated docking poses using a more accurate, potentially deep learning-enhanced scoring function (e.g., RTMscore in HelixVS) to predict binding affinity and re-rank the candidates [25].
- Binding Mode Filtering (Optional): Apply filters based on pre-defined binding mode criteria, such as required interactions with specific amino acid residues, to further refine the list [25].
- Cluster and Select: Cluster the top-scoring compounds based on structural similarity and select representative molecules to ensure diversity for experimental validation [25].
Protocol 2: Parallel Screening with Consensus Scoring
- Parallel Independent Runs: Execute LBVS (e.g., using a tool like ROCS or a QuanSA model) and SBVS (e.g., using molecular docking with Vina or Glide) on the same compound library simultaneously and independently [18].
- Ranking List Generation: Generate two independent ranked lists from the LBVS and SBVS runs.
- Data Normalization: Normalize the scores from the two different methods to address variations in units, scales, and offsets. Common algorithms include rank-based normalization or Z-score standardization [4].
- Consensus Scoring: Combine the normalized scores to create a unified ranking. This can be a simple average, a weighted sum based on method confidence, or a multiplicative score [18].
- Hit Selection: Select the top-ranked compounds from the consensus list for experimental testing.
Workflow Logic and Signaling Pathways
The logical relationship between the different workflow strategies and their decision points can be visualized as follows:
Diagram 1: Logical flow of sequential, parallel, and hybrid virtual screening workflows.
The Scientist's Toolkit: Essential Research Reagents and Solutions
A successful virtual screening campaign relies on a suite of software tools and computational resources. The table below details key solutions used in the featured experiments and the broader field.
Table 3: Key Research Reagent Solutions for Virtual Screening
| Tool / Resource Name | Type / Category | Primary Function in Workflow | Notable Features / Applications |
|---|---|---|---|
| AutoDock Vina/QuickVina [25] [22] | Docking Tool (SBVS) | Predicts ligand binding modes and scores affinity using an empirical scoring function. | Widely used, open-source; balanced speed and accuracy. QuickVina offers faster screening [25]. |
| Glide (Schrödinger) [22] | Docking Tool (SBVS) | High-accuracy molecular docking for pose prediction and scoring. | Often used for final ranking; known for high enrichment but is commercial software [22]. |
| ROCS [18] | Shape-Based Similarity (LBVS) | Rapid 3D ligand-based screening by aligning and comparing molecular shapes and chemistry. | Excellent for scaffold hopping and identifying diverse hits with similar pharmacophores [18]. |
| QuanSA (Optibrium) [18] | 3D-QSAR Model (LBVS) | Constructs interpretable binding-site models from ligand data to predict affinity and pose. | Provides quantitative affinity predictions, useful for lead optimization [18]. |
| HelixVS [25] | Integrated VS Platform | Multi-stage screening platform combining classical docking with deep learning scoring. | High enrichment (EF) and throughput; demonstrated success in real drug discovery pipelines [25]. |
| RosettaVS/OpenVS [22] | Integrated VS Platform | Physics-based docking and scoring protocol that models receptor flexibility. | State-of-the-art enrichment factors; open-source platform for ultra-large library screening [22]. |
| AlphaFold Models [4] [18] | Protein Structure Resource | Provides predicted protein structures when experimental structures are unavailable. | Expanded structural coverage; requires careful refinement for docking success [18]. |
The experimental data and performance comparisons presented in this guide unequivocally demonstrate that combined and consensus strategies represent a powerful evolution in virtual screening methodology. While standalone SBVS and LBVS methods have their place, the integration of these approaches through sequential, parallel, or hybrid workflows consistently yields higher enrichment factors, improved hit rates, and more accurate affinity predictions. The choice of the optimal strategy depends on the specific project goals, available computational resources, and the nature of the target. However, the overarching conclusion is clear: leveraging the synergistic power of combined strategies is no longer just an option but a necessity for efficient and effective hit discovery in the modern era of drug development, characterized by ultra-large chemical libraries and increasingly challenging therapeutic targets.
Virtual screening is a cornerstone of modern drug discovery, enabling researchers to identify promising candidate molecules from vast chemical libraries before costly experimental testing. The two primary computational strategies are structure-based virtual screening (SBVS), which uses the 3D structure of a protein target to dock and score ligands, and ligand-based virtual screening (LBVS), which identifies novel compounds based on their similarity to known active molecules [55]. While powerful, both approaches face a critical challenge: the exponential growth of virtual libraries, now often exceeding billions of molecules, makes exhaustive computational screening prohibitively expensive and time-consuming [56]. This resource bottleneck necessitates more intelligent screening strategies.
Active learning (AL), a goal-driven machine learning methodology, has emerged as a transformative solution for this "needle in a haystack" problem [57] [58]. By iteratively selecting the most informative molecules for evaluation, active learning guides the search towards promising regions of the chemical space, dramatically reducing the number of computations required. This guide provides a comparative analysis of how active learning and hierarchical screening protocols are being applied to optimize computational resources in drug discovery, offering objective performance data and detailed experimental frameworks for researchers.
Core Principles: Active Learning and Bayesian Optimization
The Goal-Driven Learning Framework
Active learning is an adaptive sampling technique that functions as a "goal-driven learner." In the context of virtual screening, its goal is to find molecules with optimal binding affinity (the objective function) with as few computational evaluations as possible [58] [59]. The core cycle involves:
- Initial Sampling: A small, often random, subset of the chemical library is evaluated using a high-fidelity but expensive method (e.g., molecular docking, free energy calculations).
- Surrogate Model Training: A fast, machine-learning model (the surrogate) is trained to predict the performance of unevaluated molecules based on the initial data.
- Informed Selection: An acquisition function uses the surrogate's predictions to select the next batch of molecules for evaluation, balancing the exploration of uncertain regions with the exploitation of currently known promising areas.
- Iterative Refinement: The new data is used to update the surrogate model, and the cycle repeats until a stopping criterion is met, such as a target number of top molecules identified or a computational budget exhausted [56] [57].
This process is formally synonymous with Bayesian Optimization (BO), where the acquisition function is a Bayesian infill criterion that quantifies the utility of evaluating a candidate [58] [59].
Hierarchical Screening as an Implementation of Active Learning
Hierarchical screening is a practical implementation of the active learning principle, often using a tiered workflow with increasing computational cost and accuracy at each level [57]. A typical hierarchy might start with fast machine learning or docking for ultra-large library filtering, proceed to more accurate docking with protein flexibility, and finally, use highly accurate but expensive molecular dynamics (MD) simulations or free energy perturbation for a small, refined candidate set.
Table 1: Tiered Computational Methods in a Hierarchical Screening Workflow
| Tier | Computational Method | Typical Library Size | Relative Speed | Typical Use Case |
|---|---|---|---|---|
| 1 | Ligand-Based ML Models, 2D Fingerprint Similarity | 1 Million - 1 Billion+ | Very Fast | Initial library pre-filtering, removing undesirable compounds |
| 2 | Structure-Based Docking (e.g., Vina, Glide-SP) | 100,000 - 10 Million | Fast | Initial structure-based hit identification |
| 3 | Advanced Docking (Ensemble Docking, MM-GB/PBSA) | 1,000 - 100,000 | Medium | Re-scoring top hits, accounting for limited flexibility |
| 4 | Molecular Dynamics (MD) & Free Energy Calculations | 10 - 1,000 | Slow | Final validation and affinity ranking of top candidates |
Figure 1: A Hierarchical Screening Workflow. This multi-stage process efficiently filters large chemical libraries, using faster, less accurate methods in early tiers and reserving high-fidelity computations for the most promising candidates.
Comparative Performance Analysis of Active Learning Strategies
The efficacy of active learning is not universal; it depends on the choice of surrogate model, acquisition function, and the specific virtual screening task. The following data, compiled from recent literature, provides a quantitative comparison of different AL strategies against traditional brute-force screening.
Performance in Structure-Based Virtual Screening
A landmark study by Graff et al. systematically evaluated AL components for docking-based screening. Using a library of 100 million molecules, they demonstrated that a directed-message passing neural network (D-MPNN) with an Upper Confidence Bound (UCB) acquisition strategy could identify 94.8% of the top-50,000 scoring ligands after evaluating only 2.4% of the library—a massive computational saving [56].
Table 2: Performance of Active Learning Models on a 10,560-Molecule Docking Library (Enamine 10k)
| Surrogate Model | Acquisition Function | % of Top-100 Hits Found (after 6% evaluation) | Enrichment Factor (EF) vs. Random |
|---|---|---|---|
| Random Forest (RF) | Greedy | 51.6% ± 5.9 | 9.2 |
| Random Forest (RF) | Upper Confidence Bound (UCB) | 43.2% ± 3.5 | 7.7 |
| Feedforward Neural Network (NN) | Greedy | 66.8% ± 1.6 | 11.9 |
| Message Passing Neural Network (MPN) | Greedy | 65.3% ± 4.9 | 11.6 |
The table shows that neural network-based models (NN and MPN) consistently outperform the random forest model. The "Greedy" strategy, which selects molecules with the best-predicted score, often performed well, but UCB can provide a better balance in other contexts, helping to avoid local optima [56].
Case Study: Active Learning for Antibody Optimization
Furui and Ohue developed an AL workflow to optimize antibody binding affinity for HER2-binding Trastuzumab mutants. Their method used the RDE-Network deep learning model as a surrogate for the more computationally expensive Rosetta Flex ddG energy function. Over six active learning cycles, selecting only 1,200 mutants, their approach significantly improved screening performance over random selection and successfully identified mutants with better binding properties, even without initial experimental data [60]. This demonstrates AL's power in biologics design, where high-fidelity simulations are exceptionally costly.
Case Study: Combining MD and AL for Coronavirus Inhibition
Elez et al. developed a powerful framework integrating molecular dynamics (MD) and active learning to identify a broad coronavirus inhibitor. Their approach used two key components: a receptor ensemble from MD simulations to account for protein flexibility and a target-specific scoring function. The AL cycle reduced the number of compounds needing experimental testing to less than 10 and cut computational costs by ~29-fold compared to a brute-force approach. This led to the discovery of a potent nanomolar inhibitor of TMPRSS2, validated in cell-based assays to block SARS-CoV-2 entry [57]. This success highlights the synergy between high-fidelity simulation and intelligent sampling.
Experimental Protocols for Key Studies
Protocol: Accelerated Docking with Bayesian Optimization
The following protocol is adapted from Graff et al. [56] for implementing active learning in a docking campaign.
- Objective: Identify top-scoring ligands from a large virtual library with minimal docking simulations.
- Software: MolPAL.
- Virtual Library: ZINC, Enamine, or other (107 to 109 compounds).
- Docking Software: AutoDock Vina, Glide, or others.
- Surrogate Models Tested: Random Forest (on fingerprints), Feedforward Neural Network (on fingerprints), Directed-Message Passing Neural Network (D-MPNN).
- Acquisition Functions Tested: Greedy, Upper Confidence Bound (UCB), Thompson Sampling, Expected Improvement.
- Procedure:
- Initialization: Randomly select and dock an initial batch of 0.1% - 1% of the total library.
- AL Loop: For a fixed number of cycles or until a performance target is met:
- Train the chosen surrogate model on all accumulated docking data.
- Use the acquisition function to select the next batch (e.g., 1% of the library) of unevaluated molecules predicted to be most valuable.
- Dock the selected batch and add the results to the training data.
- Validation: Compare the final list of top-ranked molecules identified by the AL process against the top molecules found from exhaustive docking (if available) or through subsequent experimental validation.
Protocol: Target-Specific Active Learning with Molecular Dynamics
This protocol is based on the work of Elez et al. that discovered a TMPRSS2 inhibitor [57].
- Objective: Identify potent inhibitors by integrating MD simulations and active learning.
- Software: Custom MD/AL framework.
- Target Protein: TMPRSS2 (method is generalizable).
- Libraries Screened: DrugBank, NCATS in-house library.
- Key Components:
- Receptor Ensemble: Generate an ensemble of 20 protein conformations from a multi-microsecond MD simulation of the apo (ligand-free) protein.
- Target-Specific Score ("h-score"): An empirical function that rewards occlusion of the target's active site (S1 pocket) and key interaction motifs, going beyond standard docking scores.
- Procedure:
- Initialization: Dock and score 1% of the library against each structure in the receptor ensemble.
- AL Loop:
- Train a surrogate model (e.g., Random Forest) on the accumulated score data.
- Use the model to rank all unscreened compounds.
- Select the top-ranked compounds for the next round of docking and scoring against the receptor ensemble.
- Validation: Experimentally test the top-ranking final candidates (e.g., IC50 measurement, cell-based entry assays).
The Scientist's Toolkit: Essential Research Reagents and Solutions
Table 3: Key Software and Computational Tools for Active Learning in Virtual Screening
| Tool Name / Category | Function / Purpose | Application Context |
|---|---|---|
| MolPAL | A specialized software package for molecular pool-based active learning. | Accelerating large-scale docking campaigns [56]. |
| D-MPNN (Directed Message Passing Neural Network) | A graph-based neural network architecture that learns directly from molecular structure. | High-performance surrogate model for predicting molecular properties [56]. |
| GLIDE | A widely used molecular docking software. | High-throughput structure-based virtual screening and pose generation [55]. |
| AutoDock Vina | A popular open-source docking program. | Fast, accessible docking for initial screening [56]. |
| Rosetta Flex ddG | An energy function-based method for predicting binding affinity changes upon mutation. | High-accuracy but computationally expensive evaluation in antibody/protein optimization [60]. |
| Receptor Ensembles (from MD) | A collection of protein snapshots capturing flexible states. | Improving docking accuracy by accounting for protein flexibility [57]. |
| Target-Specific Scoring Functions | Custom empirical or machine-learned scores tailored to a protein's active site. | More accurate ranking of inhibitors than generic docking scores [57]. |
Figure 2: The Core Active Learning Cycle for Virtual Screening. This iterative process lies at the heart of efficient resource allocation, dynamically guiding the selection of molecules for expensive evaluation based on a continuously updated model.
The integration of active learning and hierarchical screening represents a paradigm shift in computational drug discovery. Objective performance data consistently shows that these strategies can reduce computational costs by over an order of magnitude while recovering the vast majority of top-performing candidates that would be identified by brute-force methods [56] [57]. The choice between structure-based and ligand-based approaches is no longer a rigid dichotomy; instead, the most efficient pipelines intelligently combine both within an active learning framework, using fast ligand-based models for initial filtering and more expensive structure-based methods for refined evaluation.
The future of optimized virtual screening lies in the development and adoption of more sophisticated, target-aware surrogate models and acquisition functions, as demonstrated by the success of target-specific scores and reinforcement learning-driven policies like GLARE [61]. As these methodologies mature, they will further democratize large-scale virtual screening, making it accessible for a wider range of targets and academic institutions, and ultimately accelerating the discovery of new therapeutics.
In the rigorous field of computational drug discovery, virtual screening (VS) stands as a pivotal technique for identifying promising hit compounds from vast chemical libraries. While much attention is given to the algorithmic prowess of docking programs and machine learning models, the success of any virtual screening campaign is fundamentally dictated by a less glamorous, yet critical, preliminary phase: data preparation and curation. This foundation-building process, often overlooked in methodological comparisons, systematically controls the quality and reliability of all subsequent computational analyses. The meticulous preparation of both target structures and compound libraries establishes the essential conditions for achieving meaningful virtual screening results, directly influencing the accuracy of binding pose prediction and the effective ranking of potential ligands.
The critical importance of data curation becomes particularly evident when framing research within the broader thesis of validating structure-based versus ligand-based virtual screening approaches. Structure-based virtual screening (SBVS) leverages the three-dimensional structure of the target protein, typically using molecular docking to predict how small molecules interact with the binding site [28] [5]. In contrast, ligand-based virtual screening (LBVS) relies on the principle of molecular similarity, identifying new candidates based on their structural or physicochemical resemblance to known active compounds, without requiring target structure information [18] [5]. Each paradigm imposes distinct, critical demands on data preparation, and the quality of this initial curation directly determines the validity of any subsequent performance comparison between these methodologies.
Core Methodologies and Their Data Prerequisites
Structure-Based Virtual Screening (SBVS) Workflows
SBVS requires high-quality structural data of the biological target, obtained through experimental methods like X-ray crystallography or cryo-electron microscopy, or generated computationally via homology modeling tools such as AlphaFold [18] [22]. A standard SBVS pipeline involves docking each compound from a library into a defined binding site on the target protein. The scoring function then evaluates and ranks these compounds based on their predicted complementarity and binding affinity [28] [22].
The docking and scoring process is computationally intensive, making careful pre-filtering of the compound library a vital curation step to conserve resources. Common pre-processing strategies include applying physicochemical filters (e.g., Lipinski's Rule of Five) to ensure drug-likeness and employing pharmacophore models to select compounds that match key interaction features observed in the target's binding site [28]. Furthermore, accounting for target flexibility remains a significant challenge. Techniques like ensemble docking, which uses multiple protein conformations, have emerged as a partial solution to model conformational changes that occur upon ligand binding [28].
Ligand-Based Virtual Screening (LBVS) Workflows
LBVS methodologies depend entirely on the availability and quality of known active ligands. These approaches are powerful when the 3D structure of the target is unavailable. They operate by comparing molecules in a screening library to one or more reference active compounds using molecular descriptors [5].
These descriptors can be:
- 1D/2D Descriptors: Encoding chemical identity and topological features.
- 3D Descriptors: Capturing molecular shape, volume, and electrostatic fields [5].
Advanced LBVS methods, such as Quantitative Surface-field Analysis (QuanSA), can even construct predictive, interpretable models of the binding site using ligand structure and affinity data through multiple-instance machine learning [18]. The primary strength of LBVS lies in its computational efficiency, making it exceptionally well-suited for the rapid prioritization of very large, chemically diverse libraries [18].
The Emerging Hybrid Paradigm
Recognizing the complementary strengths of SBVS and LBVS, hybrid strategies have gained prominence for enhancing the reliability of virtual screening outcomes [18] [5]. These integrated workflows can be implemented in different configurations:
- Sequential Integration: A computationally efficient LBVS method (e.g., similarity search or pharmacophore filtering) is first used to narrow down a massive library. The resulting, more focused subset of compounds is then subjected to a more rigorous, computationally expensive SBVS analysis [18] [5]. This approach optimally conserves computational resources.
- Parallel Screening: Both LBVS and SBVS are run independently on the same compound library. Their results are then combined, either by selecting top-ranked candidates from both lists to maximize hit recovery, or by creating a consensus ranking to increase confidence in the final selection [18]. This strategy helps mitigate the inherent limitations and biases of each individual method.
Table 1: Comparison of Virtual Screening Methodologies
| Feature | Structure-Based (SBVS) | Ligand-Based (LBVS) | Hybrid Approach |
|---|---|---|---|
| Primary Data Input | 3D Protein Structure | Known Active Ligands | Both protein structure and active ligands |
| Key Techniques | Molecular Docking, Scoring Functions | Molecular Similarity, Pharmacophore Modeling | Combined filtering, parallel screening, consensus scoring |
| Computational Cost | High | Low to Moderate | Moderate to High |
| Key Challenges | Scoring accuracy, target flexibility, role of water molecules | Bias towards known chemotypes, template selection | Integrating data types, workflow complexity |
| Best Application | Detailed interaction analysis; novel scaffold discovery | Rapid screening of ultra-large libraries; when no structure is available | Increasing confidence in hits; balancing diversity and precision |
Experimental Benchmarking: Data Curation as a Performance Driver
The profound impact of rigorous data preparation on virtual screening outcomes is clearly demonstrated in controlled benchmarking studies. These studies utilize curated datasets to objectively evaluate the performance of different algorithms and workflows, with the quality of the underlying data being a critical factor in the validity of the results.
A landmark study developed RosettaVS, a highly accurate SBVS method that incorporates receptor flexibility. When benchmarked on the standard CASF-2016 dataset, its scoring function, RosettaGenFF-VS, achieved a top 1% enrichment factor (EF1%) of 16.72, significantly outperforming other physics-based methods [22]. This highlights how advanced scoring functions, which depend on well-curated training data, can drive superior performance. Further validation on the Directory of Useful Decoys (DUD) dataset confirmed the method's robust virtual screening capabilities [22].
In another comprehensive benchmark focusing on anti-malarial drug discovery, researchers evaluated docking tools against both wild-type and quadruple-mutant Plasmodium falciparum dihydrofolate reductase (PfDHFR). The study revealed that re-scoring initial docking poses with machine learning-based scoring functions dramatically improved outcomes. For the wild-type enzyme, PLANTS docking combined with CNN-Score re-scoring achieved an exceptional EF1% of 28. For the resistant quadruple mutant, FRED docking with CNN-Score re-scoring yielded an even higher EF1% of 31 [23]. These results underscore that a well-curated pipeline, combining traditional docking with machine learning re-scoring, can effectively address challenging scenarios like drug resistance.
The integration of deep learning into the screening workflow itself marks a significant advancement. The HelixVS platform employs a multi-stage process: initial docking with AutoDock QuickVina 2, followed by re-scoring poses with a deep learning model based on RTMscore, and finally optional binding-mode filtering. This curated multi-stage protocol, which relies on carefully prepared data at each step, achieved an average EF1% of 26.968 on the DUD-E dataset, a 159% improvement over using Vina alone, while also increasing screening speed by more than 10 times [25].
The relationship between docking scores and experimental hit rates has also been quantitatively modeled. Research shows that while screening billion-compound libraries can yield high hit rates, this success is contingent on effective pre-filtering of the library for molecules with appropriate properties (e.g., charge, hydrophobicity). This pre-filtering boosts the library's intrinsic hit-rate, which in turn dramatically enhances docking performance [39].
Table 2: Performance Metrics of Modern Virtual Screening Tools from Recent Studies
| Tool / Platform | Methodology | Key Benchmark | Reported Performance | Reference |
|---|---|---|---|---|
| RosettaVS | Physics-based docking with flexible receptor & improved scoring | CASF-2016 | EF1% = 16.72 (Top performer) | [22] |
| PLANTS + CNN-Score | Docking with ML re-scoring | PfDHFR (Wild-Type) | EF1% = 28 | [23] |
| FRED + CNN-Score | Docking with ML re-scoring | PfDHFR (Quadruple Mutant) | EF1% = 31 | [23] |
| HelixVS | Multi-stage (Docking + DL re-scoring) | DUD-E | EF1% = 26.968, >10x speedup | [25] |
| Vina | Classic physics-based docking | DUD-E | EF1% = 10.022 | [25] |
Successful virtual screening campaigns rely on a suite of well-curated data resources and software tools. The following table details key "research reagent solutions" essential for the data preparation and execution phases.
Table 3: Essential Research Reagent Solutions for Virtual Screening
| Resource Name | Type/Function | Key Utility in Data Preparation & Curation |
|---|---|---|
| ZINC | Public Compound Library | Provides access to over 13 million commercially available, synthesizable compounds in prepared, dockable formats. [28] |
| ChEMBL | Public Bioactivity Database | Curates bioactivity data for ~1 million compounds, essential for building ligand-based models and validation sets. [28] |
| AlphaFold | Protein Structure Prediction | Generates high-quality 3D protein models when experimental structures are unavailable, enabling SBVS for novel targets. [18] |
| DEKOIS 2.0 | Benchmarking Set | Provides pre-curated sets of active molecules and challenging decoys to objectively evaluate VS pipeline performance. [23] |
| OpenVS | Open-Source VS Platform | An AI-accelerated platform that integrates active learning to efficiently triage billions of compounds for docking. [22] |
| GLIDE | Commercial Docking Software | A high-performance docking program known for its accurate scoring function, often used as a benchmark. [22] [25] |
| AutoDock Vina | Open-Source Docking Software | A widely used, accessible docking tool that balances speed and accuracy, common in academic research. [22] [23] |
| ROCS | Ligand-Based Screening | Rapidly overlays and screens compounds based on 3D molecular shape and chemical features. [18] |
Integrated Workflow for Effective Virtual Screening
The following diagram synthesizes the principles of effective data preparation and methodology integration into a logical workflow for a robust virtual screening campaign. It emphasizes the critical, initial role of data curation and the complementary nature of structure-based and ligand-based methods.
Visual Workflow for Virtual Screening. This diagram outlines a decision-making workflow that prioritizes rigorous data input and curation as the foundational step for selecting the most appropriate virtual screening methodology.
Within the broader thesis of validating structure-based versus ligand-based virtual screening, it is unequivocally clear that the critical step of data preparation and curation is a primary determinant of success, yet it is frequently overlooked in methodological comparisons. The objective performance data from rigorous benchmarks demonstrates that no single method is universally superior; rather, the optimal approach is dictated by the quality and type of available input data.
The most robust and reliable outcomes consistently arise from hybrid frameworks that synergistically combine the target-structure insights of SBVS with the chemical-pattern recognition of LBVS. These workflows leverage meticulous data preparation at every stage—from initial library filtering and protein structure preparation to the final post-processing of hits with machine learning. As the field progresses with ultra-large libraries and advanced AI models, the principle remains foundational: the predictive power of any virtual screening campaign is inextricably linked to the rigor of its data curation. Therefore, elevating the standards of data preparation is not merely a technical detail but an essential prerequisite for generating validated, reproducible, and scientifically impactful results in computational drug discovery.
Benchmarks and Validation: Critically Assessing SBVS and LBVS Performance
In the field of computer-aided drug discovery, structure-based virtual screening (SBVS) has emerged as a pivotal technique for identifying novel bioactive compounds by computationally screening large chemical libraries against three-dimensional protein structures. The accuracy and reliability of SBVS methods depend critically on robust validation frameworks that can objectively assess their performance. Standardized benchmarking sets provide the essential "ground truth" required to evaluate, compare, and improve virtual screening methodologies in a systematic and reproducible manner. These benchmarks typically comprise known active compounds alongside carefully selected inactive molecules (decoys) for specific protein targets, enabling quantitative assessment of a method's ability to prioritize true binders over non-binders.
The development and adoption of standardized benchmarks have transformed the field of computational drug discovery by enabling direct comparison of diverse screening approaches across common testbeds. Benchmarks such as the Directory of Useful Decoys (DUD) and its enhanced version DUD-E, along with the Comparative Assessment of Scoring Functions (CASF) benchmark, have become cornerstone resources for methodological validation. These benchmarks address the critical need for objective performance assessment in virtual screening, where success is measured by a method's ability to achieve early enrichment of active compounds—a vital consideration when only a small fraction of a screening library can be tested experimentally.
Major Benchmarking Platforms and Databases
DUD-E Benchmark
The Directory of Useful Decoys-Enhanced (DUD-E) represents a significant advancement over its predecessor DUD, specifically designed to address biases in virtual screening benchmarks. DUD-E includes 102 protein targets with an average of 224 ligands per target and 50 decoys per ligand, totaling over 1.4 million compounds (22,886 actives and 1,411,214 decoys). The benchmark was constructed with careful attention to molecular properties, ensuring that decoys mirror the physical properties of active compounds (such as molecular weight and calculated log P) while being topologically dissimilar to minimize the risk of selecting false negatives. A ligand is considered active in DUD-E if its affinity (IC50, EC50, Ki, or Kd) is 1 μM or better, providing a consistent activity threshold across targets. [62] [63]
CASF Benchmark
The Comparative Assessment of Scoring Functions (CASF) benchmark, particularly the CASF-2016 version, provides a standardized platform specifically designed for evaluating scoring functions in structure-based drug design. The CASF-2016 benchmark consists of 285 diverse protein-ligand complexes carefully selected from the PDBbind database. Unlike DUD-E, which focuses on active/inactive classification, CASF provides multiple tests including "scoring power" (ability to predict binding affinities), "docking power" (ability to identify native binding poses), and "screening power" (ability to discriminate binders from non-binders). The benchmark provides all small molecule structures as decoys, effectively decoupling the scoring process from conformational sampling inherent in molecular docking. [22]
DEKOIS 2.0 Benchmark
DEKOIS 2.0 represents another important benchmarking resource that has been applied to rigorously evaluate SBVS performance across clinically relevant targets. This benchmark employs a protocol that creates challenging decoy sets with a 1:30 active-to-decoy ratio, ensuring that decoys are chemically diverse while matching physicochemical properties of actives. The DEKOIS 2.0 approach has been extended beyond its original 81 protein targets to various clinically important systems, including studies on wild-type and resistant variants of specific drug targets. [64]
Emerging Benchmarking Sets
Recent research has introduced new benchmarking approaches to address evolving challenges in virtual screening validation. The BayesBind benchmark was specifically developed for use with machine learning models, with targets taken from the validation and test sets of the BigBind dataset to prevent data leakage—a critical concern when evaluating ML-based approaches. This benchmark incorporates structurally dissimilar targets to those in the BigBind training set, enabling more rigorous validation of model generalizability to novel targets. [65]
Performance Comparison of Virtual Screening Methods
Docking Tools and Classical Scoring Functions
Comparative studies using standardized benchmarks have revealed significant variation in performance across popular virtual screening tools. A comprehensive benchmark of four popular docking programs (Gold, Glide, Surflex, and FlexX) using the DUD-E database demonstrated that performance is highly dependent on the evaluation metric and target characteristics. When assessed using the BEDROC metric with α = 80.5 (where the top 2% of ranked molecules account for 80% of the score), Glide achieved successful enrichment (score > 0.5) for 30 targets, Gold for 27, FlexX for 14, and Surflex for 11. The relative performance of these tools was found to depend on the early recognition requirement, with Glide showing particular strength in early enrichment scenarios (BEDROC with α = 321.9, focusing on the top 0.5% of ranked compounds). [62]
Table 1: Performance of Docking Programs on DUD-E Benchmark
| Docking Program | BEDROC (α=80.5) >0.5 | Early Recognition (α=321.9) | Late Stage (α=20.0) |
|---|---|---|---|
| Glide | 30 targets | Strong performance | Moderate performance |
| Gold | 27 targets | Moderate performance | Strong performance |
| FlexX | 14 targets | Weak performance | Weak performance |
| Surflex | 11 targets | Weak performance | Weak performance |
Importantly, these studies highlighted that benchmark performance can be influenced by subtle biases in the benchmark construction itself. When targets with potential biases were removed, leaving a subset of 47 targets, performance dropped dramatically for all programs: Glide succeeded for only 5 targets, Gold for 4, and FlexX and Surflex for 2 each. This underscores the importance of bias-aware benchmark construction and cautious interpretation of virtual screening benchmark results. [62]
Machine Learning Scoring Functions
Machine learning-based scoring functions have demonstrated remarkable performance improvements over classical approaches in virtual screening benchmarks. RF-Score-VS, a random forest-based scoring function trained on 15,426 active and 893,897 inactive molecules docked to 102 DUD-E targets, achieved substantial improvements in virtual screening performance compared to classical methods. In top 1% enrichment, RF-Score-VS provided a 55.6% hit rate, compared to 16.2% for AutoDock Vina. For more stringent early enrichment (top 0.1%), the difference was even more pronounced: RF-Score-VS achieved 88.6% hit rate versus 27.5% for Vina. [63]
Table 2: Performance Comparison of Classical vs Machine Learning Scoring Functions
| Scoring Function | Hit Rate at Top 1% | Hit Rate at Top 0.1% | Binding Affinity Prediction (Pearson Correlation) |
|---|---|---|---|
| RF-Score-VS | 55.6% | 88.6% | 0.56 |
| AutoDock Vina | 16.2% | 27.5% | -0.18 |
| Vinardo | 22.8% | 37.1% | 0.32 |
| Dense (Pose) | 32.1% | 67.3% | 0.61 |
Similar improvements have been observed with convolutional neural network-based scoring functions. CNN-Score showed hit rates three times greater than those of traditional scoring functions like Smina/Vina at the top 1% enrichment level. These machine learning approaches have demonstrated particular utility in re-scoring applications, where they refine initial docking poses and significantly improve the discrimination between active compounds and decoys. [64]
Advanced and Specialized Screening Approaches
Recent advancements in virtual screening methodologies have continued to push performance boundaries on standardized benchmarks. RosettaVS, a physics-based virtual screening method incorporating receptor flexibility and improved entropy modeling, demonstrated top-tier performance on the CASF-2016 benchmark. RosettaGenFF-VS, the scoring function underlying RosettaVS, achieved an enrichment factor of 16.72 at the top 1%, significantly outperforming the second-best method (EF1% = 11.9). The method also excelled in identifying the best binding small molecule within the top 1%, 5%, and 10% ranked molecules, surpassing all other comparative methods. [22]
Performance variations across different target classes have also been observed. Analysis of the RosettaVS method on various screening power subsets showed significant improvements in more polar, shallower, and smaller protein pockets compared to other methods, highlighting the importance of target-specific considerations in virtual screening method selection. [22]
Experimental Protocols and Validation Methodologies
Benchmark Construction Protocols
The construction of robust benchmarking sets follows carefully designed protocols to ensure fair and meaningful performance assessment. The DEKOIS 2.0 protocol, for instance, involves curating 40 bioactive molecules for a specific target and generating 1200 challenging decoys at a 1:30 active-to-decoy ratio. Decoys are selected to match physicochemical properties of actives while ensuring topological dissimilarity. Molecular preparation typically involves tools like Omega for generating multiple conformations for each ligand, which is particularly important for docking tools like FRED that require pre-generated conformer libraries. [64]
Protein structure preparation follows standardized workflows across different benchmarking studies. Typical protocols involve using tools like OpenEye's "Make Receptor" or similar preparation utilities to remove water molecules, unnecessary ions, and redundant chains; add and optimize hydrogen atoms; and define binding sites. The prepared structures are then saved in appropriate formats for docking calculations. [64]
Performance Evaluation Metrics
Virtual screening benchmarks employ multiple metrics to comprehensively assess method performance, each providing different insights into screening capabilities:
Enrichment Factor (EF): Measures the fraction of actives selected in the top χ% of compounds divided by the overall fraction of actives in the set. EFχ is easily interpreted as the success rate relative to random selection. Standard reporting typically includes EF1% and EF0.1% for early enrichment assessment. [65] [22]
BEDROC Score: A more comprehensive metric that considers the entire ranking while assigning higher weight to early enrichment. The parameter α controls the early recognition emphasis: α = 321.9 weights the top 0.5% of rankings, α = 80.5 focuses on the top 2%, and α = 20.0 emphasizes the top 8%. [62]
Bayes Enrichment Factor (EFB): A recently proposed metric that addresses limitations of traditional EF calculation. EFB compares the fraction of actives above a score threshold to the fraction of random molecules above the same threshold, eliminating dependence on the active-to-inactive ratio in the benchmark set and enabling more realistic estimation of performance on large screening libraries. [65]
ROC-AUC: The area under the receiver operating characteristic curve, providing an aggregate measure of classification performance across all thresholds. [63]
Virtual Screening Benchmark Workflow
Validation Strategies
Robust validation methodologies are essential for meaningful benchmark results. Cross-validation strategies are particularly important for machine learning approaches to prevent overfitting and ensure generalizability:
Per-Target Cross-Validation: Generates target-specific machine learning scoring functions, with each model created independently for a single protein target using only its active and decoy ligands. [63]
Horizontal Split Cross-Validation: Training and test sets contain data from all targets, simulating scenarios where docking is performed on targets with known ligands. [63]
Vertical Split Cross-Validation: Training and test sets contain completely different targets, representing the most challenging scenario where scoring functions must predict binding for targets with no known ligands. [63]
Strict separation of training and test data is crucial, especially for machine learning methods. Proper benchmark construction ensures that no protein-ligand complexes in the test set appear in the training data, preventing optimistic bias in performance estimates. [63]
Table 3: Key Research Reagents and Computational Tools for Virtual Screening Benchmarks
| Resource Category | Specific Tools | Primary Function | Application in Benchmarking |
|---|---|---|---|
| Benchmark Databases | DUD-E, CASF, DEKOIS 2.0 | Provide standardized active/decoy sets | Performance assessment across diverse targets |
| Docking Programs | AutoDock Vina, Gold, Glide, FRED, PLANTS | Generate protein-ligand binding poses | Pose generation and initial scoring |
| Machine Learning SFs | RF-Score-VS, CNN-Score | Re-score docking poses using ML models | Performance enhancement through re-scoring |
| Performance Metrics | EF, BEDROC, ROC-AUC, EFB | Quantify screening performance | Objective comparison of methods |
| Molecular Preparation | OpenEye Toolkits, Omega | Prepare protein and ligand structures | Pre-processing for docking calculations |
Current Challenges and Future Directions
Despite significant advances in virtual screening benchmarks, several challenges remain. The fundamental issue of decoy selection continues to be problematic, as it is difficult to ensure that decoys are truly inactive while maintaining chemical diversity. The recently proposed Bayes enrichment factor (EFB) addresses this by using random compounds from the same chemical space as actives instead of presumed inactives, eliminating a potential source of bias in benchmark construction. [65]
The rapid advancement of machine learning approaches introduces new challenges related to data leakage and proper dataset splitting. The BayesBind benchmark represents a step forward by providing targets structurally dissimilar to those in common training sets, enabling more realistic assessment of model generalizability. [65]
Another emerging direction is the benchmarking of methods against resistant mutant targets alongside wild-type proteins, as demonstrated in studies of PfDHFR variants. This approach provides valuable insights into method performance for clinically relevant scenarios where drug resistance is a major concern. [64]
Virtual Screening Method Comparison
As virtual screening continues to evolve, benchmarking methodologies must adapt to new challenges including ultra-large library screening, multi-target profiling, and incorporation of explicit solvent effects. The development of more rigorous benchmarks that better represent real-world screening scenarios will be crucial for advancing the field and improving the success rates of structure-based drug discovery.
Table of Contents
- Introduction to Virtual Screening Metrics
- Quantitative Comparison of Virtual Screening Performance
- Experimental Protocols for Metric Evaluation
- Visualizing Virtual Screening Workflows and Metric Relationships
- The Scientist's Toolkit: Essential Reagents and Resources
In the field of computer-aided drug discovery, virtual screening (VS) serves as a critical technique for identifying promising candidate molecules from extensive chemical libraries. The performance of VS approaches, broadly classified as structure-based (SBVS) or ligand-based (LBVS), must be rigorously evaluated using robust, quantitative metrics [7]. Retrospective benchmarking, which involves screening known active compounds alongside presumed inactives (decoys), is the standard method for this assessment [7] [66]. Among the myriad of available metrics, three have emerged as fundamental for a comprehensive performance review: the Area Under the Receiver Operating Characteristic Curve (AUC), the Enrichment Factor (EF), and Scaffold-Hopping Power. AUC provides a holistic view of a method's ability to discriminate between active and inactive compounds across all classification thresholds. In contrast, EF addresses the "early recognition problem," which is paramount in real-world applications where researchers can only afford to test a small fraction of top-ranked compounds [66]. Finally, scaffold-hopping power evaluates a method's ability to identify active compounds with novel chemical backbones, which is crucial for discovering new intellectual property and overcoming resistance [67] [68].
Quantitative Comparison of Virtual Screening Performance
The following tables consolidate performance data from various benchmarking studies, offering a comparative view of different VS tools and strategies.
Table 1: Performance of Docking Tools with Machine Learning Re-scoring on PfDHFR [23] This table showcases how combining classical docking with modern machine learning (ML) can enhance performance against a specific malaria target, including a drug-resistant variant.
| Target | Docking Tool | ML Re-scoring | Key Metric (EF 1%) | AUC |
|---|---|---|---|---|
| Wild-Type PfDHFR | PLANTS | CNN-Score | 28.0 | Not Specified |
| Wild-Type PfDHFR | AutoDock Vina | CNN-Score | Improved from worse-than-random | Not Specified |
| Quadruple-Mutant PfDHFR | FRED | CNN-Score | 31.0 | Not Specified |
Table 2: State-of-the-Art Virtual Screening Method Performance This table summarizes the performance of advanced methods on larger, standardized benchmarks, highlighting their general screening power.
| Method | Benchmark | Key Metric | Performance | Notes | Reference |
|---|---|---|---|---|---|
| RosettaVS (RosettaGenFF-VS) | CASF-2016 | EF 1% | 16.72 | Outperformed other physics-based methods | [22] |
| SHAFTS, LS-align, Phase Shape_Pharm, LIGSIFT | DUD-E & LIT-PCBA | Screening Power | Top Performers | Some academic tools outperformed commercial ROCS and Phase | [67] |
| 3D Molecular Similarity Tools | DUD-E & LIT-PCBA | Scaffold-Hopping Power | Considerable ability | Multiple conformers improved performance for most tools | [67] |
Table 3: Interpreting Key Virtual Screening Metrics A proper comparison requires a clear understanding of what each metric represents and its ideal value.
| Metric | Definition | Interpretation | Ideal Value |
|---|---|---|---|
| AUC (Area Under the ROC Curve) | The probability that a randomly chosen active compound will be ranked higher than a randomly chosen inactive compound [69]. | Measures overall ranking ability; insensitive to early enrichment. | 1.0 (Perfect) |
| EF (Enrichment Factor) | The fraction of actives found in a top percentage (e.g., 1%) of the screened list divided by the fraction expected from random selection [66]. | Directly measures early enrichment; highly relevant for practical screening. | Higher is better; >1 indicates enrichment over random. |
| Scaffold-Hopping Power | The ability of a VS method to retrieve active compounds that are structurally diverse and belong to different chemical scaffolds than the query [67]. | Indicates the potential for novel hit discovery. | N/A (Assessed via structural diversity of retrieved actives) |
Experimental Protocols for Metric Evaluation
A standardized experimental protocol is essential for the fair and objective comparison of different virtual screening methods.
1. Benchmark Set Preparation: The foundation of any VS assessment is a high-quality benchmark set. These sets typically include a set of known active compounds and a set of decoy molecules designed to be chemically similar but physically dissimilar to the actives to avoid artificial enrichment [7]. Common benchmarks include:
- DEKOIS 2.0: Utilizes a rigorous protocol to generate challenging decoys. A typical preparation involves curating 40 bioactive molecules for a specific target and then using the DEKOIS method to create 30 decoys per active (a 1:30 ratio), resulting in a set of 1,200 decoys that are property-matched but topologically distinct [23].
- DUD-E (Directory of Useful Decoys Enhanced): Another widely used benchmark set that provides 50 decoys per active compound, also designed to be chemically similar while topologically dissimilar to actives [7] [22].
2. Virtual Screening Execution: The prepared benchmark set is screened against the target using the VS method under evaluation. For SBVS, this involves:
- Protein Preparation: An experimentally determined or predicted protein structure is prepared by removing water molecules, adding hydrogen atoms, and defining the binding site [23] [70].
- Molecular Docking: Each compound (actives and decoys) is docked into the binding site using tools like AutoDock Vina, FRED, PLANTS, or RosettaVS [23] [22]. The output is a ranked list of all compounds based on the docking score.
3. Performance Calculation:
- AUC Calculation: A Receiver Operating Characteristic (ROC) curve is generated by plotting the True Positive Rate (TPR) against the False Positive Rate (FPR) at all possible ranking thresholds [69] [66]. The Area Under this Curve (AUC) is then calculated, with a value of 0.5 representing random performance and 1.0 representing perfect separation [69].
- EF Calculation: The EF at the top X% (e.g., EF 1%) is calculated using the formula: EF = (Hitsₓₜₕᵣₑₛₕₒₗᵥ / Nₓₜₕᵣₑₛₕₒₗᵥ) / (Nₐₜᵢᵥₑₛ / Nₜₒₜₐₗ), where Hitsₓₜₕᵣₑₛₕₒₗᵥ is the number of active compounds found within the top X% of the ranked list, Nₓₜₕᵣₑₛₕₒₗᵥ is the total number of compounds in that top X%, Nₐₜᵢᵥₑₛ is the total number of active compounds in the benchmark, and Nₜₒₜₐₗ is the total number of compounds in the benchmark [66].
- Scaffold-Hopping Power Assessment: The top-ranked compounds are analyzed for their chemical diversity. This is often done by clustering the actives based on molecular scaffolds or fingerprints and then evaluating whether the VS method retrieves actives from multiple, diverse clusters [67]. Methods like the pROC-Chemotype plot can visualize the retrieval of diverse chemotypes at early enrichment stages [23].
Visualizing Virtual Screening Workflows and Metric Relationships
The following diagrams illustrate the standard workflow for benchmarking virtual screening methods and how the key metrics interrelate.
Diagram 1: VS benchmarking workflow.
Diagram 2: Metric purpose relationship.
Successful virtual screening campaigns rely on a suite of software tools and data resources. The table below details key components of the modern virtual screening toolkit.
Table 4: Key Research Reagent Solutions for Virtual Screening
| Resource Name | Type | Primary Function in VS | Access |
|---|---|---|---|
| DEKOIS 2.0 [23] [7] | Benchmarking Data Set | Provides pre-generated sets of known active compounds and challenging decoys for standardized method evaluation. | Public |
| DUD-E [7] [22] | Benchmarking Data Set | An enhanced directory of useful decoys, widely used as a gold standard for benchmarking SBVS methods. | Public |
| AutoDock Vina [23] [71] | Docking Software | A widely used, open-source program for molecular docking and SBVS. | Public |
| FRED & PLANTS [23] | Docking Software | Alternative docking tools often used in comparative benchmarking studies for SBVS. | Commercial/Public |
| ROCS & Phase [67] | LBVS Software | Commercial software for 3D molecular similarity searches, a key tool for LBVS and scaffold hopping. | Commercial |
| RosettaVS [22] | Docking Software & Platform | A state-of-the-art, physics-based virtual screening method and platform that allows for receptor flexibility. | Public |
| CNN-Score / RF-Score-VS [23] | Machine Learning Scoring Function | Pre-trained ML models used to re-score docking poses, significantly improving enrichment over classical scoring functions. | Public |
| AlphaFold2 [70] | Protein Structure Prediction | Generates 3D protein structures for targets without experimental data, enabling SBVS for novel targets. | Public |
Virtual screening (VS) has become an indispensable tool in modern drug discovery, serving as a computational filter to identify promising drug candidates from vast chemical libraries. The field is predominantly divided into two methodological approaches: Structure-Based Virtual Screening (SBVS) and Ligand-Based Virtual Screening (LBVS). SBVS relies on three-dimensional structural information of the target protein, typically employing molecular docking to predict how small molecules bind to a biological target. In contrast, LBVS utilizes information from known active ligands to identify novel compounds with similar structural or physicochemical properties, operating without requiring the target protein's structure. The fundamental question for researchers remains: which approach delivers superior performance for specific discovery scenarios? This analysis provides a data-driven comparison of leading SBVS and LBVS tools, offering evidence-based guidance for method selection within contemporary drug discovery workflows.
Performance Benchmarking: Key Metrics and Comparative Data
Benchmarking studies typically evaluate VS tools using Enrichment Factors (EF), which measure how effectively a method prioritizes true active compounds over inactive ones in a ranked list. EF values are calculated at different percentages of the screened database (e.g., EF1%, EF5%, EF10%), with higher values indicating better performance.
The table below synthesizes performance data from a landmark study evaluating SBVS and LBVS tools across ten anti-cancer targets from the DEKOIS library [72] [73].
Table 1: Performance Comparison of FRED (SBVS) and vROCS (LBVS) on Anti-Cancer Targets
| Performance Metric | FRED (SBVS) | vROCS (LBVS) |
|---|---|---|
| EF1% (Early Enrichment) | Lower performance | Superior performance |
| EF5% (Mid-tier Enrichment) | Similar performance to vROCS | Similar performance to FRED |
| EF10% (Broader Enrichment) | Similar performance to vROCS | Similar performance to FRED |
| Key Characteristic | Leverages protein 3D structure | Leverages known ligand similarity |
This data reveals a critical nuance: the performance of each method is dependent on the specific enrichment level considered. The LBVS tool (vROCS) demonstrated superior early enrichment (EF1%), which is crucial for identifying the most promising candidates from the top of a ranked list. However, both methods showed comparable performance at identifying active compounds within a larger fraction of the screened library (EF5% and EF10%) [72] [73]. A separate, prospective screening contest for Sirtuin 1 inhibitors further validated that different research groups using a variety of SBVS and LBVS methods could successfully identify structurally diverse hits, underscoring the value of methodological diversity [74].
Experimental Protocols for Benchmarking
To ensure fair and reproducible comparisons, benchmarking studies follow rigorous, standardized protocols. The following diagram outlines a generalized workflow for a VS performance evaluation.
Detailed Methodological Steps
- Target Selection and Benchmark Set Curation: Studies select specific therapeutic targets (e.g., kinases, GPCRs) with available structural data and known active ligands. High-quality benchmarking sets like DEKOIS or MUBD-hCRs are employed [72] [75]. These sets contain known active ligands and carefully chosen decoy molecules that are physically similar but chemically distinct to avoid "analogue bias," ensuring an unbiased evaluation [75].
- Compound Library Preparation: A library of compounds, including known actives and decoys, is prepared. This involves standardizing chemical structures, generating plausible 3D conformations, and optimizing for computational processing [74].
- Execution of SBVS and LBVS:
- SBVS Protocol: A representative protein structure (e.g., from PDB) is prepared by adding hydrogen atoms, assigning partial charges, and defining the binding site. Tools like FRED (OpenEye) then dock each compound from the library into the binding site. Compounds are scored and ranked based on predicted complementarity to the binding site and estimated binding affinity [72] [73].
- LBVS Protocol: Known active ligands for the target are used to define a pharmacophore model or a molecular shape/electrostatic query. Tools like vROCS (OpenEye) screen the compound library, aligning and comparing each molecule against the query. Compounds are ranked based on their shape and feature similarity to the known actives [72] [73].
- Performance Evaluation and Comparative Analysis: The ranked lists generated by each method are compared against the ground truth of known actives and decoys. Key metrics like Enrichment Factors (EF) and Area Under the ROC Curve (AUC) are calculated to quantify performance [72] [75].
The Scientist's Toolkit: Essential Research Reagents and Solutions
Successful virtual screening relies on a suite of software tools, databases, and computational resources. The table below details key solutions used in the featured experiments.
Table 2: Key Research Reagent Solutions for Virtual Screening
| Tool/Resource Name | Type | Primary Function | Application in VS |
|---|---|---|---|
| FRED (OpenEye) | Software Tool | Molecular Docking & Scoring | Performs structure-based screening by docking compounds into a protein binding site [72] [73]. |
| ROCS/vROCS (OpenEye) | Software Tool | Shape & Molecular Similarity | Performs ligand-based screening by comparing 3D molecular shapes and pharmacophores [72] [73]. |
| DEKOIS Library | Benchmarking Data Set | Curated Set of Actives & Decoys | Provides a standardized benchmark for fair performance evaluation of VS methods [72] [73]. |
| MUBD-hCRs | Benchmarking Data Set | Maximal Unbiased Benchmarking Set | Designed to minimize bias for evaluating both SBVS and LBVS approaches, particularly for chemokine receptors [75]. |
| AutoDock Vina | Software Tool | Molecular Docking | A widely used open-source program for docking and scoring compound libraries [74]. |
| BindingDB / ChEMBL | Chemical Database | Repository of Bioactive Molecules | Sources for known active ligands and their bioactivity data, crucial for LBVS and benchmarking [74] [75]. |
Integrated and AI-Enhanced Approaches: The Future of Screening
The dichotomy between SBVS and LBVS is increasingly being bridated by hybrid and AI-driven approaches. Evidence strongly supports that combining the atomic-level insights from SBVS with the pattern-recognition capabilities of LBVS yields more robust outcomes [76] [18]. Integration can be achieved through sequential workflows, where LBVS rapidly filters large libraries before SBVS provides detailed analysis, or through parallel consensus scoring, where compounds ranked highly by both methods are prioritized [18].
Artificial Intelligence is profoundly transforming both paradigms. AI enables rapid de novo molecular generation, ultra-large-scale virtual screening, and predictive modeling of ADMET properties. Hybrid AI models that fuse structure-based and ligand-based data are showing particular promise, boosting hit rates and scaffold diversity while reducing the resource footprint of drug discovery campaigns [76]. The convergence of these advanced computational methods is setting a new standard for performance and efficiency in virtual screening.
The comparative analysis reveals that the choice between SBVS and LBVS is not a matter of declaring one universally superior. LBVS, exemplified by vROCS, can offer exceptional early enrichment, making it highly efficient for initial triaging of massive compound libraries. SBVS, with tools like FRED, provides a robust and complementary approach that leverages direct structural information. The most effective modern drug discovery pipelines are those that strategically combine both methods, either sequentially or in parallel, to leverage their respective strengths and mitigate their individual limitations.
The future of virtual screening lies in the intelligent integration of these approaches, powered by artificial intelligence and validated on high-quality, unbiased benchmarking data. As computational power grows and algorithms become more sophisticated, the seamless fusion of SBVS and LBVS will continue to accelerate the delivery of novel therapeutics.
In modern drug discovery, virtual screening (VS) serves as a critical computational filter, prioritizing candidate molecules for costly experimental testing. The two predominant computational strategies, structure-based virtual screening (SBVS) and ligand-based virtual screening (LBVS), offer distinct paths to this goal. SBVS, or molecular docking, leverages the three-dimensional structure of a protein target to predict how a small molecule might bind, estimating binding affinity and pose. In contrast, LBVS relies on the principle of molecular similarity, identifying new candidates based on their resemblance to known active ligands, particularly when the protein structure is unavailable. The ultimate value of any virtual screening campaign, however, is not determined by computational metrics alone but by its successful translation into experimentally validated hits. This guide objectively compares the performance of these approaches, focusing on the critical evidence from experimental assays that validates their predictions.
Performance at a Glance: Quantitative Comparison of VS Methods
The table below summarizes key performance metrics for various virtual screening methods, as established through retrospective benchmarking studies and prospective applications.
Table 1: Performance Metrics of Virtual Screening Approaches
| Method Category | Specific Method | Key Performance Metric | Reported Value | Experimental Context (Benchmark) |
|---|---|---|---|---|
| SBVS with ML Rescoring | PLANTS + CNN-Score | EF 1% (Enrichment Factor) | 28 | Wild-Type PfDHFR [23] |
| SBVS with ML Rescoring | FRED + CNN-Score | EF 1% | 31 | Quadruple-Mutant PfDHFR [23] |
| SBVS (Physics-based) | RosettaGenFF-VS | EF 1% | 16.72 | CASF-2016 Benchmark [22] |
| LBVS (Shape-Based) | HWZ Score | Average AUC (Area Under Curve) | 0.84 ± 0.02 | DUD (40 Targets) [19] |
| LBVS (Shape-Based) | HWZ Score | Hit Rate at Top 1% | 46.3% ± 6.7% | DUD (40 Targets) [19] |
| ML Scoring Function | RF-Score-VS | Hit Rate at Top 1% | 55.6% | DUD-E (102 Targets) [77] |
| Standard Docking | AutoDock Vina | Hit Rate at Top 1% | 16.2% | DUD-E (102 Targets) [77] |
The following table outlines the primary strengths, limitations, and typical experimental validation pathways for each approach.
Table 2: Characteristics and Validation of VS Approaches
| Method Category | Primary Strength | Key Limitation | Typical Experimental Validation |
|---|---|---|---|
| Structure-Based (SBVS) | Discovers novel chemotypes unrelated to known ligands; provides a physical binding model [55]. | Performance depends on the accuracy and relevance of the protein structure [78]. | In vitro binding assays (SPR), functional enzyme/ cell-based assays, X-ray crystallography for pose validation [55] [22]. |
| Ligand-Based (LBVS) | High performance when many active ligands are known; does not require a protein structure [19]. | Limited ability to identify ligands with new scaffolds (scaffold hopping) [19]. | Dose-response assays (IC50, Ki, EC50) to confirm potency and compare to known actives [19]. |
| Machine Learning (ML) SFs | Can significantly improve enrichment over classical scoring functions by learning from large datasets [23] [77]. | Risk of overfitting and poor generalizability to novel targets if training data is not properly managed [77]. | Same as SBVS; requires rigorous cross-validation and independent testing sets to ensure real-world performance [79] [77]. |
Inside the Black Box: Key Experimental Protocols
Understanding the experimental methodologies used to validate virtual screening hits is crucial for interpreting the data. Below are detailed protocols for common assays cited in performance studies.
Surface Plasmon Resonance (SPR) for Binding Affinity
SPR is a gold-standard, label-free technique used to directly measure binding affinity (KD) and kinetics (kon, koff) between a target protein and a small molecule.
- Protocol: The target protein is immobilized on a biosensor chip. Small molecule hits in solution are flowed over the chip. As molecules bind to the protein, the mass on the chip surface changes, altering the refractive index and producing a signal response (RU, Resonance Units).
- Data Analysis: The association and dissociation phases of the sensorgram are fitted to a binding model to determine kinetic rate constants. The equilibrium dissociation constant (KD) is calculated from the ratio KD = koff/kon [4] [22].
- Validation Role: Confirms direct physical interaction and provides quantitative affinity measurements, crucial for validating hits from docking screens [4].
Dose-Response Functional Assays (IC50/EC50)
These assays determine the potency of a hit compound in inhibiting or activating a target's function.
- Protocol: For an enzyme inhibitor, a series of compound concentrations are incubated with the enzyme and its substrate. The rate of product formation is measured (e.g., via fluorescence or absorbance). For cell-based assays, compounds are applied to cells and a functional readout (e.g., cell viability, reporter gene expression) is measured.
- Data Analysis: The percentage of inhibition or activation is plotted against the logarithm of compound concentration. A sigmoidal dose-response curve is fitted, and the IC50 (half-maximal inhibitory concentration) or EC50 (half-maximal effective concentration) is derived [55].
- Validation Role: Confirms that the compound has the desired functional effect, moving beyond mere binding to demonstrate biological activity [55].
X-ray Crystallography for Pose Validation
This technique provides atomic-level evidence that a hit compound binds in the predicted manner.
- Protocol: The target protein is co-crystallized with the hit compound. X-rays are passed through the crystal, and the resulting diffraction pattern is used to solve the three-dimensional structure of the protein-ligand complex.
- Data Analysis: The electron density map is calculated and interpreted. A correct prediction is validated by strong, contiguous electron density for the ligand that matches the computationally docked pose, including key interactions like hydrogen bonds and hydrophobic contacts [22].
- Validation Role: Considered the highest standard of proof for SBVS predictions, as it directly visualizes the binding mode [22].
Workflow Visualization: From Prediction to Validation
The following diagrams illustrate the standard workflows for SBVS and LBVS, highlighting the critical points where experimental validation occurs.
SBVS Experimental Validation Workflow
LBVS Experimental Validation Workflow
The Scientist's Toolkit: Essential Research Reagents & Materials
Successful virtual screening and validation rely on a suite of specialized reagents, software, and compound libraries.
Table 3: Essential Resources for Virtual Screening and Validation
| Tool Category | Specific Tool / Resource | Function in Research |
|---|---|---|
| Benchmarking Sets | DEKOIS 2.0, DUD-E, BayesBind | Provide standardized sets of known active molecules and decoy/inactive molecules to objectively evaluate and benchmark VS method performance [23] [79] [77]. |
| SBVS Software | AutoDock Vina, FRED, PLANTS, GLIDE, RosettaVS | Perform molecular docking by sampling ligand conformations and scoring their complementarity to a protein binding site [23] [55] [22]. |
| LBVS Software | ROCS, HWZ, USR, ShaEP | Perform rapid 3D shape and chemical feature overlay to find molecules similar to a known active query [19]. |
| ML Scoring Functions | RF-Score-VS, CNN-Score | Re-score docking poses using machine learning models trained on large datasets of protein-ligand complexes, often improving enrichment over classical scoring functions [23] [77]. |
| Chemical Libraries | Enamine REAL, ZINC, NCI | Ultra-large libraries of commercially available or synthesizable compounds, providing the chemical space for virtual screening [4] [22]. |
| Experimental Assay Kits | SPR Systems (Biacore), HTS Assay Kits | Enable experimental validation of computational hits through binding affinity measurements (SPR) and functional activity profiling (HTS assays) [22] [77]. |
Synthesis and Future Outlook
The comparative data reveals that both SBVS and LBVS, especially when augmented with modern machine learning, are powerful and validated approaches to hit discovery. The choice between them should be guided by the specific research context: the availability of a high-quality protein structure favors SBVS for scaffold hopping, while the existence of many known actives favors LBVS for finding potent analogs. The most robust campaigns increasingly use a hybrid approach, leveraging the strengths of both to mitigate their individual limitations [4]. Sequential workflows, where LBVS pre-filters a large library for SBVS, or parallel workflows, where results from both are fused, have shown promise in benchmarks like the CACHE competition [4].
The future of validation in virtual screening will be shaped by several key trends. First, the rise of ultra-large libraries containing billions of compounds necessitates more efficient scoring and validation strategies, such as active learning [39] [22]. Second, the development of rigorous benchmarks and improved metrics, like the Bayes enrichment factor, is crucial for properly assessing model performance on these vast chemical spaces and preventing data leakage in ML model evaluation [79] [80]. Finally, the community continues to push for more extensive experimental validation, moving beyond simple in vitro affinity measurements to include cellular efficacy, ADMET properties, and in vivo testing to ensure computational hits have a viable path to becoming lead compounds [78] [55].
Virtual screening (VS) is a cornerstone of modern computer-aided drug discovery, providing a cost-effective strategy for identifying hit compounds from vast chemical libraries. The two primary computational approaches—structure-based virtual screening (SBVS) and ligand-based virtual screening (LBVS)—offer distinct pathways for hit identification [18] [11]. SBVS relies on three-dimensional structural information of the biological target, typically employing molecular docking to predict how ligands bind to the target. In contrast, LBVS leverages known active compounds to identify new hits based on similarity principles or pharmacophore models, without requiring target structure information [18] [4] [81].
Despite their independent development trajectories, these methods exhibit complementary strengths and limitations. This guide provides a systematic comparison of SBVS and LBVS through the lens of recent experimental validations and benchmarking studies, offering researchers an evidence-based framework for method selection and integration. The analysis focuses particularly on performance metrics, operational requirements, and integrative strategies that leverage the synergistic potential of both approaches in real-world drug discovery campaigns.
Fundamental Principles and Methodologies
Structure-Based Virtual Screening (SBVS)
SBVS requires a three-dimensional structure of the target protein, obtained through experimental methods (X-ray crystallography, cryo-EM) or computational prediction (AlphaFold, RosettaFold) [18] [82]. The core methodology involves docking small molecules into a defined binding site and scoring their complementary interactions [11].
Recent advances include machine learning-scoring functions (e.g., CNN-Score, RF-Score-VS) that significantly enhance traditional physics-based scoring [23]. AlphaFold-predicted structures have expanded SBVS applicability, though important limitations persist regarding conformational sampling and side-chain positioning [18] [83]. Free Energy Perturbation (FEP) calculations represent the state-of-the-art for affinity prediction but remain computationally demanding for large libraries [18].
Ligand-Based Virtual Screening (LBVS)
LBVS operates without target structure by applying the similarity-property principle—structurally similar molecules likely exhibit similar biological activities [4] [81]. Methods range from rapid 2D similarity searches to sophisticated 3D pharmacophore mapping and shape-based approaches (e.g., ROCS, FieldAlign) [18].
Contemporary LBVS increasingly integrates graph neural networks (GNNs) with traditional chemical descriptors, enhancing pattern recognition across diverse chemistries [81]. Quantitative Structure-Activity Relationship (QSAR) models further enable quantitative affinity prediction from ligand structure alone [18]. LBVS excels at scaffold hopping—identifying novel chemotypes with similar biological activity—which is valuable for circumventing patent restrictions or optimizing drug-like properties [4].
Direct Performance Comparisons
Quantitative Performance Metrics
Recent benchmarking studies provide direct comparisons of SBVS and LBVS performance across multiple targets. The following table synthesizes key metrics from controlled experiments:
Table 1: Performance Comparison of SBVS and LBVS from Benchmarking Studies
| Target Protein | Method Category | Specific Method | Performance Metric | Result | Reference |
|---|---|---|---|---|---|
| PfDHFR (Wild-Type) | SBVS | PLANTS + CNN-Score | EF₁% (Enrichment Factor) | 28 | [23] |
| PfDHFR (Quadruple Mutant) | SBVS | FRED + CNN-Score | EF₁% | 31 | [23] |
| Multiple GPCRs | SBVS | Docking to AlphaFold2 models | Pose Prediction Accuracy (RMSD ≤ 2.0Å) | Limited success | [82] |
| Nine HTS Datasets | LBVS | Expert-crafted descriptors (scaffold split) | Robustness to data distribution shift | High | [81] |
| LFA-1/ICAM-1 | Hybrid | QuanSA (LB) + FEP+ (SB) | Mean Unsigned Error (MUE) | Significant reduction vs. individual methods | [18] |
Operational Characteristics Comparison
Beyond raw performance metrics, practical considerations significantly influence method selection in research settings:
Table 2: Operational Characteristics of SBVS and LBVS
| Characteristic | SBVS | LBVS |
|---|---|---|
| Structural Data Requirement | Required (Experimental or predicted) | Not required |
| Known Actives Requirement | Not required | Required (Minimum 10-20 for reliability) |
| Computational Demand | High (Docking) to Very High (FEP) | Low (2D similarity) to Moderate (3D shape) |
| Chemical Novelty Identification | Moderate (Dependent on pocket flexibility) | High (Particularly for scaffold hopping) |
| Handling Target Flexibility | Limited without specialized protocols | Inherently accommodated |
| Resistance Mechanism Adaptation | Challenging (Requires mutant structures) | Straightforward (With mutant-specific activity data) |
| Quantitative Affinity Prediction | Limited with standard docking; improved with FEP/ML | Possible with 3D-QSAR/QuanSA |
Experimental Protocols for Method Validation
Benchmarking Protocol for SBVS Performance
The recent PfDHFR study [23] exemplifies rigorous SBVS validation:
Protein Preparation: Crystal structures of wild-type (PDB: 6A2M) and quadruple-mutant (PDB: 6KP2) PfDHFR were prepared using OpenEye's "Make Receptor." Waters, ions, and redundant chains were removed, followed by hydrogen addition and optimization.
Compound Library Preparation: The DEKOIS 2.0 benchmark set containing 40 bioactive molecules and 1200 challenging decoys (1:30 ratio) for each PfDHFR variant was prepared. Multiple conformations were generated for FRED docking using Omega, while single conformers were retained for AutoDock Vina and PLANTS.
Docking and Evaluation: Three docking tools (AutoDock Vina, PLANTS, FRED) evaluated both PfDHFR variants. Machine learning re-scoring (CNN-Score, RF-Score-VS v2) was applied to docking outputs. Performance was assessed using pROC-AUC, pROC-Chemotype plots, and EF₁% (enrichment factor at 1% of screened database).
Validation Protocol for LBVS under Realistic Conditions
The GNN-descriptor integration study [81] established robust LBVS evaluation:
Data Curation: Nine well-curated high-throughput screening datasets were used, ensuring statistical power and chemical diversity.
Splitting Strategies: Both random splits and more realistic scaffold splits were implemented to assess generalization capability to novel chemotypes.
Model Architecture: Three GNN architectures (GCN, SchNet, SphereNet) were evaluated with and without concatenation of expert-crafted biochemical descriptors from the BioChemical Library (BCL).
Performance Metrics: Models were evaluated using multiple metrics (AUC-ROC, AUC-PR, EF₁%, EF₁₀%) with statistical significance testing via paired t-tests with false discovery rate adjustment.
Integrated Workflows and Synergistic Applications
Sequential Integration Strategies
Sequential filtering represents the most common integration pattern, leveraging computational efficiency of LBVS for initial library reduction followed by SBVS refinement [18] [4]:
This approach conserves computational resources by applying expensive docking calculations only to compounds pre-filtered by ligand-based methods [18]. In the CACHE Challenge #1, most teams employed similar sequential strategies to navigate ultra-large libraries (e.g., Enamine REAL with 36 billion compounds) [4].
Parallel Screening with Consensus Scoring
Parallel execution of SBVS and LBVS with subsequent result integration provides complementary advantages:
The Bristol Myers Squibb collaboration on LFA-1 inhibitors demonstrated this approach's power, where a hybrid model averaging predictions from both methods performed better than either method alone, achieving high correlation between experimental and predicted affinities through partial cancellation of errors [18].
Decision Framework for Method Selection
The choice between individual and integrated approaches depends on project constraints and objectives:
Essential Research Reagents and Computational Tools
Table 3: Key Research Reagent Solutions for Virtual Screening
| Category | Tool/Resource | Specific Function | Application Context |
|---|---|---|---|
| Protein Structure Resources | Protein Data Bank (PDB) | Experimental structure repository | SBVS foundation |
| AlphaFold Database | Predicted protein structures | SBVS when experimental structures unavailable | |
| Compound Libraries | ZINC, PubChem, ChEMBL | Curated small molecule databases | Source compounds for screening |
| Enamine REAL, ChemDiv | Ultra-large synthesizable libraries | Large-scale screening campaigns | |
| SBVS Software | AutoDock Vina, FRED, PLANTS | Molecular docking | Pose generation and scoring |
| CNN-Score, RF-Score-VS | Machine learning scoring functions | Enhanced binding affinity prediction | |
| LBVS Software | ROCS, FieldAlign | Shape-based similarity screening | 3D ligand-based screening |
| QuanSA, eSim | Quantitative similarity analysis | Affinity prediction from ligand data | |
| Hybrid Platforms | Optibrium | Integrated screening environment | Combined SBVS/LBVS workflows |
Direct comparisons between structure-based and ligand-based virtual screening reveal a landscape of complementary strengths rather than strict superiority of either approach. SBVS provides atomic-level insights into binding interactions and can identify novel chemotypes, but remains constrained by protein structure availability and quality. LBVS offers computational efficiency and robustness to target flexibility but depends on known active compounds for pattern recognition.
The most successful virtual screening campaigns strategically integrate both approaches, either through sequential filtering to balance efficiency and precision, or parallel implementation with consensus scoring to maximize confidence in results. As both methodologies advance through machine learning integration and improved physicochemical modeling, their synergistic application will continue to accelerate hit identification and optimization in drug discovery.
The evidence strongly supports hybrid approaches that combine atomic-level insights from structure-based methods with pattern recognition capabilities of ligand-based approaches. Whether through sequential workflows or parallel consensus scoring, integrated strategies can outperform individual methods by reducing prediction errors and increasing hit identification confidence [18].
Conclusion
The validation of structure-based and ligand-based virtual screening reveals that neither method is universally superior; rather, they are highly complementary. SBVS excels when a high-quality target structure is available and can predict novel chemotypes, while LBVS is powerful for leveraging known ligand data and is computationally efficient. The most successful modern campaigns increasingly adopt hybrid or consensus approaches that integrate the strengths of both to mitigate their individual limitations. Looking forward, the integration of artificial intelligence and machine learning is poised to further blur the lines between these paradigms, leading to more generalizable and predictive models. The emergence of open-source, AI-accelerated platforms capable of screening ultra-large libraries in days, validated by high-resolution structural data, signals a transformative era where virtual screening will play an even more central and reliable role in accelerating drug discovery for therapeutically challenging targets.
References
- 1. How useful is virtual screening in drug discovery? [https://synapse.patsnap.com/article/how-useful-is-virtual-screening-in-drug-discovery]
- 2. The future of pharmaceuticals: Artificial intelligence in drug ... [https://www.sciencedirect.com/science/article/pii/S2095177925000656]
- 3. Virtual Screening Algorithms in Drug Discovery: A Review ... [https://www.mdpi.com/2813-2998/2/2/17]
- 4. Combined usage of ligand- and structure-based virtual ... [https://www.sciencedirect.com/science/article/abs/pii/S0223523424010444]
- 5. Merging Ligand-Based and Structure-Based Methods in ... [https://www.mdpi.com/1420-3049/25/20/4723]
- 6. Bridging Structure- and Ligand-Based Virtual Screening ... [https://pmc.ncbi.nlm.nih.gov/articles/PMC11411525/]
- 7. Benchmarking Methods and Data Sets for Ligand Enrichment ... [https://pmc.ncbi.nlm.nih.gov/articles/PMC4278665/]
- 8. Improved method of structure-based virtual screening based ... [https://pubs.rsc.org/en/content/articlehtml/2020/ra/c9ra09211k]
- 9. Decoys Selection in Benchmarking Datasets [https://www.frontiersin.org/journals/pharmacology/articles/10.3389/fphar.2018.00011/full]
- 10. Structure-Based Virtual Screening for Drug Discovery [https://pmc.ncbi.nlm.nih.gov/articles/PMC4443793/]
- 11. Structure-Based Virtual Screening: From Classical to ... [https://www.frontiersin.org/journals/chemistry/articles/10.3389/fchem.2020.00343/full]
- 12. Virtual Screening Services for Drug Discovery [https://chem-space.com/drug-discovery-cro/virtual-screening]
- 13. Efficient molecular encoders for virtual screening [https://www.sciencedirect.com/science/article/abs/pii/S1740674920300123]
- 14. MOST: most-similar ligand based approach to target prediction [https://bmcbioinformatics.biomedcentral.com/articles/10.1186/s12859-017-1586-z]
- 15. 3D Chemical Similarity Networks for Structure-Based Target ... [https://pmc.ncbi.nlm.nih.gov/articles/PMC5511031/]
- 16. VSFlow: an open-source ligand-based virtual screening tool [https://jcheminf.biomedcentral.com/articles/10.1186/s13321-023-00703-1]
- 17. The Light and Dark Sides of Virtual Screening [https://pmc.ncbi.nlm.nih.gov/articles/PMC6470506/]
- 18. Combining Ligand- and Structure-Based Methods for More ... [https://www.genengnews.com/topics/drug-discovery/combining-ligand-and-structure-based-methods-for-more-effective-virtual-screening/]
- 19. Ligand-Based Virtual Screening Approach Using a New ... [https://pmc.ncbi.nlm.nih.gov/articles/PMC3405195/]
- 20. Accelerating discovery of bioactive ligands with ... [https://www.nature.com/articles/s41467-025-56349-0]
- 21. Merging Ligand-Based and Structure-Based Methods in ... [https://pmc.ncbi.nlm.nih.gov/articles/PMC7587536/]
- 22. An artificial intelligence accelerated virtual screening ... [https://www.nature.com/articles/s41467-024-52061-7]
- 23. Benchmarking the Structure-Based Virtual Screening ... [https://pmc.ncbi.nlm.nih.gov/articles/PMC12363558/]
- 24. Virtual Screening of a Chemically Diverse “Superscaffold ... [https://pmc.ncbi.nlm.nih.gov/articles/PMC12034570/]
- 25. HelixVS: Deep Learning Enhanced Structure-based Virtual ... [https://arxiv.org/html/2508.10262v1]
- 26. Virtual Screening - an overview [https://www.sciencedirect.com/topics/computer-science/virtual-screening]
- 27. Virtual screening web servers: designing chemical probes ... [https://pmc.ncbi.nlm.nih.gov/articles/PMC7986591/]
- 28. Structure-Based Virtual Screening for Drug Discovery [https://pmc.ncbi.nlm.nih.gov/articles/PMC3282008/]
- 29. Structure based pharmacophore modeling, virtual ... [https://www.nature.com/articles/s41598-021-83626-x]
- 30. Pharmacophore-Model-Based Virtual-Screening Approaches ... [https://pmc.ncbi.nlm.nih.gov/articles/PMC9600652/]
- 31. Structure-based virtual screening discovers potent and ... [https://www.sciencedirect.com/science/article/pii/S0223523423003859]
- 32. Structure- and Ligand-Based Virtual Screening for ... [https://pmc.ncbi.nlm.nih.gov/articles/PMC11722135/]
- 33. Are 2D fingerprints still valuable for drug discovery? - PMC [https://pmc.ncbi.nlm.nih.gov/articles/PMC7224332/]
- 34. 3D Pharmacophoric Similarity improves Multi Adverse ... [https://www.nature.com/articles/srep08809]
- 35. Ligand-based Virtual Screening [https://drug-discovery.creative-biostructure.com/ligand-based-virtual-screening-p37]
- 36. Pharmacophore-Based Machine Learning Model To ... [https://pmc.ncbi.nlm.nih.gov/articles/PMC10448689/]
- 37. Structure based drug design and machine learning ... [https://www.nature.com/articles/s41598-025-17708-5]
- 38. Accelerating Ligand-Based Virtual Screening with AI and ... [https://oxfordglobal.com/discovery-development/resources/accelerating-ligand-based-virtual-screening]
- 39. A quantitative model of structure-based virtual screening ... [https://chemrxiv.org/engage/chemrxiv/article-details/69037e08113cc7cfff050553]
- 40. Pre-trained molecular language models with random ... [https://www.nature.com/articles/s44387-025-00029-3]
- 41. [2507.10273] Conditional Chemical Language Models are ... [https://arxiv.org/abs/2507.10273]
- 42. Evaluating the structure-based virtual screening performance ... [https://journals.plos.org/plosone/article?id=10.1371/journal.pone.0318712]
- 43. Combining GCN Structural Learning with LLM Chemical ... [https://pubmed.ncbi.nlm.nih.gov/41118289/]
- 44. WHAT IS CACHE | CACHE [https://cache-challenge.org/what-cache]
- 45. The First CACHE Challenge – Testing Diverse Virtual ... [https://chemrxiv.org/engage/chemrxiv/article-details/65e76cf966c1381729437c1a]
- 46. Challenge #4 – COMPUTATIONAL METHODS [https://cache-challenge.org/challenges/finding-ligands-targeting-the-tkb-domain-of-cblb/computational-methods]
- 47. Top 5 Drug Discovery Trends 2025 Driving Breakthroughs [https://www.pelagobio.com/cetsa-drug-discovery-resources/blog/drug-discovery-trends-2025/]
- 48. Ultrahigh-Throughput Virtual Screening Strategies against ... [https://pmc.ncbi.nlm.nih.gov/articles/PMC12308805/]
- 49. Deep learning pipeline for accelerating virtual screening in ... [https://www.nature.com/articles/s41598-024-79799-w]
- 50. Consensus holistic virtual screening for drug discovery [https://jcheminf.biomedcentral.com/articles/10.1186/s13321-024-00855-8]
- 51. Structure-based virtual screening, molecular docking, and MD ... [https://pmc.ncbi.nlm.nih.gov/articles/PMC12312920/]
- 52. Hidden bias in the DUD-E dataset leads to misleading ... [https://journals.plos.org/plosone/article?id=10.1371/journal.pone.0220113]
- 53. Deep reinforcement learning enables better bias control in ... [https://www.sciencedirect.com/science/article/abs/pii/S001048252400249X]
- 54. AI and ML for Target Validation & Lead Optimization [https://oxfordglobal.com/discovery-development/resources/ai-and-ml-for-target-validation-lead-optimization]
- 55. A Comprehensive Survey of Prospective Structure-Based ... [https://pmc.ncbi.nlm.nih.gov/articles/PMC9781938/]
- 56. Accelerating high-throughput virtual screening through molecular pool-based active learning - PMC [https://pmc.ncbi.nlm.nih.gov/articles/PMC8188596/]
- 57. Simulations and active learning enable efficient ... [https://www.nature.com/articles/s41467-025-62139-5]
- 58. Active Learning and Bayesian Optimization: A Unified Perspective to Learn with a Goal | Archives of Computational Methods in Engineering [https://link.springer.com/article/10.1007/s11831-024-10064-z]
- 59. Active Learning and Bayesian Optimization: a Unified Perspective to Learn with a Goal [https://arxiv.org/html/2303.01560v4]
- 60. Active Learning for Energy-Based Antibody Optimization and Enhanced Screening [https://arxiv.org/html/2409.10964v1]
- 61. Reinforced Active Learning for Large-Scale Virtual ... [https://neurips.cc/virtual/2025/poster/119971]
- 62. of four popular Benchmark programs: construction... virtual screening [https://jcheminf.biomedcentral.com/articles/10.1186/s13321-016-0167-x]
- 63. of machine-learning scoring functions in... Performance [https://www.nature.com/articles/srep46710?error=cookies_not_supported]
- 64. Probing the Structure - Based of... Virtual Screening Performance [https://www.dovepress.com/benchmarking-the-structure-based-virtual-screening-performance-of-wild-peer-reviewed-fulltext-article-DDDT]
- 65. An Improved Metric and Benchmark for Assessing the ... [https://pmc.ncbi.nlm.nih.gov/articles/PMC10980085/]
- 66. Measuring Virtual Screening Accuracy [https://pharmacelera.com/blog/science/measuring-virtual-screening-accuracy/]
- 67. A comprehensive comparative assessment of 3D ... [https://pubmed.ncbi.nlm.nih.gov/34151363/]
- 68. Free energy perturbation (FEP)-guided scaffold hopping [https://www.sciencedirect.com/science/article/pii/S2211383521003889]
- 69. Classification: ROC and AUC | Machine Learning [https://developers.google.com/machine-learning/crash-course/classification/roc-and-auc]
- 70. Leveraging AlphaFold2 structural space exploration for ... [https://www.sciencedirect.com/science/article/pii/S2405580825001979]
- 71. Virtual screening and in vitro validation of natural compound ... [https://pmc.ncbi.nlm.nih.gov/articles/PMC8693770/]
- 72. Performance evaluation of structure based and ligand ... [https://pubmed.ncbi.nlm.nih.gov/26330079/]
- 73. Performance evaluation of structure based and ligand ... [https://www.sciencedirect.com/science/article/abs/pii/S0960894X15008756]
- 74. A prospective compound screening contest identified ... [https://www.nature.com/articles/s41598-019-55069-y]
- 75. Maximal Unbiased Benchmarking Data Sets for Human ... [https://pmc.ncbi.nlm.nih.gov/articles/PMC6197807/]
- 76. Convergence of Computer-Aided Drug Discovery and ... [https://www.sciencedirect.com/science/article/pii/S2773216925000388]
- 77. Performance of machine-learning scoring functions in ... [https://www.nature.com/articles/srep46710]
- 78. Editorial: Approaches to improve the performance of virtual ... [https://pmc.ncbi.nlm.nih.gov/articles/PMC12378871/]
- 79. An Improved Metric and Benchmark for Assessing the ... [https://arxiv.org/abs/2403.10478]
- 80. An Improved Metric and Benchmark for Assessing the ... [https://arxiv.org/html/2403.10478v1]
- 81. Advancements in Ligand-Based Virtual Screening through ... [https://pmc.ncbi.nlm.nih.gov/articles/PMC12117557/]
- 82. AI meets physics in computational structure-based drug ... [https://www.nature.com/articles/s44386-025-00019-0]
- 83. Generation of appropriate protein structures for virtual ... [https://www.sciencedirect.com/science/article/pii/S2950363925000286]