Molecular Recognition Models in Drug Discovery: Integrating Lock-and-Key, Induced Fit, and Conformational Selection
This article provides a comprehensive analysis of the lock-and-key, induced fit, and conformational selection models for protein-ligand recognition, tailored for researchers and drug development professionals.
Molecular Recognition Models in Drug Discovery: Integrating Lock-and-Key, Induced Fit, and Conformational Selection
Abstract
This article provides a comprehensive analysis of the lock-and-key, induced fit, and conformational selection models for protein-ligand recognition, tailored for researchers and drug development professionals. It explores the foundational evolution of these paradigms, examines their application in computational drug design and virtual screening, addresses critical challenges in binding affinity prediction, and compares their validation through experimental and AI-driven approaches. The scope encompasses emerging hybrid mechanisms and future directions for enhancing therapeutic discovery.
Foundational Theories of Molecular Recognition: From Rigid Locks to Dynamic Ensembles
The mechanistic understanding of molecular recognition, particularly enzyme-substrate and protein-ligand interactions, constitutes a cornerstone of modern biochemistry and drug discovery. This whitepaper delineates the historical and conceptual evolution from Emil Fischer's seminal "Lock-and-Key" hypothesis through the "Induced Fit" model to the contemporary "Conformational Selection" and population-shift paradigms. Framed within ongoing research, these models are not mutually exclusive but represent a spectrum of dynamic processes central to rational drug design and systems biology.
Model Evolution: Conceptual Frameworks
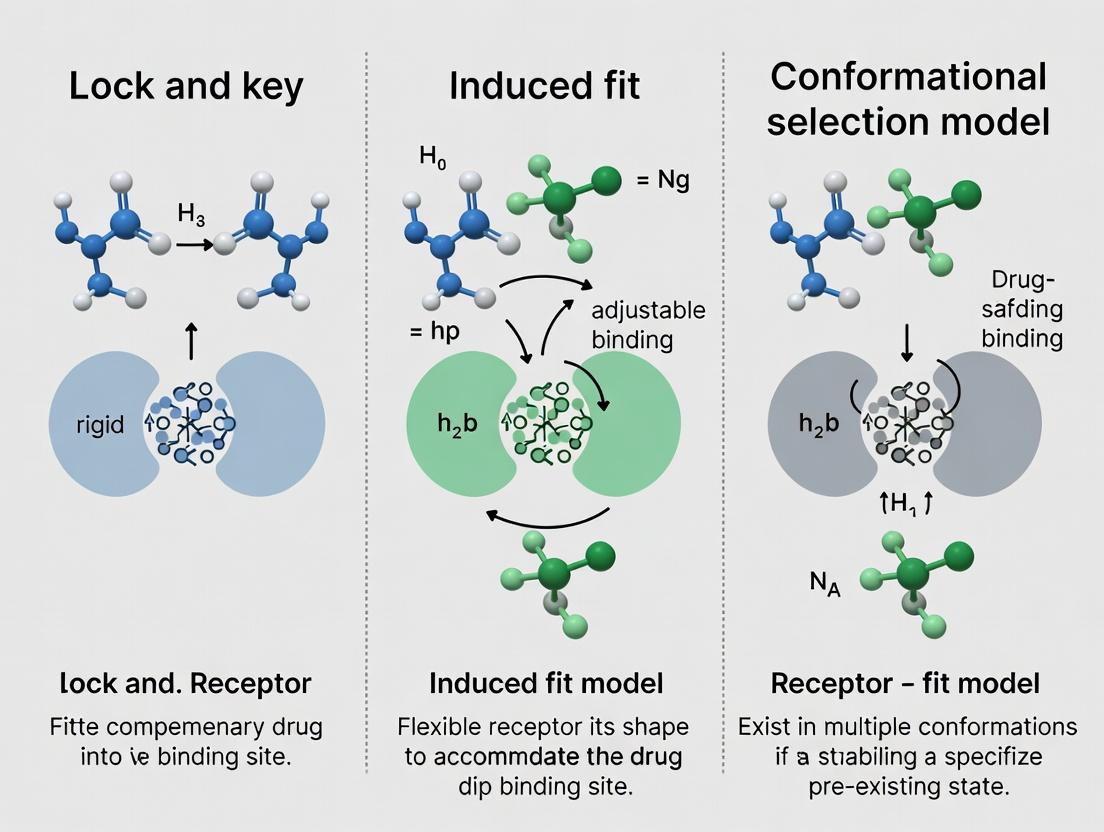
Fischer's Lock-and-Key Model (1894)
Proposed by Emil Fischer, this model posits a static, pre-formed complementary geometry between an enzyme's active site and its substrate, akin to a rigid lock and key. It explained specificity but failed to account for enzymatic dynamics, allosteric regulation, or the stabilization of transition states.
Koshland's Induced Fit Model (1958)
Daniel Koshland proposed a dynamic alternative where the substrate binding induces a conformational change in the enzyme to achieve optimal complementarity and catalytic alignment. This model accounted for substrate specificity, cooperative effects, and regulatory mechanisms.
Conformational Selection & Population Shift Model (Modern)
This contemporary framework posits that proteins exist in a dynamic equilibrium of multiple pre-existing conformations. The ligand selects and stabilizes a specific, complementary conformation from this ensemble, shifting the population distribution. This model integrates concepts from statistical thermodynamics and kinetics, and is supported by advanced spectroscopic and computational studies.
Table 1: Comparative Analysis of Molecular Recognition Models
| Feature | Lock-and-Key (1894) | Induced Fit (1958) | Conformational Selection (Modern) |
|---|---|---|---|
| Protein State | Static, single conformation. | Flexible, changes upon binding. | Dynamic ensemble of pre-existing states. |
| Driving Force | Geometric complementarity. | Substrate-induced structural change. | Ligand selection from conformational ensemble. |
| Kinetic Scheme | E + S ⇌ ES |
E + S ⇌ E*S (E* is induced form). |
E ⇌ E* + S ⇌ E*S (pre-equilibrium). |
| Key Evidence | Stereochemical specificity. | X-ray structures of apo/holo forms. | NMR, smFRET, MD simulations. |
| Limitations | Neglects protein dynamics, allostery. | May overemphasize induced change. | Distinguishing from induced fit kinetically is challenging. |
| Therapeutic Implication | Rigid docking. | Flexible docking. | Targeting cryptic pockets, allosteric drugs. |
Experimental Evidence & Methodologies
Advanced biophysical techniques have been pivotal in discriminating between these models.
Key Experimental Protocols
Protocol A: Stopped-Flow Fluorescence for Binding Kinetics
- Objective: Distinguish induced fit from conformational selection via kinetic analysis.
- Procedure:
- Rapidly mix protein and ligand solutions in a stopped-flow apparatus (dead time ~1 ms).
- Monitor fluorescence change (e.g., Trp quenching or FRET) upon binding.
- Fit observed rate constants (
k_obs) at varying ligand concentrations.
- Data Interpretation: A linear dependence of
k_obson [Ligand] suggests a one-step, induced-fit-like mechanism. A hyperbolic dependence suggests a two-step mechanism where a slow conformational change (either before or after binding) is rate-limiting. Pre-steady-state burst phases can indicate pre-existing active conformations.
Protocol B: Hydrogen-Deuterium Exchange Mass Spectrometry (HDX-MS)
- Objective: Map conformational dynamics and solvent accessibility changes upon ligand binding.
- Procedure:
- Dilute protein (apo or ligand-bound) into D₂O buffer for defined time periods (e.g., 10s to 1hr).
- Quench exchange at low pH and 0°C.
- Digest with pepsin, analyze peptides via LC-MS.
- Calculate deuterium uptake for each peptide over time.
- Data Interpretation: Regions showing decreased deuterium uptake upon ligand binding indicate stabilized, protected structures. Protection patterns can reveal if binding stabilizes a pre-existing fold (conformational selection) or causes protection in distal regions (suggesting induced allostery).
Protocol C: Single-Molecule FRET (smFRET)
- Objective: Directly observe conformational heterogeneity and dynamics in real time.
- Procedure:
- Label protein with donor (Cy3) and acceptor (Cy5) fluorophores at specific sites.
- Immobilize or freely diffuse molecules in a confocal microscope or TIRF setup.
- Monitor FRET efficiency (
E_FRET) trajectories for individual molecules over time. - Construct FRET efficiency histograms and analyze transition rates using hidden Markov models.
- Data Interpretation: A single FRET state for apo protein suggests a locked conformation; multiple interconverting states support a conformational ensemble. Ligand addition shifting the population distribution is direct evidence for conformational selection.
Quantitative Data from Recent Studies
Table 2: Experimental Data Supporting Dynamic Models
| System (Protein-Ligand) | Technique | Key Metric & Result | Model Supported | Reference (Example) |
|---|---|---|---|---|
| Adenylate Kinase (Ap5A inhibitor) | smFRET | τ_closure (apo) = 0.9 ms; Ligand binding increases population of closed state by 90%. |
Conformational Selection | Nature, 2021, 597:283-287 |
| HIV-1 Protease (Clinical Inhibitor) | HDX-MS | >50% reduced deuterium uptake in flaps upon binding; no change in flap dynamics of unbound mutant. | Induced Fit | J. Biol. Chem., 2022, 298(3):101650 |
| β2-Adrenergic Receptor (G-protein) | Cryo-EM / Kinetic Simulation | Pre-existing active population <5%; k_on limited by slow conformational change. |
Conformational Selection | Cell, 2023, 186(2):413-427 |
| Ras GTPase (Effector Protein) | NMR Relaxation Dispersion | k_ex (apo) = 1500 s⁻¹; Macro-to-micro switch conformation populated at ~1%. |
Conformational Selection | Science Adv., 2022, 8(15):eabn5730 |
The Scientist's Toolkit: Essential Reagents & Materials
Table 3: Key Research Reagent Solutions for Binding & Dynamics Studies
| Item | Function & Specification |
|---|---|
| Stopped-Flow Instrument (e.g., Applied Photophysics SX20) | For rapid kinetic measurements (mixing time <1ms) with UV/Vis/fluorescence detection. |
| HDX-MS Buffer Kit (PBS in H₂O/D₂O, quenching solution: 0.1% TFA, 4°C) | Standardized buffers for controlled hydrogen-deuterium exchange and reaction quenching. |
| Site-Directed Mutagenesis Kit (e.g., NEB Q5) | To create cysteines for fluorophore labeling or probe specific residue roles in dynamics. |
| Fluorophore Pair (e.g., Cy3B & Alexa Fluor 647 maleimide) | Bright, photostable donor/acceptor pair for smFRET with well-characterized photophysics. |
| Size-Exclusion Chromatography Column (Superdex 200 Increase) | To purify protein to homogeneity and remove aggregates prior to dynamics experiments. |
| Nucleotide Analogue (Mant-GDP/GTP) | Fluorescent nucleotide for monitoring GTPase/G-protein binding and conformational changes. |
| Cryo-EM Grids (Quantifoil R1.2/1.3, Au 300 mesh) | For flash-freezing protein complexes to capture multiple conformational states. |
| Molecular Dynamics Software (e.g., GROMACS, AMBER) | Open-source suites for simulating protein conformational landscapes on µs-ms timescales. |
Visualizing Concepts and Pathways
Title: Model Evolution and Binding Pathways
Title: Experimental Workflow for Dynamics Studies
The progression from a static Lock-and-Key to dynamic Induced Fit and ensemble-based Conformational Selection models reflects the increasing appreciation of protein intrinsic dynamics as fundamental to function. Current research focuses on integrating these models into a unified quantitative framework, utilizing Markov state models from molecular dynamics and kinetic network analysis. For drug discovery, this evolution mandates strategies that target dynamic ensembles, cryptic allosteric sites, and specific conformational states—moving beyond static structure-based design to dynamics-informed pharmacotherapy. The future lies in experimentally dissecting and computationally predicting the energy landscapes that govern molecular recognition across biological systems.
The fundamental question of how biomolecular recognition occurs has been central to structural biology and drug discovery. Historically, the Lock and Key model (Emil Fischer, 1894) posited a static, pre-formed complementarity between a rigid receptor and ligand. This was superseded by the Induced Fit model (Daniel Koshland, 1958), which introduced the concept of conformational changes in the receptor induced by ligand binding. The modern synthesis, Conformational Selection or Population Shift model, argues that proteins exist in a dynamic ensemble of pre-existing conformations; the ligand selectively binds to and stabilizes a rare, complementary state, shifting the population equilibrium. This whitepaper details the core mechanistic principles underpinning these paradigms: Rigid Complementarity, Induced Flexibility, and Population Shifts.
Rigid Complementarity: The Lock and Key Foundation
This principle asserts that binding specificity arises from precise, static steric and chemical complementarity between two rigid partners.
Key Experimental Evidence:
- X-ray Crystallography of Enzyme-Inhibitor Complexes: Early structures, such as that of hen egg-white lysozyme with tri-N-acetylglucosamine, showed a tight fit without major protein backbone rearrangement.
Experimental Protocol for Validation:
- Protein Purification: Express and purify the target protein (e.g., an enzyme) to homogeneity.
- Ligand Co-crystallization: Mix the protein with a high-affinity, non-reactive substrate analog or inhibitor at a saturating concentration.
- Crystallization & Data Collection: Grow crystals of the complex. Collect high-resolution X-ray diffraction data at a synchrotron source (e.g., 1.5 Å resolution).
- Structure Solution: Solve the crystal structure via molecular replacement or experimental phasing.
- Analysis: Quantitatively analyze the interface using:
- Shape Complementarity (Sc) statistic (Lawrence & Colman, 1993). An Sc value close to 1.0 indicates perfect complementarity.
- Buried Surface Area (BSA) calculation.
- Absence of significant backbone atomic displacement (RMSD < 0.5 Å) between apo and holo forms in the binding site region.
Table 1: Quantitative Metrics for Rigid Complementarity in Exemplary Complexes
| Complex (PDB ID) | Resolution (Å) | Buried Surface Area (Ų) | Shape Complementarity (Sc) | Backbone RMSD (Apo vs. Holo, Å) |
|---|---|---|---|---|
| Streptavidin-Biotin (1STP) | 1.6 | 680 | 0.79 | 0.32 |
| Trypsin-BPTI (2PTC) | 1.8 | 1510 | 0.75 | 0.41 |
Induced Flexibility: The Induced Fit Mechanism
Here, binding initiates a conformational change in the receptor, often involving backbone movements, to achieve optimal complementarity. The ligand acts as a template.
Key Experimental Evidence:
- Comparative X-ray Crystallography: Structures of free and bound forms of enzymes like hexokinase show large-scale domain closure upon substrate binding.
Experimental Protocol for Validation:
- Structural Snapshots: Determine high-resolution crystal structures of:
- The apo protein.
- The protein bound to a substrate analog or product.
- Kinetic Corroboration: Perform stopped-flow fluorescence or NMR to measure the rate of the conformational change and correlate it with the catalytic rate.
- Computational Analysis: Use Molecular Dynamics (MD) simulations starting from the apo structure, with and without ligand, to observe induced motions.
Table 2: Measurable Conformational Changes in Induced Fit Systems
| System | Apo State | Holo State | Key Induced Change | Measured ΔG of Binding (kcal/mol) |
|---|---|---|---|---|
| Hexokinase | Open cleft (3B8A) | Closed cleft (1HKG) | ~12° domain rotation | -6.2 |
| DNA Polymerase β | Open conformation (1BPX) | Closed conformation (1BPY) | Subdomain repositioning; 30° thumb rotation | -9.5 (for correct dNTP) |
Population Shifts: The Conformational Selection Paradigm
This principle posits that the apo protein exists as a dynamic ensemble of interconverting conformations. The ligand selectively binds to and stabilizes a minor population, shifting the equilibrium.
Key Experimental Evidence:
- NMR Relaxation Dispersion and PRE: Studies on proteins like ABL kinase reveal the presence of low-populated, "active-like" states in the absence of ligand.
Experimental Protocol for Validation:
- Detect Minor States: Use NMR CPMG relaxation dispersion to detect and characterize millisecond-timescale excursions of the apo protein to a low-populated (often <5%) excited state.
- Map Conformations: Employ Paramagnetic Relaxation Enhancement (PRE) with spin labels to obtain long-range distance restraints defining the minor state structure.
- Quantify the Shift: Use Isothermal Titration Calorimetry (ITC) or Surface Plasmon Resonance (SPR) to measure binding affinity. Correlate with Ligand-observed NMR titration (e.g., (^{19})F, (^{1})H-(^{15})N HSQC) to monitor the selective stabilization of one set of peaks corresponding to the bound state.
- Single-Molecule FRET (smFRET): Directly visualize the equilibrium between multiple conformational states and its perturbation by ligand addition.
Table 3: Experimental Signatures of Population Shift Mechanisms
| Technique | Observable | Evidence for Population Shift |
|---|---|---|
| NMR CPMG | (R{2,eff}) vs. (ν{CPMG}) | Dispersion profiles indicating exchange with a low-populated state. |
| NMR PRE | Peak intensity attenuation | Long-range distances present in apo protein that match the holo state. |
| smFRET | FRET efficiency histogram | Multi-modal distribution coalescing into one peak upon ligand addition. |
| ITC | ΔH, TΔS, ΔG | Significant entropy-enthalpy compensation suggestive of conformational selection. |
The Scientist's Toolkit: Essential Research Reagents & Materials
| Item | Function & Application |
|---|---|
| Site-Directed Mutagenesis Kit | To create proteins "locked" in specific conformations (e.g., disulfide bridges) to test selection vs. induction. |
| Isotopically Labeled Media ((^{15})N, (^{13})C, (^{2})H) | For producing proteins for multi-dimensional NMR studies to probe dynamics and minor states. |
| Paramagnetic Spin Labels (e.g., MTSL) | Covalent modification of engineered cysteine residues for PRE NMR experiments. |
| Crystallization Screening Kits | High-throughput identification of conditions for obtaining apo and ligand-bound crystal forms. |
| Biolayer Interferometry (BLI) or SPR Chips | For label-free, real-time kinetics measurement of binding interactions. |
| Stopped-Flow Apparatus | To measure rapid conformational changes (ms timescale) via fluorescence or CD upon ligand mixing. |
| Fluorescent Nucleotide/Substrate Analogs | For smFRET studies or as probes in binding assays. |
| MD Simulation Software (e.g., GROMACS, AMBER) | To computationally model the conformational ensemble and simulate binding pathways. |
Visualizations
Title: Rigid Lock and Key Binding Model
Title: Induced Fit Mechanism Pathway
Title: Conformational Selection and Population Shift
Title: Integrated Experimental Workflow for Mechanism Elucidation
Thermodynamic and Kinetic Foundations of Binding Affinity
This whitepaper elucidates the thermodynamic and kinetic principles governing molecular binding affinity, a cornerstone of biochemical interactions and rational drug design. The analysis is framed within the evolving discourse comparing the Lock and Key, Induced Fit, and Conformational Selection models. Understanding the interplay between free energy (ΔG), enthalpy (ΔH), entropy (ΔS), and the kinetic parameters (kon, koff) is paramount for interpreting binding mechanisms and optimizing therapeutic leads.
The quest to understand how molecules recognize and bind each other has evolved through three predominant models:
- Lock and Key (Fisher, 1894): Posits a rigid, pre-complementary fit between ligand and receptor.
- Induced Fit (Koshland, 1958): Proposes that binding induces conformational changes in the receptor (and often ligand) to achieve complementarity.
- Conformational Selection (Monod-Wyman-Changeux, 1965; extended to proteins): Suggests the receptor exists in an ensemble of conformations; the ligand selectively binds to and stabilizes a pre-existing, complementary state, shifting the equilibrium.
These models are not mutually exclusive but represent different limiting cases along a continuum defined by thermodynamics and kinetics.
Thermodynamic Foundations
Binding affinity is quantified by the equilibrium dissociation constant (K_d), directly related to the change in Gibbs Free Energy (ΔG°).
Core Equation: ΔG° = -RT ln(Ka) = RT ln(Kd) where Ka = 1/Kd, R is the gas constant, and T is temperature.
ΔG° is composed of enthalpic (ΔH°) and entropic (TΔS°) components: ΔG° = ΔH° - TΔS°
Enthalpy (ΔH°)
Enthalpy represents the heat released or absorbed during binding, primarily from the formation and breaking of non-covalent interactions (hydrogen bonds, van der Waals, ionic interactions). Negative ΔH° (exothermic) favors binding.
Entropy (ΔS°)
Entropy reflects changes in system disorder. Contributions include:
- Solvation Entropy: Release of ordered water molecules from binding surfaces (typically favorable, +TΔS°).
- Conformational Entropy: Loss of rotational and vibrational freedom upon binding (typically unfavorable, -TΔS°).
- Rotational/Translational Entropy: Loss of freedom upon complex formation (unfavorable).
Table 1: Thermodynamic Signatures and Interpretations
| Thermodynamic Parameter | Favorable Value | Typical Molecular Origin | Potential Model Indicator |
|---|---|---|---|
| Large Negative ΔH° | ΔH° << 0 | Strong, specific non-covalent interactions (e.g., H-bond network). | Lock and Key; tight induced fit. |
| Large Positive ΔS° | TΔS° >> 0 | Displacement of ordered solvent (hydrophobic effect). Release of strained conformations. | Conformational selection (if pre-existing strain relieved). |
| Negative ΔC_p | ΔC_p < 0 | Burial of nonpolar surface area, changes in solvent-exposed surface. | Consistent with hydrophobic burial, not model-specific. |
| Enthalpy-Entropy Compensation | Common | Tightening of interactions (ΔH↓) reduces flexibility (ΔS↓). | Prevalent in induced fit. |
Kinetic Foundations
Binding kinetics describe the pathway to the complex, governed by association (kon) and dissociation (koff) rate constants. Kd = koff / k_on
- k_on: Diffusion-limited (~10^8-10^9 M⁻¹s⁻¹). Slower rates suggest a required conformational rearrangement or a "gated" binding site.
- k_off: Governs complex lifetime and target occupancy. Crucial for drug efficacy.
Table 2: Kinetic Parameters and Mechanistic Implications
| Kinetic Profile | Possible Mechanism | Associated Binding Model |
|---|---|---|
| Slow kon, Slow koff | Binding requires significant conformational rearrangement. High-affinity, long residence time. | Induced Fit or Conformational Selection |
| Fast kon, Slow koff | Near diffusion-limited encounter, very stable complex. | Lock and Key (idealized) |
| Fast kon, Fast koff | Rapid equilibrium, low-affinity interaction. | Weak, non-specific binding. |
| Slow kon, Fast koff | Poor complementarity or steric hindrance. | Low-affinity, transient interaction. |
Experimental Protocols for Deconvolution
Isothermal Titration Calorimetry (ITC)
Purpose: Directly measure ΔG°, ΔH°, ΔS°, and stoichiometry (n) in a single experiment. Protocol:
- Fill the sample cell with the macromolecule (e.g., protein, 10-100 µM) in appropriate buffer.
- Load the syringe with the ligand at 10-20x the macromolecule concentration.
- Set reference power and stirring speed (typically 750-1000 rpm).
- Program a series of injections (e.g., 19 x 2 µL) with spacing (e.g., 150-180s) to allow baseline equilibrium.
- Measure the heat of reaction (µcal/sec) for each injection.
- Integrate peak areas, subtract dilution heats, and fit the binding isotherm to a model (e.g., one-set-of-sites) to extract parameters.
Surface Plasmon Resonance (SPR) / Biolayer Interferometry (BLI)
Purpose: Measure real-time binding kinetics (kon, koff) and affinity (K_d). Protocol (SPR - Immobilization via Amine Coupling):
- Surface Preparation: Activate a CMS sensor chip with a 1:1 mix of EDC and NHS for 7 minutes.
- Ligand Immobilization: Inject the protein (~10-50 µg/mL in 10 mM acetate buffer, pH 4.0-5.5) over the surface for 5-7 minutes.
- Blocking: Deactivate remaining esters with 1M ethanolamine-HCl, pH 8.5.
- Kinetic Run: Flow analyte at a series of concentrations (e.g., 0.5x, 1x, 2x, 5x estimated K_d) over the ligand surface at a constant flow rate (e.g., 30 µL/min).
- Regeneration: Inject a regeneration solution (e.g., 10 mM glycine, pH 2.0) to dissociate the complex without damaging the ligand.
- Data Analysis: Double-reference the data (reference flow cell & buffer injections). Fit the association and dissociation phases globally to a 1:1 Langmuir binding model.
Integrating Models with Thermodynamics and Kinetics
Diagram Title: Thermodynamic-Kinetic Pathways of Binding Models
Interpretation: The diagram illustrates how conformational selection proceeds via ligand binding to a pre-existing state (R2), characterized by a slow kon if R2 is sparsely populated. Induced fit proceeds via an initial encounter complex followed by a rate-limiting conformational change (k2). The dominant pathway is determined by the relative magnitudes of k1, k-1, and k_2.
The Scientist's Toolkit: Key Reagents & Materials
Table 3: Essential Research Reagents and Materials
| Reagent/Material | Function/Explanation |
|---|---|
| High-Purity Target Protein | Recombinant protein with correct folding and post-translational modifications for biophysical assays. |
| Reference Buffer Systems | Matched, degassed buffers for ITC/SPR to minimize heats of dilution and refractive index artifacts. |
| ITC Cleaning Solution | (e.g., 5% Contrad 70, 20% acetic acid). Ensures calorimeter cell is free of contaminants. |
| SPR Sensor Chips | Functionalized gold surfaces (e.g., CMS for amine coupling, NTA for His-tag capture). |
| Kinetic Analysis Software | (e.g., Origin with ITC plugin, Scrubber, Biacore Evaluation Software). For global fitting of binding data. |
| Stop-Flow or T-Jump Apparatus | For measuring very fast conformational changes (µs-ms timescale) linked to binding. |
| NMR Isotope Labels | (^15N, ^13C, ^2H). Enables detection of conformational dynamics and mapping of binding interfaces. |
| Fluorescent Probes | Environment-sensitive dyes (e.g., ANS) or FRET pairs to monitor conformational changes. |
Advantages and Limitations of Each Classical Paradigm
The elucidation of molecular recognition mechanisms underpins modern drug discovery. For decades, the lock and key, induced fit, and conformational selection models have served as classical paradigms to describe the thermodynamics and kinetics of ligand binding to biological targets. This analysis, framed within a broader thesis comparing these models, provides a technical guide to their core principles, experimental validation, and implications for rational drug design.
The Lock and Key Model
Proposed by Emil Fischer in 1894, this model posits that the protein (lock) exists in a single, rigid conformation with a binding site complementary in shape and chemistry to the ligand (key). Binding is a simple bimolecular association.
Advantages:
- Conceptual Simplicity: Provides an intuitive foundation for understanding specificity and enantioselectivity.
- Computational Ease: Enables straightforward molecular docking studies by treating the receptor as static.
- High Specificity Prediction: Explains why structurally dissimilar ligands do not bind to the same active site.
Limitations:
- Ignores Protein Dynamics: Fails to account for the intrinsic flexibility and conformational changes observed in most proteins.
- Incomplete Thermodynamic Explanation: Does not explain binding events that involve significant entropy changes or allosteric modulation.
- Limited Predictive Power: Often insufficient for accurate prediction of binding affinities for flexible targets or for designing high-potency drugs.
The Induced Fit Model
Proposed by Daniel Koshland in 1958, this model asserts that the ligand and protein are not perfectly complementary in their initial states. Binding induces a conformational change in the protein, leading to the final, stable complex.
Advantages:
- Accounts for Flexibility: Explains observed conformational rearrangements upon ligand binding (e.g., hinge-bending motions).
- Explains Allostery and Cooperativity: Provides a mechanism for action at a distance within a protein oligomer.
- Basis for Specificity Enhancement: Describes how binding can exclude water and improve complementarity, increasing specificity.
Limitations:
- Ligand-Centric View: Implies the ligand is the sole driver of conformational change, underestimating pre-existing protein dynamics.
- Kinetic Oversimplification: Typically modeled as a two-step process (association then change), which may not capture multi-state kinetic pathways.
- Energetic Cost: The model can imply a high energetic penalty for the conformational change, which may not be thermodynamically favorable.
The Conformational Selection Model
This modern paradigm, formalized in the early 2000s, proposes that the protein exists in a dynamic equilibrium of multiple pre-existing conformations. The ligand selectively binds to and stabilizes a minor, complementary conformation, shifting the equilibrium.
Advantages:
- Incorporates Intrinsic Dynamics: Aligns with NMR, single-molecule, and relaxation dispersion data showing proteins sample multiple states without ligand.
- Robust Kinetic Framework: Accommodates complex multi-state binding kinetics and can explain phenomena like "gated" binding sites.
- Therapeutic Relevance: Critical for understanding allosteric drug action and designing drugs that target rare, disease-relevant conformational states.
Limitations:
- Experimental Complexity: Requires sophisticated techniques to detect and quantify low-population states and kinetic pathways.
- Computational Intensity: Free energy landscape calculations and molecular dynamics simulations are resource-intensive.
- Conceptual Overlap: Often difficult to rigorously distinguish from induced fit experimentally, as both can describe the same net conformational change.
Quantitative Comparison of Paradigms
Table 1: Core Characteristics of Classical Binding Paradigms
| Feature | Lock and Key | Induced Fit | Conformational Selection |
|---|---|---|---|
| Protein State | Single, rigid conformation | Adaptable conformation | Ensemble of pre-existing conformations |
| Driving Force | Shape/chemical complementarity | Ligand-induced rearrangement | Population shift upon ligand binding |
| Kinetic Scheme | P + L <-> PL |
P + L <-> PL* |
P <-> P* + L <-> P*L |
| Key Evidence | X-ray structures of apo/holo forms | Structural differences between apo/holo forms | Detection of excited states in apo protein (NMR, smFRET) |
| Primary Strength | Simplicity & specificity | Explains observed structural changes | Explains binding kinetics & allostery |
| Primary Weakness | Neglects dynamics | Underestimates pre-equilibrium | Experimentally challenging to prove |
Table 2: Experimental Techniques for Model Discrimination
| Technique | Measurable Parameter | Lock and Key | Induced Fit | Conformational Selection |
|---|---|---|---|---|
| X-ray Crystallography | Static structures of apo/holo protein | Identical binding site geometry | Different binding site geometry | May capture multiple conformations |
| NMR Spectroscopy | Dynamics, chemical shifts, relaxation | Minimal dynamics | Chemical shift changes upon titration | Detect minor states in apo protein |
| Stopped-Flow Kinetics | Binding rate constants (kon, koff) | Simple bimolecular kinetics | May show multi-phasic kinetics | kon often independent of [L] at saturation |
| Single-Molecule FRET | Real-time distance changes | No distance change before binding | Distance change after binding | Distance fluctuation before binding |
| HDX Mass Spectrometry | Solvent accessibility/dynamics | Uniform protection upon binding | Protection only in binding site | Protection pattern indicates pre-existing state |
Experimental Protocols for Model Discrimination
Protocol 1: NMR Relaxation Dispersion to Detect Conformational Exchange
- Objective: Quantify the population, kinetics, and chemical shifts of low-population ("invisible") excited states in the apo protein.
- Method:
- Prepare uniform 15N- or 13C-labeled protein sample in appropriate buffer.
- Acquire a series of 15N Carr-Purcell-Meiboom-Gill (CPMG) relaxation dispersion experiments on an NMR spectrometer at multiple magnetic field strengths (e.g., 600 MHz, 800 MHz).
- Vary the frequency of the CPMG refocusing pulses (νCPMG) to modulate the effect of chemical exchange on transverse relaxation (R2).
- Fit the observed relaxation rates (R2,eff) vs. νCPMG to a quantitative exchange model (e.g., 2-state exchange: A ⇌ B).
- Extract the exchange rate (kex = kAB + kBA), population of the minor state (pB), and the chemical shift difference (Δω).
- Interpretation: Observation of μs-ms exchange in the apo protein that is quenched or altered upon ligand binding is strong evidence for conformational selection.
Protocol 2: Stopped-Flow Fluorescence to Determine Binding Mechanism
- Objective: Measure the observed rate constant (kobs) of binding as a function of ligand concentration to distinguish between induced fit and conformational selection.
- Method:
- Engineer a tryptophan residue or attach an environmentally sensitive fluorophore (e.g., ANS) at a site reporting on binding or conformational change.
- Load one syringe with protein and another with ligand at concentrations typically 5-10x above Kd.
- Rapidly mix equal volumes and monitor fluorescence change over time (λex ~280 nm or fluorophore-specific; λem >320 nm).
- Repeat experiments across a range of final ligand concentrations ([L]).
- Fit individual traces to a single or multi-exponential function to obtain kobs.
- Plot kobs vs. [L].
- Interpretation: A linear dependence (kobs = kon[L] + koff) suggests a single-step (Lock and Key) mechanism. A hyperbolic dependence is characteristic of a two-step mechanism (Induced Fit: kobs asymptotes at high [L]; Conformational Selection: kobs may be independent of [L] if the initial conformational change is rate-limiting).
Protocol 3: Dual-Color smFRET for Real-Time Conformational Tracking
- Objective: Directly visualize conformational dynamics of single protein molecules before and during ligand binding.
- Method:
- Site-specifically label the protein with a donor (e.g., Cy3) and an acceptor (e.g., Cy5) fluorophore at positions reporting on the conformational change of interest.
- Immobilize labeled proteins on a passivated microscope slide via a biotin-streptavidin linkage.
- Image using a total internal reflection fluorescence (TIRF) microscope with alternating laser excitation.
- Record donor and acceptor emission intensities over time for hundreds of individual molecules.
- Calculate FRET efficiency (EFRET) for each molecule in each frame.
- Construct FRET efficiency histograms and identify states. Analyze transitions using hidden Markov modeling.
- Repeat experiment in the presence of ligand.
- Interpretation: If apo molecules fluctuate between high- and low-FRET states (pre-existing equilibrium) and ligand addition stabilizes one state, it supports conformational selection. If a single apo FRET state shifts only after ligand binding, it supports induced fit.
Visualization of Binding Mechanisms
Title: Three Classical Molecular Recognition Paradigms
Title: Experimental Workflow for Discriminating Binding Models
The Scientist's Toolkit: Key Research Reagent Solutions
Table 3: Essential Materials for Binding Mechanism Studies
| Item | Function & Application | Example Product/Catalog # |
|---|---|---|
| Isotopically Labeled Media | For NMR sample preparation; enables detection of 13C, 15N, or 2H nuclei. | Celtone (CNLM) or Silantes (U-13C,15N) growth media. |
| Crystallization Screening Kits | To obtain high-quality crystals of apo and holo proteins for structural comparison. | Hampton Research Crystal Screens I & II, or JCSG Core Suites. |
| Site-Directed Mutagenesis Kit | To introduce reporter residues (e.g., Trp, Cys) or perturb conformational equilibria. | Q5 Site-Directed Mutagenesis Kit (NEB). |
| Thiol-Reactive Fluorophores | For site-specific labeling of engineered cysteine residues for stopped-flow or smFRET. | Maleimide-derivatives of Alexa Fluor 488, Cy3, Cy5 (Thermo Fisher). |
| Stopped-Flow Accessory | Rapid mixing device for kinetics measurements on the µs-ms timescale. | Applied Photophysics SX20 or Chirana stopped-flow module. |
| Biotinylation Kit | For site-specific biotinylation of proteins for surface immobilization in smFRET. | BirA biotin ligase kit (Avidity) for AviTag sequences. |
| Passivated Microscope Slides | Low-noise surfaces for single-molecule immobilization to prevent non-specific binding. | PEG/biotin-PEG coated slides (Microsurfaces Inc.). |
| HDX-MS Software Suite | For automated analysis of hydrogen-deuterium exchange mass spectrometry data. | HDExaminer (Sierra Analytics) or DynamX (Waters). |
| Kinetic Analysis Software | To fit complex kinetic data to multi-step binding models. | KinTek Explorer or GraphPad Prism with appropriate equations. |
The longstanding debate on molecular recognition mechanisms centers on three primary models: the static Lock-and-Key, the dominant Induced Fit, and the emerging Conformational Selection model. While Koshland's Induced Fit paradigm has dominated textbooks for decades, positing that ligand binding induces the correct conformation in the target protein, the Conformational Selection model presents a fundamental challenge. This model asserts that proteins exist in a dynamic ensemble of pre-existing conformations, from which the ligand selectively binds to and stabilizes the complementary state, shifting the equilibrium. This whitepaper provides an in-depth technical examination of the Conformational Selection model, its evidence, and its implications for modern drug discovery.
Core Principles & Quantitative Comparison
Table 1: Core Tenets of Molecular Recognition Models
| Feature | Lock-and-Key (Fischer) | Induced Fit (Koshland) | Conformational Selection (Monod-Wyman-Changeux) |
|---|---|---|---|
| Protein State | Rigid, single conformation | Flexible, but single dominant state | Dynamic ensemble of pre-existing states |
| Binding Trigger | Geometric & chemical complementarity | Ligand-induced conformational change | Population shift upon ligand binding |
| Temporal Order | Binding only to complementary shape | Binding precedes conformational change | Conformational equilibrium precedes binding |
| Ligand Role | Passive fit | Active inducer | Selective stabilizer |
| Kinetic Scheme | P + L <-> PL |
P + L <-> PL -> P*L |
P <-> P* + L <-> P*L |
Table 2: Key Experimental Distinctions & Evidence
| Experimental Method | Induced Fit Signature | Conformational Selection Signature | Key Reference (Example) |
|---|---|---|---|
| NMR Relaxation Dispersion | Conformational exchange rate increases upon ligand titration. | Conformational exchange rate decreases upon ligand titration. | Boehr et al., Science (2006) |
| Single-Molecule FRET | Ligand binding event precedes conformational shift. | Conformational fluctuations observed prior to binding; ligand stabilizes one state. | Kim et al., Nature (2013) |
| Stopped-Flow Kinetics | Bi-exponential kinetics; rate constant depends on [Ligand]. | Bi-exponential kinetics; one rate constant is [Ligand]-independent. | Hammes et al., PNAS (2009) |
| Hydrogen-Deuterium Exchange (HDX-MS) | Protection from exchange only in ligand-bound state. | Protection patterns for apo-ensemble match one sub-state of the bound conformation. | Englander et al., Annu. Rev. Biophys. (2016) |
Detailed Experimental Protocols
Protocol 1: NMR CPMG Relaxation Dispersion to Distinguish Models
Objective: To measure micro- to millisecond conformational dynamics of a protein in apo and ligand-bound states.
- Sample Preparation: Prepare uniformly 15N-labeled protein (0.5-1 mM) in appropriate NMR buffer. Prepare an identical sample with saturating ligand (typically 1.5-2x Kd).
- Data Acquisition: Collect 15N CPMG relaxation dispersion experiments at multiple magnetic fields (e.g., 600, 800 MHz). Vary the CPMG frequency (νCPMG) from 50 to 1000 Hz.
- Data Analysis: Fit the transverse relaxation rate (R2) as a function of νCPMG to appropriate models (e.g., two-state exchange). Extract the conformational exchange rate constant (kex) and populations.
- Interpretation: A decrease in kex upon ligand binding supports Conformational Selection (ligand stabilizes one state, slowing interchange). An increase in kex supports Induced Fit (binding activates new dynamics).
Protocol 2: Single-Molecule FRET (smFRET) for Real-Time Observation
Objective: To directly visualize conformational transitions and their coupling to binding events.
- Labeling: Site-specifically label the protein with donor (e.g., Cy3) and acceptor (Cy5) fluorophores using cysteine mutations and maleimide chemistry.
- Immobilization: Immobilize labeled proteins via biotin-streptavidin linkage on a PEG-passivated quartz slide.
- Data Collection: Use a total-internal-reflection fluorescence (TIRF) microscope. Record donor and acceptor emission trajectories from individual molecules under apo conditions and in the presence of ligand.
- Hidden Markov Modeling (HMM): Analyze FRET trajectories using HMM to identify discrete conformational states and their transition rates.
- Correlation with Binding: Co-inject a fluorescently labeled ligand to correlate binding events (from ligand channel) with conformational changes (from FRET channel). Pre-existing FRET states that are stabilized by binding indicate Conformational Selection.
Protocol 3: Stopped-Flow Fluorescence Kinetics
Objective: To resolve binding kinetics and identify ligand-independent steps.
- Probe Selection: Engineer a tryptophan mutant or use an intrinsic/extrinsic fluorescent probe that reports on binding or conformational change.
- Experiment Setup: Load one syringe with protein, another with ligand. Rapidly mix (dead time < 2 ms) and monitor fluorescence change over time.
- Multi-Condition Acquisition: Perform experiments at multiple ligand concentrations (both above and below Kd).
- Global Fitting: Fit all kinetic traces globally to different mechanisms:
- Induced Fit:
P + L <-> PL -> P*L(both observed rates depend on [L]). - Conformational Selection:
P <-> P* + L <-> P*L(one rate, for theP<->P*step, is independent of [L]).
- Induced Fit:
Visualizing the Models and Pathways
Diagram Title: Kinetic Pathways of Conformational Selection vs. Induced Fit
Diagram Title: smFRET Workflow for Distinguishing Recognition Models
The Scientist's Toolkit: Key Research Reagent Solutions
Table 3: Essential Materials for Conformational Selection Research
| Item | Function & Rationale |
|---|---|
| Isotopically Labeled Proteins (15N, 13C, 2H) | Enables high-resolution NMR studies (CPMG, HSQC) to probe dynamics and structural ensembles in solution. |
| Site-Specific Fluorophore Labeling Kits (e.g., maleimide-Cy3/Cy5) | For smFRET, allows attachment of donor/acceptor dyes to engineered cysteine residues to report on distance changes. |
| PEG-Passivated Slides & Streptavidin Coating | Creates a non-adhesive, bio-inert surface for smFRET to prevent non-specific protein adsorption and allow controlled immobilization via biotin. |
| Rapid Kinetics Stopped-Flow Instrument | Mixes small volumes of protein and ligand in <2 ms, enabling observation of fast kinetic phases critical for model discrimination. |
| Hydrogen-Deuterium Exchange (HDX) Automation System | Precisely controls labeling times for HDX-MS experiments, which probe solvent accessibility and dynamics of protein ensembles. |
| Biolayer Interferometry (BLI) or Surface Plasmon Resonance (SPR) Chips | Measures binding kinetics (ka, kd) of ligands to immobilized protein targets, providing essential parameters for kinetic modeling. |
Implications for Drug Discovery
The Conformational Selection model reframes drug design from "inducing a fit" to "targeting an existing state." This supports the development of allosteric inhibitors that stabilize inactive conformations and the search for cryptic pockets that transiently open in the apo-ensemble. Understanding the intrinsic population distribution of target states (P vs. P*) becomes critical for predicting drug efficacy and resistance mechanisms. This paradigm shift encourages screening strategies and computational methods that account for protein dynamics and ensemble-based docking.
While Induced Fit remains a valid mechanism in specific cases, Conformational Selection presents a profound and well-supported challenge to its dominance. The pre-existing ensemble view is increasingly recognized as a fundamental principle governing molecular recognition, with significant consequences for interpreting experimental data and designing therapeutic interventions. Future research will focus on quantifying energy landscapes of apo-proteins and developing drugs that exploit dynamic conformational equilibria.
Computational Methodologies and Applications in Drug Design
The computational simulation of molecular docking is a cornerstone of modern drug discovery, fundamentally rooted in Emil Fischer's 1894 "lock-and-key" hypothesis. This model posits that a ligand (the key) binds to a protein (the lock) with complementary, pre-existing shapes. Within the context of broader binding theories—namely lock-and-key, induced fit, and conformational selection—rigid docking and its associated scoring functions represent the direct computational embodiment of the lock-and-key paradigm. This whitepaper provides an in-depth technical guide to the core principles, methodologies, and contemporary applications of rigid docking, framing it within ongoing research into molecular recognition models.
Theoretical Foundations: The Lock-and-Key Paradigm in Silico
Rigid molecular docking operates on the core assumption that both the receptor and the ligand undergo negligible conformational change upon binding. The "docking" problem is thus simplified to a search for the optimal relative orientation (pose) of two rigid bodies that maximizes geometric and chemical complementarity. This stands in contrast to induced fit docking (which allows side-chain or backbone flexibility) and conformational selection ensembles (which dock ligands to multiple pre-computed receptor conformations).
The process involves two key algorithmic components:
- Sampling: Exploring the rotational and translational space of the ligand within the receptor's binding site.
- Scoring: Evaluating and ranking each generated pose using a scoring function.
Rigid Scoring Functions: Mathematical Formalism
Rigid scoring functions are designed for speed and efficiency, evaluating millions of poses rapidly. They are typically empirical or knowledge-based.
Empirical Scoring Functions
These approximate the Gibbs free energy of binding (ΔG) as a sum of weighted energy terms derived from fitting to experimental binding affinity data.
[ \Delta G{\text{bind}} \approx \sumi wi \cdot \text{InteractionType}i ]
Common terms include:
- Van der Waals (VDW): Lennard-Jones potential for shape complementarity.
- Hydrogen Bonding: Directional and distance-dependent terms.
- Electrostatics: Coulombic potential.
- Desolvation Penalty: Hydrophobic effect and polar burial penalty.
Knowledge-Based (Statistical Potential) Functions
These derive pairwise atom-atom potentials from the observed frequencies of contacts in known protein-ligand complex structures (e.g., PDB).
[ \Delta W(r) = -kB T \ln \left[ \frac{\rho{\text{obs}}(r)}{\rho_{\text{ref}}(r)} \right] ]
Where (\rho{\text{obs}}(r)) is the observed atom pair density and (\rho{\text{ref}}(r)) is the density in a random reference state.
Quantitative Comparison of Popular Rigid Scoring Functions
The table below summarizes the characteristics and performance metrics of widely used rigid scoring functions in common docking software.
Table 1: Comparison of Rigid Scoring Functions
| Scoring Function (Software) | Type | Key Energy Terms | Speed | Best Application Context | Reported RMSD ≤ 2.0Å* |
|---|---|---|---|---|---|
| ChemScore (GOLD) | Empirical | VDW, HBond, Metal, Desolvation | Medium | Diverse ligand sets, metalloproteins | ~70-80% |
| PLP (SYBYL) | Empirical | Piecewise Linear Potential (simplified VDW/HBond) | Very Fast | High-throughput virtual screening | ~65-75% |
| DOCK Energy Score | Empirical + FFT | VDW, Electrostatics, Desolvation (GB/SA) | Fast | Protein-ligand & protein-protein | ~70-80% |
| AutoDock Vina | Hybrid | Empirical (VDW, HBond, etc.) + Knowledge-based | Very Fast | General-purpose, HTVS | ~75-85% |
| X-Score | Empirical | VDW, HBond, Hydrophobic, Entropy | Medium | Binding affinity prediction | N/A (affinity-focused) |
Note: *Success rate for pose prediction (ligand RMSD ≤ 2.0Å from crystal structure) in benchmark re-docking tests. Performance is highly system-dependent.
Experimental Protocol: Standard Rigid Docking Workflow
The following protocol details a standard procedure for performing rigid molecular docking, applicable to software like AutoDock Vina, DOCK, or GOLD (in rigid mode).
Protocol: Rigid Receptor-Ligand Docking for Virtual Screening
I. System Preparation
- Receptor Preparation:
- Source a 3D structure of the target protein from the Protein Data Bank (PDB).
- Using a molecular visualization suite (e.g., UCSF Chimera, Maestro):
- Remove all non-essential molecules (water, ions, co-crystallized ligands).
- Add missing hydrogen atoms.
- Assign partial charges (e.g., Gasteiger charges) and protonation states at physiological pH (typically using tools like
propkaorreduce).
- Save the prepared receptor in PDBQT or MOL2 format.
Ligand Library Preparation:
- Obtain ligand structures in 2D (SMILES) or 3D (SDF) format from databases (ZINC, PubChem).
- Generate 3D conformers and optimize geometry using force fields (MMFF94, GAFF).
- Assign appropriate partial charges and torsion tree definitions.
- Save all ligands in a unified format (e.g., PDBQT, SDF).
Binding Site Definition:
- If a co-crystallized ligand exists: Define the grid box centered on this ligand with dimensions extending ~10Å in each direction.
- For apo structures or de novo sites: Use computational site prediction tools (e.g., FTsite, CASTp) or literature data to define coordinates.
II. Docking Execution
- Parameter Configuration:
- Set the scoring function to the desired rigid function (e.g., Vina, ChemScore).
- Define the search space using the grid box coordinates (centerx, centery, centerz, sizex, sizey, sizez).
- Set the exhaustiveness of the global search (e.g., Vina:
num_modes=20,exhaustiveness=8). Higher values increase runtime but improve sampling.
- Run Docking:
- Execute the docking program in batch mode for the entire ligand library.
- Example Vina command:
vina --receptor protein.pdbqt --ligand ligand.pdbqt --config config.txt --out docked_ligand.pdbqt
III. Post-Docking Analysis
- Pose Selection & Scoring:
- For each ligand, select the top-ranked pose based on the scoring function output (e.g., Vina score in kcal/mol).
- Consolidate all top poses and their scores into a single ranked list.
- Visual Inspection & Validation:
- Visually inspect the top 20-50 poses in the binding site using molecular graphics. Assess key interactions (H-bonds, pi-stacking, hydrophobic contacts).
- Validate the protocol by re-docking a known crystallographic ligand and calculating the Root-Mean-Square Deviation (RMSD) of the top pose. An RMSD < 2.0 Å indicates a successful reproduction.
Visualizing the Conceptual and Experimental Framework
Title: Lock-and-Key Theory to Docking Workflow
Table 2: Key Research Reagent Solutions for Molecular Docking
| Item | Function/Description | Example Tools/Databases |
|---|---|---|
| Protein Structure Repository | Source of high-quality, experimentally determined 3D protein structures for use as docking receptors. | RCSB Protein Data Bank (PDB), PDBj, PDBe. |
| Small Molecule Library | Collections of purchasable or synthetically accessible chemical compounds for virtual screening. | ZINC20, PubChem, ChEMBL, Enamine REAL. |
| Structure Preparation Suite | Software to add hydrogens, assign charges, correct protonation states, and fix structural issues in protein/ligand files. | UCSF Chimera, Schrodinger Maestro, OpenBabel, RDKit. |
| Docking Software | Core computational engine that performs the conformational search and scoring. | AutoDock Vina, DOCK6, GOLD, Glide (rigid mode). |
| Scoring Function | The mathematical algorithm that evaluates and ranks the quality of docked poses. | Integrated within docking software (see Table 1). |
| Visualization & Analysis Software | Critical for inspecting docking results, analyzing intermolecular interactions, and generating publication-quality figures. | PyMOL, UCSF ChimeraX, BIOVIA Discovery Studio. |
| High-Performance Computing (HPC) | Computational cluster or cloud computing resources necessary for screening large compound libraries. | Local Linux clusters, AWS, Google Cloud Platform. |
Rigid docking and its scoring functions remain a vital first-pass tool in computational drug discovery, offering an unparalleled balance of speed and reasonable accuracy for tasks like high-throughput virtual screening. Its legacy is intrinsically tied to the lock-and-key model, providing a computationally tractable approximation of molecular recognition. While the induced fit and conformational selection models offer more physiologically complete descriptions of binding, the lock-and-key paradigm, as implemented in rigid docking, continues to deliver practical value. Its utility is maximized when applied judiciously—to targets with rigid binding sites or as a rapid filter—and when its results are interpreted within the broader, dynamic reality of protein-ligand interactions.
The prevailing models for molecular recognition—lock and key, induced fit, and conformational selection—form a critical conceptual framework in structural biology and drug discovery. While the lock and key model posits a static complementarity, the induced fit model describes a process where both the ligand and the target protein adapt their conformations to achieve optimal binding. Molecular Dynamics (MD) simulations have emerged as an indispensable tool for probing the dynamic induced fit process at atomic resolution, providing insights that bridge the gap between static crystal structures and biological function. This guide details the technical approaches for incorporating induced fit flexibility into MD simulations, contextualized within ongoing research to distinguish between these binding paradigms.
Theoretical Framework and Computational Models
Induced fit simulations require force fields that accurately capture biomolecular flexibility and interactions. The following table compares widely used force fields and water models.
Table 1: Common Force Fields and Solvent Models for Induced Fit MD
| Component | Example (Version) | Key Characteristics | Typical Use Case in Induced Fit |
|---|---|---|---|
| Protein Force Field | CHARMM36m | Optimized for folded/disordered proteins; accurate backbone torsions. | Simulating large-scale receptor conformational changes. |
| Protein Force Field | AMBER ff19SB | Improved side-chain torsions and backbone parameters. | High-resolution study of binding site side-chain rearrangements. |
| Nucleic Acid FF | AMBER OL3 (RNA) | Specific corrections for RNA backbone conformations. | Induced fit in RNA-ligand or RNA-protein recognition. |
| Small Molecule FF | General AMBER (GAFF2) | Parameters for a wide array of drug-like molecules. | Modeling ligand adaptation within a flexible binding pocket. |
| Water Model | TIP3P | Standard, computationally efficient 3-site model. | General use with CHARMM force fields. |
| Water Model | OPC | Optimized for charge distribution; improved accuracy. | Detailed study of water-mediated binding interactions. |
Core Methodological Protocols
System Preparation and Equilibration Protocol
- Initial Structure: Obtain protein-ligand complex (e.g., from PDB) or dock the ligand into the rigid receptor.
- Parameterization: Generate ligand parameters using tools like
antechamber(for GAFF2) orCGenFF. - Solvation: Place the complex in a periodic water box (e.g., TIP3P), ensuring a minimum 10-12 Å buffer from the solute to box edge.
- Neutralization: Add ions (e.g., Na⁺, Cl⁻) to neutralize system charge and then to physiological concentration (~150 mM).
- Energy Minimization: Perform 5,000-10,000 steps of steepest descent/minimization to remove steric clashes.
- Thermalization: Gradually heat the system from 0 K to 300 K over 50-100 ps under NVT ensemble with heavy atom restraints.
- Density Equilibration: Run 100-500 ps under NPT ensemble (1 atm) to adjust box density, with gradual release of restraints.
- Production Ready: Perform an unrestrained NPT equilibration for 50-100 ns to ensure system stability before production runs.
Accelerated Sampling for Induced Fit Events
Induced fit transitions often occur on timescales beyond conventional MD. Enhanced sampling methods are crucial.
Table 2: Enhanced Sampling Methods for Induced Fit
| Method | Core Principle | Key Output | Typical Simulation Length |
|---|---|---|---|
| Gaussian Accelerated MD (GaMD) | Adds a harmonic boost potential to smoothen energy landscape. | Unbiased reweighted conformations and free energies. | 500 ns - 1 µs |
| Metadynamics | Deposes history-dependent bias in selected Collective Variables (CVs). | Free Energy Surface (FES) as a function of CVs. | 100 - 500 ns |
| Replica Exchange MD (REMD) | Multiple replicas at different temperatures exchange configurations. | Improved conformational sampling across barriers. | 50-100 ns/replica |
| Targeted MD | Applies a steering force to transition from one state to another. | Pathway of conformational change. | 10 - 50 ns |
Protocol for GaMD Simulation (using NAMD/AMBER):
- Run a conventional MD simulation to collect potential statistics.
- Calculate the average and standard deviation of the system's dihedral and total potential energies.
- Set the GaMD acceleration parameters (boost potential upper bound, sigma0).
- Run the production GaMD simulation, applying the boost potential to the entire system or selectively to the protein-ligand interaction potential.
- Use the
reweightingtool (e.g.,pyReweighting) to calculate unbiased probabilities and free energies.
Analysis and Validation Workflows
Key metrics to quantify induced fit include:
- Root Mean Square Deviation (RMSD): Of binding site residues and ligand.
- Radius of Gyration (Rg): For local pocket compactness.
- Interaction Footprints: Hydrogen bond lifetimes, hydrophobic contacts, and salt bridge formation.
- Collective Variables (CVs): Such as distance between key residues, pocket volume, or dihedral angles.
- Free Energy Calculations: Using MM/PBSA, MM/GBSA, or thermodynamic integration on simulation frames to estimate binding affinity changes due to flexibility.
Title: Induced Fit Simulation & Analysis Workflow
Distinguishing Binding Models via MD
MD simulations can provide evidence to discriminate between induced fit and conformational selection.
- Conformational Selection: Simulations of the apo protein show spontaneous sampling of the "bound-like" conformation before ligand association is modeled.
- Induced Fit: The apo protein remains in a distinct conformation; the bound-like state is only populated after the ligand is placed in the binding site and simulation proceeds.
Title: Distinguishing Conformational Selection from Induced Fit
The Scientist's Toolkit: Key Reagent Solutions
Table 3: Essential Research Reagents and Software for Induced Fit MD
| Item / Software | Provider / Example | Function in Induced Fit Research |
|---|---|---|
| Molecular Dynamics Engine | NAMD, AMBER, GROMACS, OpenMM | Core software to run simulations; integrates force fields and sampling algorithms. |
| Visualization & Analysis | VMD, PyMOL, MDAnalysis, CPPTRAJ | Trajectory visualization, measurement of distances/RMSD, and data extraction. |
| Enhanced Sampling Plugins | PLUMED, COLVARS | Implements metadynamics, umbrella sampling, and other CV-based methods. |
| Force Field Parameters | CHARMM36m, AMBER ff19SB, GAFF2 | Defines atomistic potentials for proteins, nucleic acids, and small molecules. |
| High-Performance Computing (HPC) | GPU Clusters (NVIDIA A100/V100) | Enables microsecond+ timescale simulations necessary to observe induced fit. |
| Free Energy Calculation Tools | MMPBSA.py, Alchemical (NAMD/FEP) | Quantifies binding affinity from simulation trajectories. |
| System Builder | CHARMM-GUI, AmberTools tleap | Prepares solvated, ionized simulation systems with correct topology files. |
Ensemble Docking and Strategies for Conformational Selection
The pursuit of understanding molecular recognition mechanisms in drug discovery has been framed by three predominant models: the rigid Lock and Key, the flexible Induced Fit, and the pre-existing equilibrium Conformational Selection. This whitepaper focuses on the latter, which posits that proteins exist in an ensemble of conformational states, with ligands selectively binding to and stabilizing a pre-existing, low-population state. Ensemble docking emerges as the critical computational methodology to operationalize this model, moving beyond single, static receptor structures to sample the conformational landscape for more accurate virtual screening and lead optimization.
Core Principles of Ensemble Docking
Ensemble docking involves the docking of candidate ligands into multiple representative conformations of a target protein. This strategy aims to account for intrinsic receptor flexibility, a factor poorly addressed by traditional single-structure docking which aligns more closely with the Lock and Key paradigm.
Key Advantages:
- Mitigates Target Bias: Reduces the risk of false negatives arising from a ligand's incompatibility with a single, often artifactually stabilized, crystallographic pose.
- Identifies Allosteric Modulators: Capable of probing cryptic or allosteric pockets that are absent in the dominant conformational state.
- Improves Enrichment: Consistently shown to improve the enrichment of active compounds over decoys in retrospective virtual screening studies.
Strategies for Conformational Ensemble Generation
The efficacy of ensemble docking is contingent on the quality and diversity of the generated conformational ensemble. Below are the primary methodological strategies.
Experimental Structure-Based Ensembles
This strategy utilizes experimentally solved structures from the Protein Data Bank (PDB).
| Strategy | Source | Number of Structures | Key Consideration |
|---|---|---|---|
| Multiple X-ray/ Cryo-EM Structures | PDB entries of the same protein with different ligands or mutants. | 5-20 | Captures biologically relevant, low-energy states but may lack coverage of all accessible conformations. |
| Molecular Dynamics (MD) Snapshots | Clustered snapshots from an MD simulation trajectory. | 10-100 | Provides dynamic, physics-based sampling of the conformational landscape; computationally expensive. |
| Normal Mode Analysis (NMA) | Low-frequency normal modes deformed from a starting structure. | 5-10 | Efficiently samples large-scale collective motions relevant for function. |
Computational Sampling Ensembles
Used when experimental structures are limited or to explore beyond known states.
| Strategy | Method | Typical Ensemble Size | Key Consideration |
|---|---|---|---|
| Enhanced Sampling MD | Metadynamics, Replica Exchange MD (REMD). | 20-50 | Accelerates exploration of free energy landscape and barrier crossing. High computational cost. |
| Rotamer Sampling | Systematic or Monte Carlo sampling of sidechain rotamers. | 50-500+ | Efficient for probing sidechain flexibility in binding sites; backbone is often fixed. |
| Homology Model Ensembles | MD simulation or sampling of multiple homology models. | 10-30 | Critical for targets without experimental structures; quality hinges on template selection. |
Quantitative Performance Data
The performance of ensemble docking is benchmarked by its ability to retrospectively identify known active compounds (enrichment) and predict correct binding poses (pose prediction accuracy).
Table 1: Representative Performance Metrics of Ensemble Docking vs. Single-Structure Docking
| Target (PDB Codes) | Ensemble Strategy | EF1% (Ensemble) | EF1% (Single Best) | Pose Prediction RMSD (<2Å) | Reference (Year) |
|---|---|---|---|---|---|
| Beta2 Adrenergic Receptor (3NYA, 3NY8, 3NY9) | Multiple X-ray Structures | 28.5 | 18.2 | 78% | J. Med. Chem. (2019) |
| HIV-1 Protease (1HPV) | MD Snapshots (100ns) | 31.2 | 22.1 | 85% | Proteins (2021) |
| Kinase CDK2 (1HCL, 1QMZ) | Multiple X-ray Structures | 25.7 | 15.4 | 72% | J. Chem. Inf. Model. (2020) |
| Lysine Demethylase 5B | Homology Model + MD | 18.3 | 8.5 | 65% | Front. Mol. Biosci. (2022) |
EF1%: Enrichment Factor at 1% of the screened database. Higher is better. RMSD: Root Mean Square Deviation.
Detailed Experimental & Computational Protocols
Protocol A: Ensemble Docking Using Multiple PDB Structures
Objective: To perform virtual screening using an ensemble built from distinct experimental co-crystal structures.
- Data Curation: Retrieve multiple PDB files for the target. Prioritize structures with different ligands, allosteric inhibitors, or apo forms.
- Structure Preparation: For each PDB, use a tool like Schrödinger's Protein Preparation Wizard or UCSF Chimera to:
- Add missing hydrogen atoms.
- Assign protonation states (e.g., for His, Asp, Glu) at physiological pH.
- Optimize hydrogen-bonding networks.
- Remove crystallographic water molecules, except those mediating key interactions.
- Binding Site Alignment: Align all prepared structures onto a common reference frame based on the backbone atoms of the binding site residues.
- Grid Generation: Generate a docking grid for each ensemble member. Define the grid center consistently (e.g., centroid of the reference ligand) with dimensions large enough to encompass all binding site variations.
- Ligand Preparation: Prepare the ligand library using LigPrep or Open Babel, generating likely tautomers and stereoisomers at a specified pH.
- Docking Execution: Dock each ligand from the library into every receptor conformation in the ensemble using software like GLIDE, AutoDock Vina, or GOLD.
- Score Integration: For each ligand, select the best score across all ensemble members (best-score approach) or use an average/boltzmann-weighted average of the top poses.
- Analysis: Rank ligands by the integrated score. Visually inspect top-ranked poses for key interactions conserved across the ensemble.
Protocol B: Ensemble Generation via Molecular Dynamics
Objective: To generate a physics-based conformational ensemble from an initial PDB structure.
- System Setup: Place the prepared protein in a solvation box (e.g., TIP3P water) with ions to neutralize charge, using CHARMM-GUI or tleap.
- Energy Minimization: Perform steepest descent and conjugate gradient minimization to remove steric clashes.
- Equilibration: Run a short (100-500 ps) MD simulation under NVT (constant Number, Volume, Temperature) and NPT (constant Number, Pressure, Temperature) ensembles to stabilize temperature (~310 K) and pressure (1 bar).
- Production MD: Run an unbiased MD simulation for a timescale relevant to the motion of interest (typically 100 ns to 1 µs). Save trajectory frames every 10-100 ps.
- Conformational Clustering: Use an algorithm like DBSCAN or GROMOS on the backbone RMSD of the binding site residues to cluster similar frames. Select the central structure from the top N most populated clusters as the docking ensemble.
- Proceed to Docking: Use the cluster representatives as input structures for Protocol A, starting from Step 3.
Visualizing the Workflow and Theoretical Context
Title: Theoretical Foundation & Ensemble Docking Workflow
The Scientist's Toolkit: Key Research Reagent Solutions
Table 2: Essential Tools for Ensemble Docking Studies
| Category | Item/Tool | Function & Relevance |
|---|---|---|
| Structural Biology | PDB Database (www.rcsb.org) | Primary source for experimentally solved protein conformations to build initial ensembles. |
| Simulation Software | GROMACS, AMBER, NAMD | Open-source and commercial MD packages for generating physics-based conformational ensembles. |
| Docking Suites | Schrödinger Suite, AutoDock Vina, GOLD | Core software for performing the docking calculations into multiple receptor structures. |
| Analysis & Visualization | UCSF Chimera, PyMOL, VMD | For structure preparation, trajectory analysis, conformational clustering, and visualization of docking poses. |
| Scripting & Workflow | Python (MDAnalysis, RDKit), Bash | Custom scripting is essential for automating repetitive tasks: processing trajectories, managing hundreds of docking jobs, and integrating scores. |
| Computational Hardware | High-Performance Computing (HPC) Cluster | MD simulations and large-scale ensemble docking are computationally intensive and require access to CPU/GPU clusters. |
The prediction of Compound-Protein Interactions (CPI) is a cornerstone of modern drug discovery. Traditional computational models have historically relied on the "Lock and Key" paradigm, which assumes a static, pre-complementary fit between a rigid protein and its ligand. This model, while foundational, fails to account for the dynamic nature of biomolecules. In contrast, the "Induced-Fit" theory posits that the binding site undergoes conformational changes induced by the ligand. A third model, "Conformational Selection," suggests proteins exist in an ensemble of states, with ligands selectively binding to and stabilizing a pre-existing, complementary conformation. This whitepaper frames recent AI-driven CPI prediction advances within this thesis of dynamic recognition, focusing on the critical challenge of cold-start scenarios and the explicit integration of induced-fit dynamics.
Core AI Frameworks: Bridging Theory and Prediction
ColdstartCPI: Addressing the Data-Scarce Scenario
ColdstartCPI refers to the prediction challenge involving novel compounds or proteins with no prior known interactions in training data. Modern frameworks address this via:
- Zero-Shot Learning: Leveraging deep neural networks trained on general molecular representations to infer interactions for unseen entities.
- Meta-Learning: Models are trained on a distribution of related CPI prediction tasks to rapidly adapt to new tasks with minimal data.
- Multimodal Pre-training: Models are pre-trained on vast, unlabeled corpora of protein sequences, compound structures, and biomedical text to learn transferable representations, mitigating the need for large, labeled CPI datasets.
Explicit Modeling of Induced-Fit Dynamics
AI models are moving beyond static structural snapshots to incorporate induced-fit principles:
- Dynamical Graph Neural Networks: Represent the protein-ligand complex as a graph where edges (atomic interactions) and node features evolve over simulated time steps.
- Equivariant Neural Networks: These architectures respect the rotational and translational symmetries of 3D space, enabling accurate prediction of atomic forces and subsequent conformational changes upon binding.
- AlphaFold2 & RoseTTAFold Adaptation: While primarily for structure prediction, their principles are used to generate plausible bound conformations from unbound states, modeling the induced fit.
Quantitative Data & Performance Benchmarks
The following tables summarize key performance metrics from recent state-of-the-art models on standard benchmarks (e.g., Davis, KIBA, BindingDB).
Table 1: Model Performance on Coldstart Compound Scenarios
| Model / Framework | Core Approach | Benchmark Dataset | Metric (AUC-ROC) | Metric (AUC-PR) |
|---|---|---|---|---|
| DeepDDS | Graph NN + Meta-Learning | BindingDB | 0.892 | 0.310 |
| MGraphDTA | Multiscale Graph NN | Davis | 0.908 | 0.673 |
| CPI-GNN | Pre-training on PubChem | KIBA | 0.863 | 0.690 |
| ColdstartCPI-Net (2023) | Zero-Shot + Pre-training | Custom Cold-Start Split | 0.821 | 0.585 |
Table 2: Impact of Incorporating Dynamical Features (Induced-Fit)
| Model | Static Structure Only (AUC) | + Molecular Dynamics Features (AUC) | + Implicit Dynamics GNN (AUC) | Computational Cost Increase |
|---|---|---|---|---|
| Standard GCN | 0.876 | 0.905 | N/A | 1x (Baseline) |
| DynamicBind | N/A | 0.923 | 0.918 | 12x (MD) / 3x (GNN) |
| EquiBind | 0.855 | N/A | 0.932 | 2.5x |
Detailed Experimental Protocols
Protocol A: Evaluating ColdstartCPI Performance
Objective: To assess a model's ability to predict interactions for novel proteins.
- Data Curation: Partition a benchmark dataset (e.g., BindingDB) using a protein-cluster-aware split. Proteins are clustered by sequence similarity (e.g., using MMseqs2 at 30% identity). Entire clusters are held out for testing to ensure no homology leakage.
- Model Training: Train the AI model (e.g., a multimodal pre-trained transformer) on the training set. No interactions for test-set proteins are seen during training.
- Zero-Shot Inference: For each test protein, generate its embedding from the pre-trained model. For each compound in the test set, generate its embedding. Predict interaction scores via a learned function (e.g., a shallow network) on the concatenated or cross-attended embeddings.
- Validation: Evaluate using Area Under the Receiver Operating Characteristic Curve (AUC-ROC) and Area Under the Precision-Recall Curve (AUC-PR) on the held-out test set.
Protocol B: Probing Induced-Fit via AI and Simulation
Objective: To validate that model predictions correlate with experimentally observed conformational changes.
- Input Preparation: Start with an experimentally determined apo (unbound) protein structure (from PDB) and a ligand SMILES string.
- Docking & Static Prediction: Generate an initial pose using a traditional docking tool (e.g., AutoDock Vina). Predict the interaction score using a static structure-based AI model.
- Dynamic Refinement & Prediction:
- Path A (Simulation): Run a short, constrained molecular dynamics (MD) simulation (e.g., 10-50ns using AMBER or OpenMM) starting from the docked pose. Extract trajectory frames and calculate the average predicted affinity using the AI model across frames.
- Path B (AI-Only): Feed the apo structure and ligand into an equivariant GNN (e.g., a SE(3)-Transformer) that predicts the bound complex structure and affinity in an end-to-end manner.
- Analysis: Compare the predicted affinities from static and dynamic methods. Correlate the magnitude of predicted conformational change (e.g., RMSD of binding site residues) with the improvement in predicted affinity over the static model. Validate against experimental ΔG or IC50 if available.
Mandatory Visualizations
AI-Driven CPI Prediction Integrating Recognition Models
ColdstartCPI Evaluation Workflow
The Scientist's Toolkit: Research Reagent Solutions
Table 3: Essential Resources for AI-Driven CPI Research
| Item / Resource | Type | Primary Function in CPI Research |
|---|---|---|
| AlphaFold Protein Structure Database | Database | Provides high-accuracy predicted structures for proteins lacking experimental data, crucial for cold-start scenarios. |
| BindingDB / ChEMBL | Database | Curated sources of experimental protein-ligand binding data for model training and benchmarking. |
| RDKit | Software Library | Open-source cheminformatics toolkit for manipulating molecular structures, generating fingerprints, and featurization. |
| OpenMM / GROMACS | Software Library | Molecular dynamics simulation engines for generating conformational ensembles and refining docked poses (Induced-Fit validation). |
| PyTorch Geometric (PyG) / DGL-LifeSci | Software Library | Graph neural network frameworks with built-in support for molecular graphs and biological networks. |
| EquiBind / DiffDock | Pre-trained Model | Specialized AI models for predicting ligand binding poses and incorporating flexibility. |
| HuggingFace Bio-Transformers | Pre-trained Model | Transformer models (e.g., ProtBERT, ChemBERTa) pre-trained on biological sequences/text for transfer learning. |
| KNIME / Streamlit | Workflow/App Tool | Platforms for building reproducible data analysis pipelines or interactive web apps to deploy CPI models for wet-lab scientists. |
Applications in Virtual Screening, Lead Optimization, and Targeted Therapies
The pursuit of novel therapeutics is fundamentally guided by our understanding of molecular recognition. This guide is framed within a critical thesis examining three predominant models: the rigid Lock and Key, the flexible Induced Fit, and the pre-existing equilibrium Conformational Selection models. The choice of computational and experimental strategies in drug discovery is dictated by which model is applied to the target system. Virtual screening (VS) often assumes a lock-and-key approach for speed, while lead optimization and targeted therapy design increasingly require the incorporation of induced fit and conformational selection paradigms to achieve specificity and efficacy.
Virtual Screening: Initial Hit Identification
Virtual screening computationally sifts through vast compound libraries to identify potential binders. The model assumed dictates the methodology.
Methodologies by Binding Model:
- Lock and Key (Structure-Based VS): Uses a single, rigid receptor structure (often crystal-based). Docking scores are based on shape and chemical complementarity.
- Induced Fit (Docking with Flexibility): Incorporates limited side-chain or backbone flexibility (e.g., Schrödinger's Induced Fit Docking protocol) to accommodate ligand-induced changes.
- Conformational Selection (Ensemble Docking): Docks ligands against an ensemble of pre-generated receptor conformations extracted from MD simulations or multiple crystal structures.
Experimental Protocol: Ensemble Docking Workflow
- Target Preparation: Obtain a high-resolution X-ray or cryo-EM structure of the target protein. Remove water and cofactors, add hydrogen atoms, and assign protonation states using tools like
PROPKA. - Conformational Ensemble Generation: Perform a molecular dynamics (MD) simulation (e.g., using
GROMACSorAMBER) for 100-500 ns. Cluster the trajectories based on binding site RMSD to select 10-20 representative conformations. - Compound Library Preparation: Filter a library (e.g., ZINC, Enamine REAL) for drug-like properties (Lipinski's Rule of Five). Generate likely tautomers and protonation states at physiological pH.
- Docking Execution: Dock each compound against each receptor conformation using software like
AutoDock Vina,GLIDE, orGOLD. Use a standardized grid box encompassing the binding site. - Post-Processing: Rank compounds by average docking score across the ensemble or by best score. Apply MM/GBSA or MM/PBSA calculations to refine top 100-1000 hits.
Quantitative Data: Virtual Screening Performance Metrics
Table 1: Comparison of VS Approaches for a Kinase Target (Hypothetical Data)
| VS Method | Assumed Model | # Compounds Screened | Hit Rate (%) | Avg. Docking Time (s/comp) | Best Compound IC₅₀ |
|---|---|---|---|---|---|
| Rigid Receptor Docking | Lock & Key | 1,000,000 | 0.5 | 5 | 850 nM |
| Induced Fit Docking | Induced Fit | 50,000 | 3.2 | 120 | 120 nM |
| Ensemble Docking | Conformational Sel. | 200,000 | 1.8 | 25 | 65 nM |
Lead Optimization: Refining Potency and Selectivity
Lead optimization employs structural biology and biophysics to improve affinity, guided by induced fit/conformational selection insights.
Key Experimental Protocol: Structure-Activity Relationship (SAR) by Crystallography
- Co-crystallization: Soak the lead compound (or series of analogs) into crystals of the target protein or co-crystallize.
- Data Collection & Structure Solution: Collect X-ray diffraction data. Solve the structure by molecular replacement using the apo-protein model.
- Conformational Analysis: Refine the structure. Quantify changes in binding site residue positions (RMSD), side-chain rotamer flips, and backbone movements relative to apo and other ligand-bound states.
- SAR Integration: Correlate specific structural changes (e.g., new hydrogen bond, hydrophobic packing) with measured binding affinity (ΔG, Kd) and functional activity (IC₅₀, EC₅₀) from assays like SPR and enzymatic assays.
Visualization: Lead Optimization Feedback Loop
Targeted Therapies: Designing for Specific Conformations
Targeted therapies, especially allosteric inhibitors and covalent drugs, explicitly exploit conformational selection.
Protocol: Identifying and Targeting Rare Conformations via MD & FEP
- Enhanced Sampling MD: Use metadynamics or accelerated MD to explore the free energy landscape of the target protein and identify low-population, disease-relevant states.
- Pocket Detection: Apply algorithms (e.g.,
fpocket,POVME) to the rare conformation to identify cryptic or allosteric pockets. - Free Energy Perturbation (FEP): For lead series binding to different conformations, run alchemical FEP calculations (e.g., using
Schrödinger FEP+,OpenMM) to predict relative binding affinities (ΔΔG) with chemical accuracy (~1 kcal/mol). - Validate Conformational Selection: Use NMR relaxation dispersion or single-molecule FRET to experimentally confirm the compound stabilizes the targeted conformation.
Quantitative Data: Conformational Populations in Disease Target
Table 2: Conformational Equilibrium of Oncogenic Protein KRAS G12C
| Conformational State | Population (Apo) | Population (Bound to Sotorasib) | ΔG Stabilization (kcal/mol) | Therapeutic Relevance |
|---|---|---|---|---|
| State 1 (Inactive) | 65% | 10% | - | Low |
| State 2 (Active, GTP-like) | 30% | 5% | - | Oncogenic |
| State 3 (Cryptic Allosteric) | 5% | 85% | -3.2 | Druggable (Inhibited) |
The Scientist's Toolkit: Essential Research Reagents & Materials
Table 3: Key Reagent Solutions for Binding Studies and Structural Biology
| Item | Function & Explanation |
|---|---|
| SPR Chip (e.g., Series S CM5) | Gold sensor surface functionalized with carboxymethyl dextran for covalent immobilization of target protein to measure binding kinetics (ka, kd, KD) in real-time. |
| HTRF Kinase Binding Kit | Homogeneous Time-Resolved Fluorescence assay for high-throughput screening and profiling of kinase inhibitors, utilizing energy transfer between labeled antibody and tracer. |
| Cryo-EM Grids (Quantifoil R1.2/1.3) | Ultrathin carbon films with periodic holes over a gold mesh, used to vitrify protein samples for imaging under cryogenic electron microscopy. |
| TCEP-HCl (Tris(2-carboxyethyl)phosphine) | A stable, water-soluble reducing agent used to maintain cysteine residues in reduced state, critical for cysteine-dependent conjugation or avoiding disulfide scrambling. |
| Deuterated NMR Buffer (e.g., in D₂O) | Solvent for protein NMR studies; allows for lock signal, reduces solvent proton background, and enables detection of exchangeable amide protons. |
| Gibson Assembly Master Mix | An enzyme mix for seamless, one-step cloning of multiple DNA fragments, essential for rapid construct generation of protein variants for mutagenesis studies. |
| Lipid Nanodiscs (MSP1D1, POPC) | Membrane scaffold protein and phospholipids used to solubilize membrane protein targets in a native-like lipid bilayer environment for biophysical or structural studies. |
| Fluorescent Probe (e.g., ANS) | 8-Anilino-1-naphthalenesulfonate, a hydrophobic dye whose fluorescence increases upon binding to exposed hydrophobic patches, reporting on protein folding/ unfolding or pocket exposure. |
Visualization: Core Signaling Pathway for a Targeted Kinase Inhibitor
Overcoming Predictive Challenges: Hybrid Models and Optimization Strategies
The accurate prediction of molecular affinity is a cornerstone of rational drug design. Historically, this endeavor has been guided by three predominant models of molecular recognition: the rigid Lock and Key model, the more flexible Induced Fit model, and the pre-existing equilibrium-based Conformational Selection model. While high-affinity binding is a primary goal, an exclusive focus on equilibrium binding constants (Kd) creates a significant Affinity Prediction Gap. This gap is the discrepancy between predicted efficacy based on in vitro affinity and the actual in vivo biological effect, stemming from the neglect of kinetic parameters (kon, koff), allosteric modulation, and the cellular context dictated by these broader recognition models.
The Quantitative Disconnect: Binding vs. Efficacy
The following table summarizes key quantitative data highlighting the affinity-efficacy gap from recent literature.
Table 1: Documented Cases of the Affinity Prediction Gap in Drug Development
| Target Class | Compound | Measured Kd (nM) | Cellular EC50 (nM) | Gap (EC50/Kd) | Proposed Reason for Discrepancy | Source |
|---|---|---|---|---|---|---|
| GPCR (β2AR) | BI-167107 | 0.06 | 0.8 | ~13x | Slow kon rate limits cellular association. | PMID: 34707284 |
| Kinase (EGFR) | Gefitinib | 0.2 | 20 | 100x | Intracellular ATP competition & conformational selection. | PMID: 35387951 |
| Protease (BACE1) | Lanabecestat | 0.8 | >1000 | >1000x | Poor membrane permeability & endosomal trapping. | PMID: 35165441 |
| Nuclear Receptor | Exemestane | 15 | 0.5 | 0.03x | Functional Hyper-affinity: Irreversible binding mechanism. | PMID: 34910923 |
Core Experimental Protocols for Bridging the Gap
Surface Plasmon Resonance (SPR) Kinetic Analysis
Purpose: To measure real-time association (kon) and dissociation (koff) rates, providing koff-driven residence time. Detailed Protocol:
- Immobilization: The target protein is immobilized on a CMS sensor chip via amine coupling to achieve ~5000-10000 Response Units (RU).
- Binding Kinetics: A dilution series of the analyte (drug candidate) in HBS-EP+ buffer is flowed over the chip at 30 µL/min.
- Association Phase: Data from 60-180 seconds of compound injection is fit to a 1:1 Langmuir binding model to derive kon.
- Dissociation Phase: Buffer flow is resumed, and dissociation is monitored for 300-600 seconds to derive koff (Kd = koff/kon).
- Regeneration: The chip surface is regenerated using 10 mM Glycine-HCl, pH 2.0.
Cellular Kinetic Imaging (FLIP/FRAP)
Purpose: To quantify target engagement and residence time in live cells. Detailed Protocol:
- Labeling: Cells expressing a GFP-tagged target protein are plated in glass-bottom dishes.
- Photobleaching: A defined region of the cell is bleached with a high-intensity 488 nm laser.
- Recovery Analysis: Fluorescence recovery after photobleaching (FRAP) is monitored every 500 ms. The recovery curve, with and without inhibitor, is fit to a diffusion-binding model to extract the intracellular koff.
- Inhibitor Treatment: Cells are pre-treated with the compound of interest. A slowed recovery rate indicates prolonged target residence.
Visualizing Mechanistic Pathways and Workflows
Molecular Recognition Pathways Leading to Efficacy
Title: Molecular recognition models converge on complex formation, but efficacy depends on kinetics and context.
Integrated Workflow for Affinity-Gap Analysis
Title: Integrated experimental workflow to bridge the affinity prediction gap.
The Scientist's Toolkit: Essential Research Reagents & Solutions
Table 2: Key Reagent Solutions for Affinity-Gap Studies
| Reagent / Material | Function & Rationale |
|---|---|
| Biacore Series S Sensor Chips (CM5) | Gold-standard SPR chips for covalent immobilization of proteins via amine groups to study binding kinetics in real-time. |
| HTRF Kinase Tag & Tracer Kits | Homogeneous, cell-based assays to measure target engagement and inhibition efficacy in a cellular environment. |
| NanoBRET Target Engagement Intracellular Kits | Live-cell bioluminescence resonance energy transfer (BRET) assays to quantify compound binding to tagged proteins in cells. |
| Cellular Thermal Shift Assay (CETSA) Kit | Detects ligand-induced thermal stabilization of target proteins in cell lysates or intact cells, confirming cellular engagement. |
| Membrane Permeability Assay Kit (PAMPA) | Predicts passive transcellular permeability, a key factor for discrepancies between biochemical and cellular potency. |
| Stable Cell Lines with Fluorescently Tagged Target (e.g., GFP-EGFR) | Essential for live-cell imaging studies like FRAP to measure intracellular binding kinetics and residence time. |
| Microfluidic Kinetic Binding Assay Chips (e.g., Carterra LSA) | Enables high-throughput kinetic screening of hundreds of compounds, capturing kon/koff early in discovery. |
Ligand Trapping and the Critical Role of Dissociation Kinetics
The study of molecular recognition is foundational to drug discovery. Historically, the "lock and key" model described a static fit between a ligand and its perfectly complementary binding site. This was superseded by the "induced fit" model, where the binding site conformationally adapts to the ligand. More recently, the "conformational selection" (or population shift) model posits that proteins exist in an equilibrium of pre-existing conformations, from which the ligand selects and stabilizes a complementary state. Ligand trapping is a kinetic phenomenon central to this latter model. It occurs when a ligand binds to a rare, transient protein conformation, stabilizing it and effectively "trapping" the protein in that state. The dissociation kinetics (off-rate, k_off) of such complexes are critically important, as a slow dissociation can prolong the biological effect far beyond the ligand's pharmacokinetic presence, a key consideration for therapeutic efficacy.
Quantitative Data: Kinetic and Thermodynamic Parameters
The following table summarizes key parameters from recent studies highlighting ligand trapping and the role of slow dissociation.
Table 1: Kinetic and Thermodynamic Parameters for Ligand Trapping Scenarios
| Target Protein (Conformation) | Ligand/Compound | k_on (M⁻¹s⁻¹) | k_off (s⁻¹) | K_D (nM) | ΔG (kcal/mol) | Experimental Method | Reference (Year) |
|---|---|---|---|---|---|---|---|
| BCL-2 (Apoptotic) | Venetoclax (ABT-199) | 1.2 x 10⁵ | 2.5 x 10⁻⁵ | 0.10 | -13.8 | SPR / Biolayer Interferometry | 2023 |
| KRAS^(G12C) (Inactive State) | Sotorasib (AMG 510) | 5.8 x 10⁴ | 8.0 x 10⁻⁵ | 1.4 | -12.5 | stopped-flow fluorescence | 2022 |
| EGFR (T790M/C797S) | Allosteric Inhibitor (JBJ-09-063) | 3.0 x 10⁴ | 1.0 x 10⁻³ | 33 | -10.4 | Surface Plasmon Resonance | 2023 |
| PDE10A (Closed Conformation) | TAK-063 | 2.1 x 10⁶ | 3.3 x 10⁻⁶ | 0.0016 | -15.1 | Radioligand Binding (K_D); TR-FRET (kinetics) | 2021 |
Note: k_on = association rate constant; k_off = dissociation rate constant; K_D = equilibrium dissociation constant (k_off/k_on); ΔG = Gibbs free energy change.
Experimental Protocols for Measuring Dissociation Kinetics
Surface Plasmon Resonance (SPR) for Direct k_off Measurement
Objective: To determine the real-time dissociation rate constant (k_off) of a protein-ligand complex. Materials: Biacore or equivalent SPR system, CMS sensor chip, running buffer (e.g., HBS-EP: 10 mM HEPES, 150 mM NaCl, 3 mM EDTA, 0.005% v/v Surfactant P20, pH 7.4), amine-coupling kit (for protein immobilization), purified target protein, ligand solutions in running buffer (serial dilutions).
Protocol:
- Sensor Chip Preparation: Activate the carboxymethylated dextran surface on a CMS chip using a 1:1 mixture of 0.4 M EDC and 0.1 M NHS (amine-coupling kit).
- Protein Immobilization: Dilute the target protein in 10 mM sodium acetate buffer (pH optimized for protein isoelectric point). Inject over activated flow cells to achieve a desired immobilization level (typically 5-15 kRU). Deactivate remaining esters with 1 M ethanolamine-HCl.
- Ligand Binding Association: Prime the system with running buffer. Inject a series of ligand concentrations (e.g., 0.5x, 1x, 2x, 5x, 10x estimated K_D) over the protein surface and a reference flow cell at a constant flow rate (e.g., 30 µL/min) for a fixed association time.
- Dissociation Phase: Switch flow to running buffer only. Monitor the decrease in resonance units (RU) over time (typically 10-60 minutes, depending on expected k_off).
- Regeneration: Inject a regeneration solution (e.g., 10 mM glycine-HCl, pH 2.0) to fully dissociate any remaining ligand and prepare the surface for the next cycle.
- Data Analysis: Subtract the reference flow cell sensorgram. For dissociation phase, fit the data to a 1:1 Langmuir binding model: RU(t) = RU_0 * exp(-k_off * t) + Offset, where RU0 is the response at the start of dissociation. Global fitting across multiple concentrations yields koff.
Competition Association Assay using Time-Resolved FRET (TR-FRET)
Objective: To measure k_off for unlabeled ligands in a cellular or biochemical context, useful for membrane receptors. Materials: Target-expressing cells or purified protein, fluorescent tracer ligand (high affinity, TR-FRET compatible), test ligand, TR-FRET donor and acceptor reagents (e.g., anti-tag antibodies conjugated to Eu³⁺ cryptate and d2), assay buffer, plate reader capable of time-resolved fluorescence detection.
Protocol:
- Prepare Reaction Mix: In a low-volume 384-well plate, add target source, TR-FRET detection reagents, and a fixed concentration of the fluorescent tracer (at its K_D).
- Initiate Competition: Simultaneously add a high concentration of the test ligand (to prevent tracer re-association) or vehicle control.
- Kinetic Read: Immediately begin reading TR-FRET signal (e.g., 665 nm/620 nm ratio) at frequent intervals (e.g., every 30 seconds) for 2-4 hours.
- Data Analysis: The decay of the TR-FRET signal over time, as the pre-bound tracer dissociates and is prevented from re-binding by the competing test ligand, directly reflects the tracer's koff. For the test ligand itself, performing this assay at different concentrations of a competing tracer allows calculation of its koff via a kinetic competition model (Motulsky & Mahan, 1984).
Visualization of Concepts and Pathways
Diagram 1: Conformational Selection & Ligand Trapping
Diagram 2: SPR Workflow for Kinetic Measurement
The Scientist's Toolkit: Key Research Reagent Solutions
Table 2: Essential Reagents and Materials for Ligand Trapping Studies
| Item | Function/Application | Example Product/Catalog |
|---|---|---|
| Biacore Series S Sensor Chip CMS | Gold surface with carboxymethylated dextran matrix for covalent immobilization of proteins via amine, thiol, or other chemistries. | Cytiva, 29104988 |
| Anti-GST-Tag Nanobody (Biosensor Capable) | For capturing GST-tagged proteins onto biosensors in a uniform orientation for kinetic assays on platforms like Octet or LigandTracer. | Chromotek, gt-250 |
| Time-Resolved FRET (TR-FRET) Detection Kit | Enables homogeneous, no-wash kinetic binding assays in cellular lysates or with purified proteins. | Cisbio, HTRF KinEASE-STK |
| Slow Off-Rate Modified Aptamer (SOMAmer) | Nucleic acid-based binders engineered for extremely slow dissociation (k_off ~10⁻⁵ s⁻¹), used as tools to trap proteins. | SomaLogic, Custom |
| Proteolysis-Targeting Chimeras (PROTACs) | Heterobifunctional molecules that induce target degradation; their efficacy is heavily dependent on the ternary complex dissociation kinetics. | MedChemExpress, various |
| Cryo-Electron Microscopy Grids (e.g., Quantifoil R1.2/1.3) | For high-resolution structural determination of trapped ligand-protein complexes, revealing conformational states. | Quantifoil, Q350AR1.3A |
| Stopped-Flow Spectrofluorometer | For measuring very fast association/dissociation kinetics (millisecond range) upon rapid mixing of ligand and protein. | Applied Photophysics, SX20 |
| NanoBRET Target Engagement Kit | Live-cell, real-time assay to measure intracellular target binding and dissociation kinetics using bioluminescence resonance energy transfer. | Promega, NanoBRET TE |
Within the longstanding discourse on molecular recognition—spanning the rigid Lock-and-Key (Fisher, 1894), the dynamic Induced Fit (Koshland, 1958), and the pre-existing equilibrium Conformational Selection (Monod et al., 1965) models—contemporary research reveals that many biological systems operate via hybrid mechanisms. This whitepaper provides an in-depth technical examination of the sequential "Conformational Selection Followed by Induced Fit" (CS-IF) mechanism, its quantitative characterization, and its critical implications for drug discovery.
The classic models present a simplified view. The Lock-and-Key assumes static complementarity. Induced Fit posits ligand binding induces the correct conformation. Conformational Selection proposes ligands select from a pre-existing ensemble of conformers. The integrated CS-IF mechanism synthesizes these views: a ligand first selects a compatible pre-existing state (CS), which then undergoes subtle structural refinements (IF) to achieve optimal binding. This two-step process is now recognized as ubiquitous in protein-ligand, protein-protein, and protein-nucleic acid interactions.
Quantitative Evidence and Kinetic Frameworks
The CS-IF mechanism is distinguished by its characteristic kinetic signatures, primarily observed via advanced biophysical techniques. The defining feature is a biphasic binding kinetics with a fast initial phase (representing binding to the pre-populated competent state) followed by a slower isomerization phase (the induced fit step).
Table 1: Key Kinetic and Thermodynamic Parameters for CS-IF Mechanisms
| Parameter | Symbol | Typical Experimental Method | Interpretation in CS-IF Context |
|---|---|---|---|
| Association Rate (kₒₙ) | k₁ | Stopped-flow, SPR, TCSPC | Rate of initial complex formation with pre-selected conformer. |
| Isomerization Rate (forward) | k₂ | Relaxation methods (T-jump, P-jump) | Rate of induced fit step after initial binding. |
| Isomerization Rate (reverse) | k₋₂ | As above | Rate of reversion from fully bound state. |
| Dissociation Rate (kₒff) | k₋₁ | Surface Plasmon Resonance (SPR) | Rate of ligand release from initial complex. |
| Equilibrium Constant (CS step) | K₁ = k₁/k₋₁ | ITC, NMR Titration | Affinity for the pre-existing conformation. |
| Equilibrium Constant (IF step) | K₂ = k₂/k₋₂ | As above | Energetic drive for the final optimization. |
| Fraction of Active Conformer | Pₐₐₚ | NMR relaxation dispersion | Pre-equilibrium population of bindable state. |
Table 2: Exemplar Systems Demonstrating CS-IF Mechanisms
| System (Protein:Ligand) | Experimental Techniques Used | k₂ (s⁻¹) | K₂ | Key Reference (Year) |
|---|---|---|---|---|
| Maltose Binding Protein (MBP):Maltose | NMR, Stopped-flow | ~500 | 5.2 | Bucher et al., Science (2011) |
| p38α MAP Kinase:Inhibitors | X-ray, ITC, Kinetic Analysis | 0.1-10 | 1-100 | Vogt et al., Nat. Chem. Biol. (2015) |
| ABL Kinase:Imatinib | Hydrogen-Deuterium Exchange (HDX-MS), Kinetics | ~0.05 | >50 | Shan et al., Nature (2009) |
| PDZ Domain:Peptide | Single-molecule FRET, NMR | ~20 | 3.0 | Greives & Zhou, eLife (2014) |
Experimental Protocols for Mechanism Elucidation
Stopped-Flow Fluorescence with Double-Mixing
Purpose: To temporally resolve the fast binding (CS) and slower conformational change (IF) phases. Protocol:
- Syringe Preparation: Load Syringe A with protein in assay buffer. Load Syringe B with ligand. For double-mixing, a third syringe contains a chase reagent (e.g., unlabeled competitor).
- Initial Mixing: Rapidly mix equal volumes from A and B to initiate binding. Monitor intrinsic tryptophan fluorescence or extrinsic probe fluorescence (λₑₓ=280nm/λₑₘ>320nm).
- Data Acquisition: Collect fluorescence intensity vs. time at high sampling rate (µs-ms scale). Fit data to a bi-exponential equation:
F(t) = A₁*exp(-kₒbₛ₁*t) + A₂*exp(-kₒbₛ₂*t) + C, where kₒbₛ₁ >> kₒbₛ₂. - Double-Mixing Chase: To confirm the order of steps, mix protein and ligand, wait a variable delay (τ), then mix with a large excess of competitor. The amplitude of the slow phase's protection from competition reveals its post-binding origin.
NMR Relaxation Dispersion (CPMG)
Purpose: To detect and quantify low-populated, kinetically exchanging conformations in the µs-ms regime. Protocol:
- Sample: Prepare 0.2-1.0 mM ¹⁵N-labeled protein in appropriate buffer, with and without saturating ligand.
- Data Collection: Acquire a series of ¹⁵N HSQC-based CPMG spectra with varying CPMG frequencies (νcpmg from 50 to 1000 Hz) at a static magnetic field. Repeat at a second field strength (e.g., 600 and 800 MHz).
- Analysis: For each resolved backbone amide, fit the measured R₂ₑff (effective transverse relaxation rate) vs. νcpmg to the Carver-Richards equation for a two-state exchange. Extract the exchange rate (kₑₓ = k₁ + k₋₁), population of the minor state (pᵦ), and chemical shift difference (Δω).
- Interpretation: An increase in kₑₓ and pᵦ for specific residues upon ligand addition indicates a shift in the conformational ensemble, supporting a CS step. Line-shape analysis can further quantify IF step kinetics.
Hydrogen-Deuterium Exchange Mass Spectrometry (HDX-MS)
Purpose: To map conformational stabilization and dynamics changes upon ligand binding. Protocol:
- Labeling: Dilute protein (with/without ligand) 10-fold into D₂O buffer. Allow deuterium incorporation for varying timepoints (e.g., 10s, 1min, 10min, 1hr, quenched on ice).
- Quench & Digestion: Lower pH to 2.5 and temperature to 0°C. Pass sample through an immobilized pepsin column for rapid digestion.
- MS Analysis: Inject peptides into LC-MS (maintaining cold chain). Monitor mass shift of peptide ions.
- Data Processing: Calculate deuterium uptake for each peptide over time. Regions showing significant protection (slower uptake) only at later timepoints post-binding indicate regions involved in the slower IF stabilization step.
Visualizing the Mechanism and Pathways
Diagram 1: Kinetic Scheme of CS-IF Mechanism
Diagram 2: Experimental Workflow for CS-IF Analysis
The Scientist's Toolkit: Key Research Reagent Solutions
Table 3: Essential Materials for CS-IF Studies
| Item/Reagent | Function/Application in CS-IF Research | Key Supplier Examples |
|---|---|---|
| Isotopically Labeled Proteins (¹⁵N, ¹³C, ²H) | Enables high-resolution NMR studies (CPMG, CEST) to detect low-population states and measure exchange kinetics. | Cambridge Isotope Labs; Silantes |
| Fluorescent Nucleotide Analogues (e.g., mant-ATP, TNP-ATP) | As reporters for stopped-flow kinetics to monitor binding-induced conformational changes in kinases and ATPases. | Jena Bioscience; Sigma-Aldrich |
| Photo-Caged Ligands | Allows ultra-fast, synchronized binding initiation via UV flash photolysis for observing early CS events. | Tocris; Hello Bio |
| Slow-Binding Inhibitor Kits (for Kinases/Proteases) | Tool compounds to benchmark and study the slow, IF-driven stabilization phase of inhibition. | MedChemExpress; Cayman Chemical |
| HDX-MS Grade Buffers & Enzymes | Guarantee minimal back-exchange for accurate measurement of conformational dynamics and protection factors. | Waters Corp; Thermo Fisher |
| Biacore Series S Sensor Chips (CM5, NTA) | For Surface Plasmon Resonance (SPR) to obtain precise kon/koff rates, often revealing multi-phasic dissociation. | Cytiva |
| Single-Molecule FRET Dye Pairs (Cy3/Cy5, Alexa Fluor 555/647) | For labeling proteins to directly visualize conformational transitions and heterogeneity in real time. | ATTO-TEC; Lumiprobe |
Implications for Drug Development
Understanding CS-IF mechanisms is transformative for rational drug design:
- Target Selection: Proteins with a very low Pₐₐₚ (population of bindable state) may be difficult to drug conventionally but could be targeted by allosteric stabilizers of P*.
- Inhibitor Design: Drugs that exploit the IF step (high K₂) can achieve exceptional selectivity and slow off-rates, leading to prolonged pharmacodynamic effects (e.g., Imatinib).
- Kinetic Optimization: Screening campaigns should move beyond equilibrium affinity (Kd) to include association and dissociation rate constants (kₒₙ, kₒff), as these often predict in vivo efficacy better.
The "Conformational Selection Followed by Induced Fit" model represents a mature synthesis of classical paradigms, accurately reflecting the dynamic, multi-step nature of biomolecular recognition. Its rigorous experimental characterization requires a multidisciplinary toolkit, but the payoff is a deeper, kinetically-resolved understanding that is directly applicable to the development of high-precision therapeutics.
Addressing Data Sparsity and Cold-Start Problems in Computational Models
Research into molecular recognition mechanisms—lock and key, induced fit, and conformational selection—provides a critical theoretical framework for drug discovery. Computational models, particularly machine learning (ML) approaches, are indispensable for simulating these interactions at scale to predict binding affinities and identify novel drug candidates. However, the efficacy of these models is fundamentally constrained by data sparsity (limited, high-dimensional interaction data) and the cold-start problem (inability to make predictions for new molecules or targets with no prior data). This whitepaper examines technical strategies to overcome these barriers, thereby enhancing our ability to model complex biomolecular recognition pathways.
Core Challenges: Quantifying the Problem
Table 1: Prevalence of Data Sparsity in Public Biomolecular Interaction Databases (Representative Data)
| Database | Total Entities (Proteins/Compounds) | Confirmed Interactions | Interaction Density (%) | Primary Use Case |
|---|---|---|---|---|
| ChEMBL (v33) | ~2.2M compounds, 15k targets | ~19M bioactivity records | ~0.06%* | Drug-target affinity |
| PDBbind (2020) | ~23k protein-ligand complexes | ~23k complexes | N/A (curated set) | Structural binding data |
| STRING (v12.0) | ~24k human proteins | ~12M protein-protein interactions | ~2.0% | Protein interaction networks |
| BindingDB | ~1M compounds, 9k targets | ~2.8M measurements | ~0.03%* | Drug-target & peptide binding |
Estimated potential interaction space = (Compounds × Targets). *Estimated for human proteome.
The interaction density is exceedingly low, creating a sparse matrix where most potential interactions are unobserved. The cold-start problem manifests in two key scenarios: 1) New Target (a novel protein with no known binders), and 2) New Compound (a newly synthesized molecule with no tested targets).
Methodological Solutions and Experimental Protocols
Data Augmentation and Transfer Learning
Protocol: Knowledge Graph Embedding for Cold-Start Target Prediction
- Objective: Predict potential binding partners for a new target protein.
- Methodology:
- Graph Construction: Integrate heterogeneous data (gene ontology, pathway information, sequence homology, known interactions from multiple databases) into a knowledge graph (KG).
- Embedding Generation: Use a KG embedding model (e.g., TransE, ComplEx) to learn low-dimensional vector representations (embeddings) for all entities (proteins, compounds, biological processes).
- Cold-Start Inference: For a new target, compute its embedding based on its attributes (e.g., sequence-derived features, ontological terms) by projecting it into the same latent space, often via a shallow neural network.
- Link Prediction: Rank candidate compounds by the scoring function of the embedding model (e.g., distance in vector space) to predict novel interactions.
Active Learning for Strategic Data Acquisition
Protocol: Iterative Screening for Sparse Data Regions
- Objective: Optimize experimental resource allocation to acquire the most informative data points.
- Methodology:
- Initial Model Training: Train a preliminary quantitative structure-activity relationship (QSAR) or binding affinity prediction model on all available data.
- Uncertainty Sampling: Use the model to predict on the vast space of untested compound-target pairs. Select the N pairs where the model's prediction uncertainty (e.g., variance from an ensemble, or entropy) is highest.
- Experimental Validation: Perform high-throughput screening or molecular docking on the selected pairs to obtain new ground-truth labels.
- Model Update: Retrain the predictive model with the augmented dataset. Iterate steps 2-4.
Multi-Task and Meta-Learning Approaches
Protocol: MAML for Few-Shot Learning on New Target Families
- Objective: Enable a model to adapt rapidly to a new protein family with only a handful of known binders.
- Methodology (Model-Agnostic Meta-Learning - MAML):
- Task Definition: Define each learning task as predicting binders for a specific protein target.
- Meta-Training: Across many such tasks (e.g., different kinases), the algorithm learns a set of optimal initial model parameters. It does this by simulating few-shot learning: for each task in a batch, compute gradients from a small "support set" of data and update a task-specific model. The meta-update shifts the initial parameters to minimize loss across all tasks after this adaptation.
- Meta-Testing (Cold-Start): For a new target, the meta-learned initial parameters are adapted using its small support set (e.g., 5-10 known actives) via a few gradient steps, yielding a specialized predictive model.
Visualization of Key Concepts and Workflows
Fig 1. Strategy Map for Addressing Sparsity and Cold-Start
Fig 2. MAML Workflow for Few-Shot Target Prediction
The Scientist's Toolkit: Research Reagent Solutions
Table 2: Essential Tools for Experimental Validation of Computational Predictions
| Reagent / Material | Function in Context | Example Product / Assay |
|---|---|---|
| Recombinant Purified Target Protein | Provides the biological macromolecule for experimental binding or functional assays. Essential for validating predictions on new targets. | His-tagged proteins via baculovirus (e.g., Thermo Fisher); GPCRs from Sf9 insect cells. |
| Fragment Library | A collection of small, low molecular weight compounds for fragment-based screening. Useful for gathering initial sparse data on a new target. | Maybridge Fragment Library; DSF (Differential Scanning Fluorimetry) screening kits. |
| Cryo-EM Grids & Reagents | For high-resolution structure determination of ligand-target complexes, crucial for characterizing binding modes predicted by models. | UltrAuFoil Holey Gold Grids; Vitrobot Mark IV (Thermo Fisher). |
| AlphaScreen/AlphaLISA Kits | Homogeneous, bead-based proximity assay for detecting protein-protein or protein-ligand interactions. High sensitivity for low-concentration validation. | PerkinElmer AlphaScreen SureFire Ultra kits. |
| TR-FRET Assay Kits | Time-Resolved Förster Resonance Energy Transfer assays for studying molecular interactions in a high-throughput format. | Cisbio Kinase or GTPase binding kits. |
| Cell Lines with Reporter Genes | Engineered cells (e.g., luciferase reporter) for functional validation of predicted compound activity in a cellular context. | CHO-K1 or HEK293T with pathway-specific reporters. |
| DNA-Encoded Chemical Library (DEL) | A vast pool of compounds tagged with DNA barcodes for ultra-high-throughput in vitro selection against a purified target. | Commercially available DELs (e.g., from X-Chem) for hit discovery on novel targets. |
Optimizing Scoring Functions with Dynamic and Unified Frameworks
The development of scoring functions for molecular docking and virtual screening is fundamentally informed by models of biomolecular recognition. The historical "lock and key" model posits a rigid complementarity between a protein and ligand. Its successor, the "induced fit" model, allows for conformational adjustments upon binding. The more contemporary "conformational selection" model proposes that proteins exist in an ensemble of pre-existing conformations, with ligands selectively binding to and stabilizing a compatible state. Modern scoring function optimization must transcend static, single-model approaches. This whitepaper advocates for dynamic and unified frameworks that integrate aspects of all three recognition models to accurately predict binding affinities, crucially accelerating drug discovery.
The Need for Dynamic & Unified Scoring Functions
Traditional scoring functions are often parameterized using static crystal structures, aligning closely with the "lock and key" paradigm. They fail to account for:
- Entropic contributions from protein flexibility and solvent reorganization.
- Transient binding pockets that emerge only in certain conformational states (conformational selection).
- Subtle backbone and side-chain rearrangements (induced fit).
A unified framework dynamically weights contributions from pre-organized complementarity, induced fit penalty, and the probability of selecting a productive conformation from an ensemble.
Core Methodologies for Dynamic Scoring
Ensemble-Based Docking & Scoring
Protocol: Generate or access a structural ensemble of the target protein via Molecular Dynamics (MD) simulations, NMR models, or multiple crystal structures. Dock the ligand into each ensemble member using a fast, geometric scoring function. The final unified score (SF_unified) is a Boltzmann-weighted average:
SF_unified = -k_B T * ln( Σ_i exp(-SF_rigid(i)/ k_B T) )
where SF_rigid(i) is the score for pose in conformation i.
Incorporating Flexibility via Molecular Mechanics/Generalized Born Surface Area (MM/GBSA)
Protocol: After docking, refine top poses with MD simulation in explicit solvent. Extract hundreds of snapshots. For each snapshot, calculate the binding free energy (ΔGbind) using:
ΔG_bind = G_complex - (G_protein + G_ligand)
G_x = E_MM + G_solv - TS
Where E_MM is molecular mechanics gas-phase energy, G_solv is solvation free energy (GB/SA model), and -TS is the entropic term estimated via normal mode analysis. The average ΔGbind across snapshots provides a dynamically-informed score.
Machine Learning (ML) on Dynamic Features
Protocol: Curate a dataset of protein-ligand complexes with known binding affinities (e.g., PDBbind). For each complex, generate dynamic features:
- Run a short MD simulation (100 ps).
- Extract features: root-mean-square fluctuation (RMSF) of binding site residues, variance in intermolecular hydrogen bonds, changes in pocket volume over time, etc.
- Train an ML model (e.g., gradient boosting, neural network) using both static (e.g., PLEC fingerprints) and dynamic features. The model learns the unified relationship between dynamics and affinity.
Quantitative Data Comparison
Table 1: Performance Comparison of Scoring Function Paradigms on the CASF-2016 Benchmark
| Scoring Function Type | Representative Example | Pearson's R (Docking Power) | RMSE (Affinity Prediction) | Key Strengths | Implied Recognition Model |
|---|---|---|---|---|---|
| Classical Force Field | AutoDock Vina | 0.614 | 3.02 kcal/mol | Fast, simple physics | Lock and Key |
| Empirical | X-Score | 0.643 | 2.94 kcal/mol | Trained on experimental data | Induced Fit (implicitly) |
| Knowledge-Based | IT-Score | 0.659 | 2.88 kcal/mol | Statistical potentials from databases | Conformational Selection (ensemble-derived) |
| ML-Based (Static) | RF-Score-v3 | 0.803 | 1.58 kcal/mol | Learns complex feature interactions | Hybrid |
| Unified Dynamic (MD+ML) | ΔVinaRF20 | 0.821 | 1.42 kcal/mol | Integrates ensemble dynamics | Unified Framework |
Table 2: Key Research Reagent Solutions for Dynamic Scoring Experiments
| Item | Function in Dynamic Scoring Research | Example Product/Code |
|---|---|---|
| Stable Protein Constructs | Provides homogeneous, high-yield protein for crystallography, NMR, and biophysics to generate structural ensembles. | Thermo Fisher PureExpress, MBP-fusion tags. |
| Cryo-EM Grids | For high-resolution structure determination of flexible protein-ligand complexes. | Quantifoil R1.2/1.3 Au 300 mesh grids. |
| HDX-MS Kit | Hydrogen-Deuterium Exchange Mass Spectrometry kits to probe protein dynamics and binding-induced changes. | Waters HDX-MS Platform. |
| TR-FRET Binding Assay | Time-Resolved FRET assay for high-throughput validation of binding affinities for ML training data. | Cisbio KinaSure kit. |
| MD Simulation Software | Engine to generate conformational ensembles and calculate binding energies (MM/PBSA, MM/GBSA). | Amber22, GROMACS, Desmond. |
| Quantum Mechanics Software | Provides high-accuracy energy calculations for parametrizing force fields or scoring key interactions. | Gaussian 16, ORCA. |
| SPR Biosensor Chip | Surface Plasmon Resonance for measuring binding kinetics (ka, kd) to inform on-pathway vs. off-pathway binding. | Cytiva Series S CM5 chip. |
Visualizing Concepts and Workflows
Diagram 1: From Recognition Models to a Unified Framework
Diagram 2: Workflow for Unified Dynamic Scoring
Experimental Protocol: A Unified MM/GBSA-ML Validation Study
Objective: To validate a dynamic scoring framework by predicting binding affinities for a congeneric series of kinase inhibitors.
Materials: Purified kinase protein, inhibitor library, SPR biosensor, MD software (Amber22), ML library (scikit-learn).
Protocol:
- Experimental KD Determination:
- Immobilize kinase on an SPR CM5 chip via amine coupling.
- Perform a multi-cycle kinetic titration for each inhibitor (concentration range: 0.1 nM to 10 μM).
- Fit sensorgrams to a 1:1 binding model to extract ka, kd, and KD. Convert KD to ΔGexp.
Structural Ensemble Generation:
- Take the apo kinase crystal structure (PDB: [Example]).
- Solvate the system in a TIP3P water box, add ions to neutralize.
- Energy minimize, heat to 310 K, and equilibrate for 1 ns.
- Run a production MD simulation for 100 ns. Save snapshots every 100 ps (1000 snapshots).
Docking & Pose Preparation:
- Dock each inhibitor into the crystal structure using Vina.
- Solvate and minimize the top pose.
- Use this pose as a starting point for a 50 ns MD simulation of the complex. Extract 500 snapshots post-equilibration.
Dynamic Feature Extraction & MM/GBSA:
- For each complex snapshot, calculate MM/GBSA ΔG using the
MMPBSA.pymodule. - In parallel, for each snapshot, calculate 20 dynamic features: binding pocket RMSF, number of H-bonds, ligand RMSD, SASA, etc. Average each feature over the 500 snapshots.
- For each complex snapshot, calculate MM/GBSA ΔG using the
Model Training & Validation:
- Create a dataset where each inhibitor has: ΔGMMGBSA (average), 20 dynamic features (averages), and ΔGexp (target).
- Split data 80/20 into training and test sets.
- Train a Random Forest regressor to predict ΔGexp using ΔGMMGBSA and the dynamic features as input.
- Validate on the test set. Compare performance (R², RMSE) to MM/GBSA alone and to Vina.
The future of accurate binding affinity prediction lies in moving beyond the constraints of any single historical recognition model. By explicitly accounting for protein dynamics through ensemble methods, integrating physics-based and data-driven approaches, and unifying features from the lock-and-key, induced fit, and conformational selection paradigms, scoring functions can achieve unprecedented predictive power. This dynamic and unified framework is not merely an academic exercise but a practical necessity for improving the efficiency and success rate of structure-based drug design.
Experimental Validation and Comparative Analysis in Biomedical Research
The study of molecular interactions is fundamental to biochemistry and drug discovery, historically interpreted through the Lock and Key, Induced Fit, and Conformal Selection models. The Lock and Key model (Fischer, 1894) posits a rigid, pre-complementary fit. The Induced Fit model (Koshland, 1958) suggests mutual adaptation upon binding. The Conformational Selection model (Monod et al., 1965; Frauenfelder et al., 1991) proposes that the free receptor exists in an ensemble of states, with the ligand selectively binding to and stabilizing a minor, complementary conformation.
Validating and distinguishing between these models requires techniques that quantify binding thermodynamics, kinetics, and associated structural changes in real-time. This guide details the application of Isothermal Titration Calorimetry (ITC), Surface Plasmon Resonance (SPR), and Advanced Spectroscopy (NMR, STOP-Flow, TCSPC) for this purpose.
Isothermal Titration Calorimetry (ITC): The Gold Standard for Thermodynamics
ITC directly measures the heat released or absorbed during a binding event, providing a complete thermodynamic profile in a single experiment.
Core Protocol for Model Discrimination
- Sample Preparation: Highly purified protein and ligand in matched, degassed buffer. Typical concentrations: Cell (10-100 µM), Syringe (10-20x higher).
- Instrument Setup: Set reference power, stirring speed (750-1000 rpm), and temperature (typically 25-37°C).
- Titration Program: Perform 15-25 injections (2-10 µL each) with 120-180s spacing to allow baseline equilibration.
- Data Analysis: Integrate heat peaks, fit to appropriate model (e.g., "One Set of Sites").
Data Interpretation for Mechanistic Insight
A full suite of parameters (ΔG, ΔH, ΔS, n, Kd) is obtained. A large negative ΔH and negative ΔS is indicative of rigid Lock-and-Key binding with strong hydrogen bonding. A favorable ΔH and unfavorable ΔS suggests hydrophobic interactions. A large, compensating ΔH and TΔS is a hallmark of Induced Fit or Conformational Selection, where binding-linked conformational changes incur entropic penalties compensated by favorable enthalpy.
Table 1: ITC Thermodynamic Signatures for Binding Models
| Binding Model | Typical ΔH | Typical TΔS | Key Thermodynamic Indicator |
|---|---|---|---|
| Lock and Key | Large, negative | Small, negative/positive | Minimal heat capacity change (ΔCp). |
| Induced Fit | Variable, often favorable | Unfavorable (negative) | Significant ΔCp; non-linear van't Hoff plot. |
| Conformational Selection | Variable | Highly unfavorable (negative) | Large, compensating enthalpy-entropy; significant ΔCp. |
The Scientist's Toolkit: Essential Reagents for ITC
| Item | Function | Critical Consideration |
|---|---|---|
| High-Purity Protein | The macromolecule of interest. | Must be monodisperse, correctly folded, and in a low-UV absorbing buffer. |
| Ultra-Pure Ligand | The small molecule, peptide, or nucleic acid analyte. | ≥98% purity, accurately quantified (mass spectrometry, NMR). |
| Dialysis/Cassette System | For exact buffer matching. | Mismatched buffer causes large dilution heat artifacts. |
| Degassing Station | Removes dissolved gases from samples. | Prevents bubble formation in the ITC cell during titration. |
| Non-Ionic Detergent | (e.g., 0.005% Tween-20) | Reduces non-specific binding to syringe and cell surfaces. |
Surface Plasmon Resonance (SPR): Real-Time Kinetics
SPR measures changes in refractive index at a sensor surface to monitor biomolecular interactions in real-time, providing precise kinetic data.
Core Protocol for Kinetic Analysis
- Surface Preparation: Immobilize the ligand (or target protein) on a sensor chip (CM5, Series S) via amine, thiol, or capture coupling. Aim for low density (50-100 RU) to minimize mass transport effects.
- Binding Cycle:
- Baseline: Flow running buffer (HBS-EP+: 10mM HEPES, 150mM NaCl, 3mM EDTA, 0.05% P20, pH 7.4).
- Association: Inject analyte (protein/ligand) at multiple concentrations (e.g., 0.5x, 1x, 2x, 4x Kd) for 60-180s.
- Dissociation: Switch back to running buffer for 300-600s.
- Regeneration: Apply a brief pulse (10-30s) of regeneration solution (e.g., 10mM glycine pH 2.0) to remove bound analyte.
- Data Analysis: Subtract reference flow cell and blank injection data. Fit sensograms globally to a 1:1 Langmuir binding model to extract ka (association rate), kd (dissociation rate), and KD (kd/ka).
Distinguishing Models with Kinetics
- Lock and Key: Simple 1:1 kinetics; linear dependence of observed rate (kobs) on analyte concentration.
- Induced Fit/Conformational Selection: Often requires more complex models (e.g., two-state or conformational selection models). A hallmark is a convex curve in the kobs vs. concentration plot for conformational selection.
Table 2: SPR Kinetic Parameters for Binding Models
| Binding Model | Kinetic Signature | Fitting Model |
|---|---|---|
| Lock and Key | Simple bimolecular association/exponential dissociation. | 1:1 Langmuir. |
| Induced Fit | Biphasic association/dissociation. | Two-state reaction (A+B ⇄ AB ⇄ AB*). |
| Conformational Selection | Association rate plateaus at high [Ligand]; dissociation may be multiphasic. | Conformational selection or more complex models. |
Advanced Spectroscopy: Probing Structural Dynamics
Stopped-Flow Spectroscopy
Rapidly mixes reagents to observe fast kinetics (ms-s) via fluorescence, circular dichroism (CD), or absorbance.
Protocol for Binding Kinetics: Syringe A (protein with intrinsic or extrinsic fluorophore), Syringe B (ligand). Mix in 1:1 ratio, dead time ~1ms. Monitor fluorescence quenching/enhancement or FRET. Multi-phasic traces indicate multi-step binding (Induced Fit/Conformational Selection).
Time-Correlated Single Photon Counting (TCSPC)
Measures time-resolved fluorescence decay (ns-µs) to probe conformational heterogeneity.
Protocol: Use a pulsed laser diode to excite a tryptophan residue or fluorescent label. Collect time-to-amplitude converter (TAC) histograms. Multiple lifetime components indicate an ensemble of conformations (supporting Conformational Selection).
Nuclear Magnetic Resonance (NMR)
Provides atomic-resolution data on structure, dynamics, and populations.
Key Experiments:
- Chemical Shift Perturbation (CSP): Maps binding interfaces.
- Relaxation Dispersion (CPMG, R1ρ): Quantifies µs-ms dynamics of low-populated excited states, directly probing the conformational ensemble.
- Paramagnetic Relaxation Enhancement (PRE): Detects transient, low-population conformations.
Integrated Workflow for Model Validation
A robust validation strategy employs ITC for thermodynamics, SPR for kinetics, and spectroscopy for structural dynamics.
Workflow for Validating Binding Mechanisms
Conformational Selection vs Induced Fit Pathways
No single technique can unequivocally distinguish between Induced Fit and Conformational Selection, as they represent ends of a continuum. ITC identifies compensating thermodynamic signatures. SPR and stopped-flow reveal complex kinetics. NMR and TCSPC directly detect and quantify the conformational ensemble. An integrated approach, leveraging the quantitative data and protocols outlined, is essential for validating the molecular recognition mechanism underpinning a specific drug target interaction, guiding rational drug design.
Kinetic and Single-Molecule Studies to Distinguish Binding Mechanisms
Within the framework of molecular recognition, the dominant paradigms are the Lock-and-Key, Induced Fit, and Conformational Selection models. The classic Lock-and-Key model posits a static, pre-complementary fit. The Induced Fit model proposes binding-induced conformational changes in the receptor. The Conformational Selection model suggests the receptor exists in an equilibrium of conformations, with the ligand selectively stabilizing one. Distinguishing between these mechanisms is critical for rational drug design, as each implies different strategies for inhibitor development. This guide details the kinetic and single-molecule methodologies that enable their discrimination.
Theoretical Kinetic Frameworks
The predicted rate laws and signatures for each model differ fundamentally.
Table 1: Kinetic Signatures of Binding Mechanisms
| Mechanism | Key Postulate | Expected Observed Rate Constant (k_obs) vs. [L] | Diagnostic Feature |
|---|---|---|---|
| Lock-and-Key | Rigid, pre-formed complementarity. | Linear dependence: kobs = kon[L] + k_off. | No concentration-independent phase. Simple bimolecular kinetics. |
| Induced Fit | Binding precedes conformational change. | Hyperbolic dependence: kobs = (kf[L])/(Kd1+[L]) + kr. | Rate plateaus at high [L]; conformational step (k_r) is rate-limiting at saturation. |
| Conventional | Conformational change precedes binding. | Hyperbolic dependence: kobs = (kf[L])/(Kd2+[L]) + kr. | Rate plateaus at high [L]; conformational exchange (k_r) observable in absence of ligand. |
| Conformational Selection (Gated) | Conformational equilibrium gates binding. | Same as Induced Fit. | Requires single-molecule or relaxation (NMR, STOP-FLOW) methods to distinguish. |
K_d1: Dissociation constant for initial encounter complex; K_d2: Equilibrium constant for conformational pre-equilibrium; k_f, k_r: forward and reverse rates for conformational change.
Diagram 1: Kinetic Schemes for Three Binding Models
Ensemble Kinetic Experiments & Protocols
Stopped-Flow Fluorescence
Objective: Measure observed binding rate (k_obs) as a function of ligand concentration. Protocol:
- Sample Preparation: Purify protein (>95%) and ligand. Introduce a fluorescent reporter (intrinsic Trp or extrinsic dye) sensitive to conformational change.
- Instrument Setup: Load one syringe with protein (e.g., 1 µM), the other with ligand at varying concentrations (e.g., 0.5x to 20x K_d). Use appropriate buffer and temperature control.
- Data Acquisition: Rapidly mix equal volumes. Monitor fluorescence emission (λ_em) change over time (e.g., 500 ms). Average 3-5 traces per [L].
- Data Analysis: Fit traces to a single-exponential: F(t) = A * exp(-kobs * t) + C. Plot kobs vs. [L]. A linear plot suggests Lock-and-Key. A hyperbolic plot suggests a multi-step process (Induced Fit or Conformational Selection).
Surface Plasmon Resonance (SPR)
Objective: Obtain association/dissociation rate constants (ka, kd). Protocol:
- Surface Immobilization: Covalently immobilize protein on a CMS sensor chip via amine coupling.
- Ligand Injection: Inject ligand at a series of concentrations (spanning 0.1-10x K_d) in continuous flow.
- Regeneration: Strip bound ligand with a mild regeneration buffer (e.g., low pH or high salt) without denaturing the protein.
- Data Analysis: Fit sensorgrams globally to 1:1 Langmuir (Lock-and-Key) vs. two-state (Induced Fit/Conformational Selection) binding models. A two-state model with a better fit indicates a multi-step mechanism.
Table 2: Ensemble Method Comparison
| Method | Measured Parameters | Time Resolution | Throughput | Key Limitation |
|---|---|---|---|---|
| Stopped-Flow | k_obs (association phase) | ~1 ms | Medium | Averages population behavior. |
| SPR/Biolayer Interferometry | ka, kd, K_D | ~0.1 s | High | Immobilization may perturb kinetics. |
| Temperature-Jump Relaxation | Microsecond conformational rates | ~1 µs | Low | Requires specialized equipment. |
| NMR Relaxation Dispersion | µs-ms conformational exchange | µs-ms | Low | Requires isotopically labeled protein. |
Single-Molecule Methodologies
These techniques are essential to directly observe heterogeneous populations and transient intermediates.
Single-Molecule FRET (smFRET)
Protocol:
- Labeling: Site-specifically label protein with donor (Cy3) and acceptor (Cy5) dyes via cysteine mutations.
- Immobilization: Tether labeled proteins to a passivated (PEG/biotin) microscope slide via a biotin-streptavidin linkage.
- Data Collection: Use a TIRF microscope. Excite donor with a laser (532 nm). Collect donor and acceptor emission with an EMCCD camera. Record movies at 10-100 ms frame rate.
- Data Analysis: Identify single molecules. Calculate FRET efficiency (E = IA/(ID + I_A)) per frame. Construct FRET efficiency histograms and transition density plots.
Diagram 2: smFRET Workflow for Mechanism ID
Optical Tweezers
Protocol:
- Tethering: Engineer protein with DNA handles attached to specific domains. Coat bead surfaces with anti-digoxigenin and streptavidin.
- Trapping: Capture two beads in separate optical traps. Bring them together to form a single tether (protein-DNA bead assembly).
- Force-Clamp: Maintain constant force (e.g., 5 pN). Introduce ligand via microfluidic flow.
- Data Analysis: Monitor extension changes. Stepwise changes in extension report on conformational transitions. Analyze dwell times in different states with/without ligand.
The Scientist's Toolkit: Key Reagent Solutions
| Research Reagent / Material | Function in Experiment |
|---|---|
| Site-Specific Cysteine Mutant Protein | Enables precise labeling with fluorescent dyes or biotin for smFRET/immobilization. |
| HaloTag/SNAP-tag Fusion Protein | Alternative to cysteine labeling for specific, bright dye conjugation in single-molecule studies. |
| PEG/Biotin-Passivated Slides/Coverslips | Creates a non-fouling surface to minimize non-specific binding in single-molecule imaging. |
| Streptavidin-Coated Magnetic/Polymer Beads | For tethering biotinylated biomolecules in force spectroscopy (optical/magnetic tweezers). |
| Anti-Flag/Anti-His Antibody SPR Chips | Allows oriented, non-denaturing immobilization of tagged proteins for kinetic SPR. |
| Rapid Kinetic Stopped-Flow Accessories (μMIXER) | Ensures sub-millisecond mixing for measuring fast association kinetics. |
| Cy3B/Cy5 or ATTO 550/647N Dye Pairs | Photostable, bright fluorophores with high FRET efficiency for smFRET. |
| Microfluidic Flow Cells | Enables precise, rapid solution exchange for single-molecule ligand dosing. |
| Guanidine HCl/Urea (Low Conc.) | Used in 'chemical denaturation' SM experiments to modulate conformational landscapes. |
Integrated Analysis & Distinction Strategy
No single method is definitive. A hierarchical approach is required:
- Perform Ensemble Kinetics: Use stopped-flow or SPR to determine if kinetics are simple (Lock-and-Key) or multi-step.
- Probe Conformational Dynamics Ligand-Free: Use NMR relaxation dispersion or smFRET to check if the protein samples the "bound-like" conformation in the absence of ligand. Its presence strongly supports Conformational Selection.
- Monitor Temporal Order: In single-molecule experiments, the sequence of events is critical. Conformational Selection shows conformation change then ligand binding event. Induced Fit shows ligand binding then conformation change.
- Global Kinetic Modeling: Simultaneously fit data from all experiments (stopped-flow, SPR, smFRET dwell times) to a unified kinetic model.
Table 3: Decisive Evidence for Each Model
| Evidence Type | Supports Lock-and-Key | Supports Induced Fit | Supports Conformational Selection |
|---|---|---|---|
| k_obs vs. [L] (Ensemble) | Linear | Hyperbolic | Hyperbolic |
| Ligand-Free Conformational Dynamics | None | None (or unrelated) | Yes, matching bound state |
| Single-Molecule Event Order | N/A | Binding -> Conformation Change | Conformation Change -> Binding |
| NMR Chemical Shift Perturbation | Fast exchange, single state | Slow exchange upon binding | Pre-existing minor state detected |
| Effect on Energy Landscape | Deepens one well | Creates a new well | Shifts population of pre-existing wells |
Disambiguating binding mechanisms is a cornerstone of modern biophysical chemistry and drug discovery. While ensemble methods provide the initial kinetic framework, single-molecule techniques offer the definitive, direct observation of transient states and pathways required to distinguish Induced Fit from Conformational Selection. The integrated use of these tools, as outlined, allows researchers to move beyond phenomenological description towards a mechanistic understanding of molecular recognition, ultimately informing the design of more effective and selective therapeutics.
Protein-ligand recognition paradigms have evolved from the rigid Lock and Key model (Fischer, 1894) to the dynamic Induced Fit (Koshland, 1958) and Conformational Selection (Monod et al., 1965) models. Modern understanding posits a hybrid continuum where pre-existing conformational ensembles (Conformational Selection) are stabilized and refined upon ligand binding (Induced Fit). The Calreticulin (CALR) protein family, comprising calreticulin and its membrane-bound paralog calnexin (CNX), serves as a quintessential case study for this hybrid mechanism. As endoplasmic reticulum (ER) lectin chaperones, they dynamically recognize and assist the folding of diverse N-glycosylated client proteins, employing a sophisticated blend of selective and adaptive interactions.
Calreticulin and calnexin share a conserved domain architecture essential for their hybrid recognition function:
- N-domain: A globular β-sandwich domain with the primary lectin site for glycan recognition (Glc₁Man₉GlcNAc₂).
- P-domain: An extended, highly flexible arm rich in Proline, containing high-affinity binding sites for ERp57, a thiol oxidoreductase.
- C-domain: A negatively charged, Ca²⁺-binding domain involved in ER calcium homeostasis and client protein modulation.
Table 1: Key Functional Parameters of CALR Family Members
| Parameter | Calreticulin (Soluble) | Calnexin (TM-anchored) |
|---|---|---|
| Primary Location | ER Lumen | ER Membrane (Luminal Domain) |
| Key Glycan Ligand | Monoglucosylated N-glycan (Glc₁Man₉GlcNAc₂) | Monoglucosylated N-glycan (Glc₁Man₉GlcNAc₂) |
| Binding Constant (Kd) for Glycan* | ~1-4 µM | ~1-4 µM |
| Affinity for ERp57 (P-domain) | High (sub-µM range) | High (sub-µM range) |
| Ca²⁺ Binding Capacity (C-domain) | High Capacity (~25 mol/mol), Low Affinity | Low Capacity, Low Affinity |
| Core Client Recognition Logic | Hybrid: Conformational Selection of glycan + Induced Fit for protein moiety |
Note: Affinities are approximate and can vary based on experimental conditions and glycan presentation.
The Hybrid Recognition Mechanism: A Stepwise Analysis
Step 1: Conformational Selection of the Glycan
The primary lectin site in the N-domain does not undergo major structural rearrangement upon binding the terminal glucose residue. Instead, it acts as a selective filter, recognizing a specific conformational epitope of the monoglucosylated glycan from a pool of dynamically interconverting glycan structures. This step aligns with the Conformational Selection model.
Step 2: Induced Fit and Dynamic Processing
Initial glycan tethering is followed by adaptive steps:
- The flexible P-domain and the surrounding protein surface interact with the exposed polypeptide portions of the client.
- These interactions are highly variable and induce local conformational adjustments in both the chaperone and the client (Induced Fit).
- The associated ERp57 mediates disulfide bond formation/isomerization in the client, further driving conformational changes.
Step 3: Cycle of Release and Re-assessment
Upon client glucose trimming by glucosidase II, the glycan is no longer recognized, and the client is released. Re-glucosylation by UDP-glucose:glycoprotein glucosyltransferase (UGGT)—which acts as a folding sensor—can re-engage the client with CALR/CNX, creating a proofreading cycle.
Diagram Title: Hybrid Recognition Cycle of CALR/CNX
Experimental Protocols for Elucidating the Hybrid Mechanism
Protocol: Isothermal Titration Calorimetry (ITC) for Binding Thermodynamics
Objective: Quantify the affinity (Kd), stoichiometry (n), enthalpy (ΔH), and entropy (ΔS) of the CALR-glycan interaction. Method:
- Sample Preparation: Purify recombinant CALR N+P domains. Synthesize or purchase high-purity monoglucosylated oligosaccharide (e.g., Glc₁Man₉GlcNAc₂).
- Instrument Setup: Load the CALR solution (50 µM in 20 mM Tris, 150 mM NaCl, 2 mM CaCl₂, pH 7.5) into the sample cell. Fill the syringe with the glycan solution (500 µM in identical buffer).
- Titration: Perform a series of automated injections (e.g., 19 injections of 2 µL) at constant temperature (25°C). The instrument measures the heat released or absorbed after each injection.
- Data Analysis: Fit the integrated heat data to a single-site binding model. A favorable ΔH with a compensating -TΔS suggests enthalpically-driven recognition (consistent with specific lectin-glycan interactions), while a dominant -TΔS term indicates conformational selection from an ensemble.
Protocol: Hydrogen-Deuterium Exchange Mass Spectrometry (HDX-MS)
Objective: Map conformational dynamics and ligand-induced stabilization/flexibility changes. Method:
- Labeling: Incubate CALR alone and CALR+glycan complex in D₂O-based buffer for varying time points (10s to 4 hours) at 4°C.
- Quenching & Digestion: Quench the exchange by lowering pH and temperature. Digest proteins with an immobilized pepsin column.
- MS Analysis: Inject peptides into a liquid chromatography-tandem mass spectrometry (LC-MS/MS) system. Monitor mass shift due to deuterium incorporation.
- Data Interpretation: Reduced deuterium uptake in the lectin domain upon glycan binding indicates direct interaction and stabilization. Changes in uptake in distal regions (e.g., P-domain hinge) reveal allosteric communication, indicative of an induced fit mechanism.
Protocol: NMR Spectroscopy for Dynamics and Weak Interactions
Objective: Characterize atomic-level dynamics, identify transient interactions, and observe conformational exchange on µs-ms timescales. Method:
- Sample Preparation: Produce ¹⁵N/¹³C-labeled CALR. Use unlabeled glycan or client peptide.
- Experiments:
- ¹⁵N-HSQC: Record spectra of free and bound states. Chemical shift perturbations (CSPs) map the interaction interface.
- Relaxation Dispersion (R₁ρ): Measure exchange dynamics for residues experiencing conformational fluctuations on the ms timescale.
- Saturation Transfer Difference (STD)-NMR: Identify ligand epitopes making close contact with the protein.
- Analysis: CSPs indicate direct or allosteric effects. Relaxation dispersion reveals low-populated, excited states in the free protein that resemble the bound conformation—a hallmark of conformational selection.
The Scientist's Toolkit: Key Research Reagent Solutions
Table 2: Essential Reagents for CALR Hybrid Recognition Studies
| Reagent / Material | Function & Rationale |
|---|---|
| Recombinant CALR/CNX (N+P domains) | Purified protein for biophysical assays. Removal of the C-domain often improves solubility and stability for in vitro studies. |
| Defined Glycan Ligands (e.g., Glc₁Man₉GlcNAc₂-Asn) | High-purity, chemically defined substrates for quantitative binding studies, crucial for measuring precise thermodynamic parameters. |
| ERp57 (PDIA3) Protein | Essential co-chaperone for functional reconstitution of the complete chaperone cycle and study of its role in induced fit. |
| UGGT & Glucosidase II Enzymes | Required for in vitro reconstitution of the full proofreading cycle to study kinetic partitioning between bound and free states. |
| ³H/¹⁴C-labeled Liposome Membranes (for CNX) | Model membrane systems to study the effect of calnexin's transmembrane anchor on its conformational dynamics and client recognition. |
| Site-Directed Mutagenesis Kits | To generate point mutants (e.g., in the lectin site or P-domain) for dissecting the contribution of specific residues to selection vs. adaptation. |
| HDX-MS or NMR-Compatible Buffers (D₂O, low salt) | Specialized buffers required for maintaining protein stability while enabling sensitive detection of conformational dynamics. |
Diagram Title: Experimental Strategy for Hybrid Mechanism Analysis
The Calreticulin family exemplifies a sophisticated hybrid molecular recognition mechanism. It employs conformational selection for the initial, glycan-dependent capture, followed by induced fit interactions that accommodate diverse protein substrates and facilitate their folding. This model reconciles the need for specificity (via the conserved glycan signal) with remarkable client plasticity. For drug development, especially in pathologies like myeloproliferative neoplasms driven by mutant CALR, this insight is critical. Targeting the static lectin site may disrupt all functions, whereas strategies aimed at the dynamic P-domain or the hybrid interface could offer more selective modulation of specific client interactions, paving the way for novel therapeutic strategies.
Comparative Performance in Drug Discovery Campaigns and Virtual Screening
The pursuit of novel therapeutics is fundamentally governed by molecular recognition paradigms. This guide situates modern drug discovery performance within the theoretical continuum of binding models: the rigid Lock and Key, the adaptive Induced Fit, and the population-shift Conformational Selection mechanisms. Understanding these models is critical for selecting and optimizing computational and experimental screening strategies, as each implies different requirements for sampling, scoring, and validation.
Theoretical Models: Implications for Screening
Model Definitions and Computational Demands
- Lock and Key (Complementarity): Assumes a pre-formed, static binding site. Virtual screening (VS) focuses on steric and electrostatic complementarity.
- Induced Fit (Adaptation): Posits that binding induces conformational change in the target. VS must account for target flexibility, increasing sampling complexity.
- Conformational Selection (Selection): Proposes that the target exists in an ensemble of states, with the ligand selecting the competent conformation. VS requires ensemble docking or molecular dynamics (MD) simulations to capture pre-existing states.
Performance Implications by Model
The efficacy of a virtual screening campaign is directly influenced by the dominant binding mechanism of the target. Misalignment leads to high false-negative rates.
Quantitative Performance Metrics: A Comparative Analysis
Data synthesized from recent literature reviews and benchmark studies (2022-2024) highlight variable outcomes across strategies.
Table 1: Performance Metrics of Primary Virtual Screening Modalities
| Screening Modality | Avg. Enrichment Factor (EF₁%) | Avg. Hit Rate (%) | Typical Runtime (CPU-h) | Dominant Binding Model Addressed | Key Limitation |
|---|---|---|---|---|---|
| Structure-Based (SBVS) - Rigid Docking | 8-15 | 0.5 - 2 | 10 - 100 | Lock and Key | Cannot handle receptor flexibility |
| SBVS - Flexible Docking | 10-25 | 1 - 5 | 100 - 1,000 | Induced Fit | Increased computational cost; risk of overfitting |
| SBVS - Ensemble Docking | 15-35 | 2 - 10 | 500 - 5,000 | Conformational Selection | Dependent on quality/conformational diversity of ensemble |
| Ligand-Based (LBVS) - Pharmacophore | 5-12 | 0.3 - 3 | 1 - 10 | Lock and Key / Similarity | Requires known active ligands; blind to novel chemotypes |
| LBVS - Machine Learning (QSAR/ML) | 20-50* | 5 - 15* | 100 - 500* | Context-Dependent | Requires large, high-quality training data; risk of dataset bias |
| Hybrid SB/LB Methods | 25-40 | 3 - 12 | 200 - 2,000 | Induced Fit / Selection | Integrative complexity in parameter weighting |
*Highly variable and dataset-dependent; values represent well-optimized models on curated benchmarks.
Table 2: Experimental Hit-to-Lead Success Rates by Discovery Origin
| Lead Source | Confirmed Hit Rate from Primary Screen | Progression to Lead (%) (pIC50>7, LE>0.3) | Avg. Timeline to Lead (Months) | Associated Computational Model |
|---|---|---|---|---|
| HTS (Experimental) | 0.01 - 0.1% | 10-20% | 12-18 | N/A |
| SBVS (Single Conformation) | 2 - 10% | 15-25% | 8-12 | Lock and Key |
| SBVS (Flexible/Ensemble) | 5 - 15% | 20-35% | 10-14 | Induced Fit / Selection |
| Fragment-Based Screening | 1 - 5%* | 30-50% | 18-24 | Conformational Selection |
| DNA-Encoded Libraries (DEL) | N/A (Direct binders) | 10-30% | 6-10 | Lock and Key / Induced Fit |
*Lower hit rate by biophysical assay, but high ligand efficiency.
Experimental Protocols for Model Validation & Screening
Protocol: Orthogonal Biophysical Assay Cascade for Hit Validation
Purpose: To validate VS hits and infer binding mechanism.
- Primary Confirmation: Surface Plasmon Resonance (SPR) or Microscale Thermophoresis (MST) to confirm binding affinity (KD) and kinetics (ka, kd).
- Thermodynamic Profiling: Isothermal Titration Calorimetry (ITC) to measure ΔH, ΔS, and ΔG. A large, favorable -TΔS suggests conformational selection.
- Conformational Analysis:
- X-ray Crystallography / Cryo-EM: For high-resolution complex structures. Compare apo and holo states. Significant backbone movement >2Å suggests induced fit.
- Solution-State NMR: Monitor chemical shift perturbations (CSP) of target upon ligand titration. Two-state CSPs suggest conformational selection from a pre-existing minor population.
- HDX-Mass Spectrometry: To measure solvent-protection dynamics. Protection only upon binding suggests induced fit; protection of apo state suggests pre-existing competent conformation.
- Functional Assay: Cell-based or biochemical assay to confirm pharmacological activity.
Protocol: Multi-Conformational Virtual Screening Workflow
Purpose: To account for both Induced Fit and Conformational Selection.
- Ensemble Generation:
- Source multiple apo and holo crystal structures from PDB.
- Alternatively: Run extended (µs-scale) molecular dynamics (MD) simulation of the apo protein. Use clustering (e.g., GROMOS) to extract representative conformational states.
- Ensemble Docking:
- Dock entire compound library (~1M molecules) against each receptor conformation in parallel using high-throughput docking (e.g., AutoDock Vina, Glide HTVS).
- Consensus Scoring: Rank compounds by average score across all conformations, or by best score achieved in any conformation.
- Post-Docking Analysis & Filtering:
- Apply constraints (e.g., key interaction conservation).
- Use machine learning classifiers trained on docking poses to reduce false positives.
- Cluster top-scoring compounds by chemical similarity to ensure diversity.
- Selection for Experimental Testing: Prioritize 100-500 compounds for acquisition and testing.
Diagrams
Title: Virtual Screening Strategy Selection Based on Binding Model
Title: Binding Model Pathways: Conformational Selection vs Induced Fit
The Scientist's Toolkit: Essential Research Reagents & Materials
Table 3: Key Reagent Solutions for Binding Mechanism Studies
| Item / Reagent | Function in Research | Application Context |
|---|---|---|
| HEPES Buffered Saline (e.g., 10mM HEPES, 150mM NaCl, pH 7.4) | Standard physiological buffer for biophysical assays. Provides stable pH. | SPR, ITC, MST, FP assays. |
| TCEP-HCl (Tris(2-carboxyethyl)phosphine) | Reducing agent. Maintains cysteine residues in reduced state, preventing non-specific disulfide formation. | Essential for proteins with solvent-exposed cysteines in all assays. |
| CHAPS or n-Dodecyl-β-D-maltoside (DDM) | Mild detergents. Solubilize membrane proteins or prevent aggregation of hydrophobic targets. | Assays with membrane proteins or aggregation-prone soluble proteins. |
| BSA (Bovine Serum Albumin) or Casein | Blocking agent. Reduces non-specific binding of analytes to sensor chips or plate wells. | SPR biosensor surface blocking; plate-based assay blocking. |
| DMSO (Dimethyl Sulfoxide), HPLC Grade | Universal solvent for small molecule ligands. Must be kept at low concentration (<1-2%) in assays to avoid protein denaturation. | Compound storage and dilution for all biochemical/biophysical screens. |
| NTA (Nitrilotriacetic Acid) Sensor Chip | Surface chemistry for immobilizing His-tagged proteins via nickel chelation. | SPR studies using His-tagged recombinant targets. |
| Deuterated Buffer (e.g., in D₂O) | Required for NMR spectroscopy to avoid signal interference from solvent protons. | NMR-based binding studies and structural analysis. |
| Fluorescent Dye (e.g., SYPRO Orange) | Environment-sensitive dye used to monitor protein thermal unfolding. | Thermal shift assays (TSA) to detect ligand binding-induced stabilization. |
| Protease Inhibitor Cocktail (EDTA-free) | Inhibits proteolytic degradation of protein target during long experiments. | All protein handling steps prior to assay setup, especially for sensitive targets. |
| Size-Exclusion Chromatography (SEC) Buffer (e.g., with 150mM NaCl) | Final polishing step to isolate monodisperse, aggregate-free protein. | Critical protein purification step prior to crystallography, Cryo-EM, or ITC. |
Integrating Models with AI, Big Data, and Future Computational Toxicology
The evolution of computational toxicology is fundamentally intertwined with paradigms from molecular recognition theory. The classical lock-and-key, induced fit, and conformational selection models provide a critical conceptual framework for understanding how toxicants interact with biological targets. Integrating these mechanistic models with artificial intelligence (AI) and big data analytics is revolutionizing the prediction of adverse outcomes, moving from descriptive toxicology to a predictive, systems-level science.
Theoretical Framework: From Molecular Recognition to Toxicological Pathways
Toxicant-target interactions are not static. The induced fit model (where the target adapts to the ligand) and the conformational selection model (where the ligand selects a pre-existing target conformation from an ensemble) are particularly relevant for understanding off-target effects and low-affinity, high-impact toxicological interactions. These dynamics must be captured in silico to predict complex adverse outcome pathways (AOPs).
AI and Machine Learning Architectures for Model Integration
Modern AI integrates these biophysical models through multi-scale computational frameworks.
Key Architectures:
- Graph Neural Networks (GNNs): Represent molecules and proteins as graphs, learning features that reflect topological and electronic compatibility, implicitly encoding induced fit and conformational dynamics.
- Transformers & Attention Mechanisms: Model long-range dependencies in biological sequences and interaction networks, identifying key residues or substructures involved in molecular recognition events.
- Multi-Task Learning (MTL) Models: Train on diverse datasets (e.g., binding affinity, cytotoxicity, gene expression) to predict multiple endpoints, reflecting the cascade of events in an AOP.
- Generative Models: Design molecules with optimized target affinity (lock-and-key) and minimal off-target interactions (negative conformational selection).
Table 1: Performance Comparison of AI Models in Toxicity Prediction
| Model Architecture | Dataset (Size) | Endpoint Predicted | Key Metric (Score) | Implicit Biophysical Model |
|---|---|---|---|---|
| GNN (Attentive FP) | Tox21 (~12k compounds) | Nuclear Receptor Signaling | ROC-AUC: 0.856 | Conformational Selection |
| Transformer (ChemBERTa) | SIDER (~1.4k compounds) | Adverse Drug Reactions | F1-Score: 0.781 | Induced Fit / Polypharmacology |
| MTL-DNN | REACH & PubChem (>100k compounds) | Acute Oral Toxicity (LD50) | RMSE: 0.52 (log scale) | Integrated Pathway Response |
| 3D-CNN on Molecular Dynamics | PDBbind (refined set) | Protein-Ligand Binding Affinity | Pearson's R: 0.82 | Explicit Induced Fit Dynamics |
Big Data Foundations and Integrative Analytics
The predictive power of AI is fueled by large-scale, heterogeneous data.
- Chemical Big Data: PubChem (>100M compounds), ChEMBL, ZINC.
- Biomedical Omics: TG-GATEs, LINCS, Gene Expression Omnibus (GEO) for transcriptomic responses.
- High-Throughput Screening: Tox21/ToxCast data for ~10k chemicals across ~1k assays.
- Structural Data: Protein Data Bank (PDB), AlphaFold DB for predicted protein structures.
Integration requires a systematic workflow:
Fig1: Big data integration for computational toxicology.
Experimental Protocols for Validating AI Predictions
Protocol 1: Molecular Dynamics (MD) Simulation for Conformational Selection Analysis
- Objective: Validate AI-predicted binding modes and capture conformational dynamics.
- Method:
- System Preparation: Obtain protein structure (PDB or AlphaFold). Prepare ligand with GAFF2 force field. Solvate in TIP3P water box, neutralize with ions.
- Energy Minimization: Use steepest descent algorithm (5000 steps) to remove steric clashes.
- Equilibration: NVT ensemble (100 ps, 300 K) followed by NPT ensemble (100 ps, 1 bar) to stabilize density.
- Production Run: Perform ≥100 ns unbiased MD simulation using GPU-accelerated PMEMD. Save trajectories every 10 ps.
- Analysis: Calculate RMSD, RMSF, and ligand-protein interaction fingerprints. Use cluster analysis to identify dominant conformational states and transitions.
Protocol 2: High-Throughput Transcriptomics for AOP Activation
- Objective: Experimentally confirm adverse outcome pathways predicted by multi-task AI models.
- Method:
- Cell Exposure: Treat HepaRG or primary hepatocyte cultures with predicted toxicant at IC10 and IC50 concentrations for 24h. Include vehicle control.
- RNA Extraction: Use TRIzol reagent with Phase Lock Gel tubes for high-yield, DNase-treated RNA isolation.
- Library Prep & Sequencing: Prepare mRNA libraries using poly-A selection (NEBNext Ultra II). Sequence on Illumina NovaSeq platform (PE 150 bp).
- Bioinformatics: Align reads to reference genome (STAR). Perform differential gene expression analysis (DESeq2). Conduct pathway enrichment analysis (GSEA) against known AOP-related gene sets.
The Scientist's Toolkit: Research Reagent Solutions
Table 2: Essential Reagents for Validation Experiments
| Item | Function & Application | Example Product / Vendor |
|---|---|---|
| HepaRG Cell Line | Differentiated human hepatocyte model for hepatotoxicity testing; expresses major drug-metabolizing enzymes. | Thermo Fisher Scientific |
| TRIzol Reagent | Monophasic solution of phenol and guanidine isothiocyanate for simultaneous RNA/DNA/protein isolation from cells. | Invitrogen |
| NEBNext Ultra II RNA Library Prep Kit | For preparation of high-quality stranded RNA-seq libraries for next-generation sequencing. | New England Biolabs |
| Amber/OpenMM Software | Molecular dynamics simulation suites for modeling protein-ligand conformational dynamics. | D.E. Shaw Research / OpenMM |
| AlphaFold2 Protein Structure DB | Database of highly accurate predicted protein structures for targets lacking experimental crystallography data. | EMBL-EBI |
| ToxCast/Tox21 Data Pipeline (invitrodb) | Curated R package and database for high-throughput screening assay data from EPA/NCATS. | US EPA / CRAN |
The Future: Quantum Computing and Multiscale Digital Twins
The next frontier involves quantum computing for precise quantum mechanical/molecular mechanical (QM/MM) simulations of reaction mechanisms catalyzed by enzymes like CYP450s. This will refine our understanding of the "induced fit" during metabolic activation. Furthermore, the integration of all models into a multiscale "digital twin" of organ systems will enable virtual human trials, shifting toxicology from hazard identification to full-system risk simulation.
Fig2: The convergence of models, AI, and data.
Conclusion
The lock-and-key, induced fit, and conformational selection models are not mutually exclusive but represent complementary facets of molecular recognition essential for drug discovery. A key synthesis is that accurate binding affinity prediction requires moving beyond models focused solely on association to incorporate dissociation mechanisms, such as ligand trapping. Future directions should prioritize unified theoretical frameworks that integrate these paradigms, leveraging hybrid computational approaches, AI, and big data analytics. This evolution promises to enhance the precision of virtual screening, accelerate lead optimization, and open new avenues for targeting complex diseases in biomedical and clinical research.