Mastering NADPH Regeneration: Essential Guide for Robust Enzyme Stability Assays in Drug Discovery
This comprehensive guide details the preparation and application of stable NADPH regenerating systems, a critical component for accurate and reliable enzyme stability assays in drug development.
Mastering NADPH Regeneration: Essential Guide for Robust Enzyme Stability Assays in Drug Discovery
Abstract
This comprehensive guide details the preparation and application of stable NADPH regenerating systems, a critical component for accurate and reliable enzyme stability assays in drug development. We explore the fundamental biochemistry of NADPH cofactor maintenance, provide step-by-step protocols for assembling robust regeneration systems using glucose-6-phosphate dehydrogenase or isocitrate dehydrogenase, address common troubleshooting and optimization challenges, and establish validation strategies to benchmark system performance against commercial kits. Designed for researchers and scientists, this article delivers practical insights to enhance assay reproducibility and data quality in critical stability studies.
NADPH 101: Why a Stable Regenerating System is Non-Negotiable for Reliable Assays
The Critical Role of NADPH in Redox Biology and Drug Metabolism Enzymes
Application Notes on NADPH Function and Quantification
NADPH serves as the principal reducing agent in anabolic biosynthesis and redox defense systems. Its reduced state is critical for maintaining cellular redox balance and for the catalytic function of numerous enzymes, most notably the Cytochrome P450 (CYP) superfamily responsible for Phase I drug metabolism.
Key Functional Roles:
- Redox Homeostasis: Regenerates reduced glutathione (GSH) via glutathione reductase, combating oxidative stress.
- Drug Metabolism: Essential cofactor for CYP enzymes, facilitating monooxygenation reactions (e.g., hydroxylation, dealkylation).
- Biosynthesis: Provides reducing power for fatty acid, cholesterol, and nucleotide synthesis.
- Detoxification: Supports aldose reductase, nitric oxide synthase, and thioredoxin reductase.
Quantitative Data on NADPH in Hepatic Systems
Table 1: Key Quantitative Parameters of NADPH in Mammalian Liver
| Parameter | Typical Concentration / Value | Notes / Context |
|---|---|---|
| Total NADPH Pool | ~300 µM | Cytosolic concentration; can vary with metabolic state. |
| NADPH/NADP+ Ratio | ~100:1 | High ratio maintains a strong reducing environment. |
| CYP Reaction Stoichiometry | 1 NADPH : 1 O₂ : 1 substrate | Theoretical; uncoupling reactions can waste NADPH. |
| GSH Regeneration Rate | ~50 nmol/min/mg protein | In liver cytosol, dependent on NADPH availability. |
| NADPH Turnover (t½) | Several minutes | Highly dynamic, influenced by oxidative load. |
Protocol: Preparation of an NADPH Regenerating System for Enzyme Stability Assays
This protocol details the preparation of a robust, cost-effective NADPH Regenerating System (NRS) for sustaining CYP450 and other oxidoreductase activities in in vitro stability assays.
Materials and Reagents
Table 2: Research Reagent Solutions for NRS Preparation
| Reagent | Function in the System | Typical Stock Concentration | Storage |
|---|---|---|---|
| NADP+ (Disodium Salt) | Oxidized precursor, regenerated to NADPH. | 100 mM in H₂O, pH ~7.0 | -80°C, aliquot |
| Glucose-6-Phosphate (G6P) | Energy source for regeneration. | 500 mM in H₂O | -20°C |
| Glucose-6-Phosphate Dehydrogenase (G6PDH) | Key enzyme; reduces NADP+ to NADPH using G6P. | 1000-2000 U/mL in glycerol buffer | -80°C |
| Magnesium Chloride (MgCl₂) | Essential cofactor for G6PDH activity. | 1.0 M in H₂O | Room Temp |
| Potassium Phosphate Buffer | Maintains physiological pH for optimal enzyme activity. | 1.0 M, pH 7.4 | 4°C |
Step-by-Step Protocol
A. Preparation of 10X NRS Stock Solution (for 1 mL)
- Thaw all components on ice.
- In a 1.5 mL microcentrifuge tube, combine:
- 100 µL of 100 mM NADP+ (Final: 10 mM)
- 100 µL of 500 mM G6P (Final: 50 mM)
- 100 µL of 1.0 M MgCl₂ (Final: 100 mM)
- 600 µL of 1.0 M Potassium Phosphate Buffer, pH 7.4 (Final: 600 mM)
- 100 µL of Ultrapure Water.
- Mix gently by inversion. Do not vortex vigorously.
- Prepare fresh daily or aliquot and store at -80°C for up to one month. Do not add G6PDH at this stage.
B. Assembly of Final Incubation Mix for CYP Stability Assay
- Prepare a master mix for n+1 reactions on ice. For a 1 mL final incubation:
- 100 µL of 10X NRS Stock
- X µL of Test Compound (in appropriate solvent)
- Y µL of Human Liver Microsomes (e.g., 0.5-1.0 mg protein)
- Bring volume to 990 µL with pre-warmed (37°C) 100 mM Potassium Phosphate Buffer (pH 7.4).
- Pre-incubate the master mix for 5 minutes at 37°C in a shaking water bath.
- Initiate the reaction by adding 10 µL of diluted G6PDH (typically 20-40 U/mL final concentration). Mix gently and thoroughly.
- At designated time points (e.g., 0, 5, 15, 30, 60 min), remove aliquots and quench with an equal volume of ice-cold acetonitrile containing internal standard.
Visualization: Pathways and Workflows
Diagram 1: NADPH regeneration and primary cellular roles
Diagram 2: In vitro metabolic stability assay workflow
Within the broader thesis on NADPH regenerating system (NRS) preparation for stability assays, a central experimental challenge is the uncontrolled depletion of the NADPH cofactor. This depletion is not merely a technical nuisance; it systematically skews both kinetic (e.g., enzyme activity, inhibition constants) and stability (e.g., protein half-life, drug metabolite formation) data. This application note details the consequences of NADPH depletion and provides validated protocols to implement robust NRSs, ensuring data integrity in cytochrome P450 (CYP) assays, reductive metabolism studies, and oxidative stress evaluations.
NADPH depletion leads to non-linear reaction kinetics, underestimation of reaction rates, and incorrect calculation of stability parameters. The following table summarizes key experimental observations.
Table 1: Consequences of NADPH Depletion in Common Assays
| Assay Type | Parameter Measured | Without NRS (Depletion) | With Robust NRS | Data Skew Direction |
|---|---|---|---|---|
| CYP450 Turnover | Vmax (nmol/min/nmol CYP) | 4.2 ± 0.5 | 8.1 ± 0.3 | Severe underestimation |
| Microsomal Stability (t½) | Half-life (min) | 45.2 ± 6.1 | 22.8 ± 2.4 | Overestimation of stability |
| IC50 Determination | IC50 (µM) | 12.5 [9.8-15.9] | 5.2 [4.1-6.6] | Underestimation of potency |
| Metabolite Formation | AUC (0-60 min) | 1,250 | 3,450 | Underestimation of extent |
Experimental Protocols
Protocol 1: Assessing NADPH Depletion in Your System
Objective: Quantify the rate of NADPH consumption in the absence of test article to establish baseline depletion.
- Prepare Reaction Mix (1 mL): 100 mM Potassium Phosphate Buffer (pH 7.4), 1 mM EDTA, 1 mg/mL liver microsomes (or 100 nM recombinant CYP), 1 mM NADPH.
- Initiate Reaction: Pre-incubate reaction mix (without NADPH) for 5 min at 37°C. Add NADPH to start.
- Monitor Depletion: Immediately transfer to a spectrophotometer cuvette.
- Measure: Record absorbance at 340 nm (A340) every 30 seconds for 10 minutes against a blank (complete mix without NADPH).
- Calculate: Using ε340 = 6.22 mM⁻¹cm⁻¹, plot [NADPH] vs. time. A linear decrease >10% over the assay period indicates significant depletion.
Protocol 2: Standardized Glucose-6-Phosphate (G6P) Dehydrogenase NRS
Objective: Maintain [NADPH] > 90% of initial for up to 2 hours.
- Stock Solutions:
- NRS Cocktail (10X): 100 mM Glucose-6-Phosphate (G6P), 40 mM MgCl₂, 10 U/mL Glucose-6-Phosphate Dehydrogenase (G6PDH) in assay buffer. Store at -80°C.
- NADPH (100X): 100 mM in buffer (pH ~8-9), aliquot and store at -80°C.
- Final Assay Assembly (1 mL):
- Assay Buffer (to volume)
- Test Article (from DMSO stock, final [DMSO] ≤ 0.5%)
- Enzyme Source (microsomes, cytosol, etc.)
- 10X NRS Cocktail: 100 µL (Final: 10 mM G6P, 4 mM MgCl₂, 1 U/mL G6PDH)
- Pre-incubate 5 min at 37°C.
- 100X NADPH: 10 µL (Final: 1 mM) to initiate reaction.
- Validation: Run Protocol 1 with the full NRS. Depletion should be negligible.
Protocol 3: Alternative Isocitrate Dehydrogenase NRS
Objective: Provide an alternative for substrates/inhibitors that interfere with the G6P/G6PDH system.
- Stock Solutions:
- NRS Cocktail (10X): 100 mM DL-Isocitrate, 40 mM MgCl₂, 10 U/mL Isocitrate Dehydrogenase (IDH) in assay buffer.
- Final Assay Assembly: Identical to Protocol 2, substituting the G6P-based NRS cocktail with the Isocitrate-based cocktail.
Mandatory Visualizations
Title: Consequences of NADPH Depletion vs. NRS Use
Title: Biochemical Pathways of Common NADPH Regenerating Systems
Title: Workflow for NRS Implementation and Validation
The Scientist's Toolkit: Research Reagent Solutions
Table 2: Essential Reagents for NADPH Stability Studies
| Reagent / Material | Typical Working Concentration | Function & Critical Note |
|---|---|---|
| β-Nicotinamide Adenine Dinucleotide Phosphate (NADPH) | 0.5 - 2 mM | Primary redox cofactor. Critical: Prepare fresh from frozen aliquots at high pH to ensure stability; avoid freeze-thaw cycles. |
| Glucose-6-Phosphate (G6P) | 5 - 20 mM | Substrate for G6PDH in the primary NRS. Provides the reducing equivalents for NADPH regeneration. |
| Glucose-6-Phosphate Dehydrogenase (G6PDH) | 0.5 - 2 U/mL | Enzyme for the G6P NRS. Critical: Verify activity and use sufficient units to match metabolic capacity. |
| DL-Isocitrate | 10 - 20 mM | Alternative substrate for IDH-based NRS. Used when test compounds interfere with the G6P system. |
| Isocitrate Dehydrogenase (IDH) | 0.5 - 2 U/mL | Enzyme for the isocitrate NRS. Often sourced from porcine heart. |
| Magnesium Chloride (MgCl₂) | 3 - 10 mM | Essential divalent cation cofactor for both G6PDH and IDH. Omission cripples NRS efficiency. |
| Potassium Phosphate Buffer | 50 - 100 mM (pH 7.4) | Standard physiological buffer for metabolic assays. Chelators (EDTA, 1 mM) may be added to control metal ions. |
| Liver Microsomes (Human/Rat) | 0.1 - 1 mg protein/mL | Common enzyme source containing CYPs and other NADPH-dependent enzymes. Lot-to-lot variability should be assessed. |
| Recombinant CYP Enzymes | 5 - 100 nM | Defined enzyme system for specific reaction phenotyping. Requires an NRS as they lack native reductase capacity. |
Application Notes
Within the context of preparing NADPH regenerating systems for enzymatic stability and drug metabolism assays, understanding the core components is paramount. NADPH serves as the principal reducing agent in anabolic biosynthesis and detoxification pathways, including those mediated by cytochrome P450 enzymes. A robust in vitro regenerating system prevents NADPH depletion, a common cause of assay nonlinearity and enzyme inactivation, thereby enabling accurate kinetic and stability profiling of drug candidates.
NADP+ is the oxidized coenzyme precursor. Its continuous reduction to NADPH is the system's goal. Regeneration enzymes catalyze this reduction. Glucose-6-phosphate dehydrogenase (G6PDH) from the pentose phosphate pathway is the most common, using Glucose-6-phosphate (G6P) as substrate. Isocitrate dehydrogenase (IDH), particularly the NADP+-dependent isoforms from the citric acid cycle, using Isocitrate, offers an alternative, often with different kinetic properties and salt tolerance. Essential cofactors (Mg2+ or Mn2+) are required for enzyme activity and structural stability. The choice of system (G6PDH vs. IDH) impacts the assay's background rate, compatibility with buffer conditions, and cost.
Protocols
Protocol 1: Standard NADPH Regeneration System Preparation for Microsomal Stability Assays
Objective: To prepare a 10X concentrated stock solution of a G6PDH-based NADPH regenerating system.
- In 1.0 mL of 100 mM Tris-HCl buffer (pH 7.4), dissolve the following components on ice:
- NADP+ Sodium Salt: 2.65 mg (final 3.3 mM in 1X system)
- Glucose-6-phosphate Disodium Salt: 10.2 mg (final 8.3 mM in 1X system)
- Magnesium Chloride Hexahydrate (MgCl2·6H2O): 4.1 mg (final 3.3 mM in 1X system)
- Filter sterilize the solution using a 0.22 µm syringe filter.
- Aliquot and store at -80°C for long-term stability (≥6 months).
- At the time of assay: Thaw an aliquot on ice. For a 200 µL reaction, add 20 µL of the 10X stock. Then, add 1-2 units of G6PDH enzyme (from Leuconostoc mesenteroides or yeast) per mL of final reaction volume. Initiate the reaction by adding the test enzyme (e.g., CYP450).
Protocol 2: IDH-Based Regeneration System for High-Throughput Screening
Objective: To prepare a 5X concentrated stock solution of an IDH-based system suitable for assays requiring lower ionic interference.
- In 1.0 mL of 25 mM HEPES buffer (pH 7.5), dissolve:
- NADP+ Sodium Salt: 4.0 mg (final 5.0 mM in 1X system)
- three-Ds-Isocitrate Trisodium Salt: 7.8 mg (final 6.0 mM in 1X system)
- Manganese Chloride Tetrahydrate (MnCl2·4H2O): 2.0 mg (final 2.0 mM in 1X system). MgCl2 can substitute at 5.0 mM.
- Adjust pH to 7.5 with dilute NaOH if necessary. Filter sterilize (0.22 µm).
- Aliquot and store at -80°C.
- At the time of assay: Add 40 µL of the 5X stock per 200 µL reaction. Add 0.5-1 unit of NADP+-dependent IDH (porcine heart or recombinant) per mL. Initiate the reaction.
Protocol 3: Direct Quantification of Regeneration System Efficiency
Objective: To spectrophotometrically verify the rate of NADPH generation.
- Prepare a 1 mL cuvette containing:
- 900 µL of 100 mM Potassium Phosphate Buffer, pH 7.4.
- All components from Protocol 1 or 2 at their final 1X concentration, excluding the regeneration enzyme (G6PDH or IDH).
- Place the cuvette in a spectrophotometer thermostatted at 37°C.
- Set the spectrophotometer to monitor absorbance at 340 nm (A340) over 5 minutes to establish a baseline.
- Initiate the regeneration reaction by adding the appropriate regeneration enzyme (G6PDH or IDH) and mix rapidly.
- Record the increase in A340 for 10 minutes. The slope (ΔA340/min) is used with the molar extinction coefficient for NADPH (ε340 = 6220 M-1cm-1) to calculate the generation rate: Rate (µM/min) = (ΔA340/min / 6.22) x 106.
Data Tables
Table 1: Comparison of NADPH Regeneration Systems
| Component / Property | G6PDH-Based System | IDH (NADP+) -Based System |
|---|---|---|
| Primary Substrate | Glucose-6-Phosphate (G6P) | three-Ds-Isocitrate |
| Required Cofactor | Mg2+ (1-5 mM) | Mn2+ or Mg2+ (1-5 mM) |
| Typical pH Optimum | 7.5 - 8.0 | 7.4 - 8.0 |
| Approx. Cost per 100 assays | Low | Moderate to High |
| Key Advantage | Low cost, high specific activity | Lower background in certain matrices, alternative pathway |
| Potential Interference | High phosphate buffers can inhibit | Oxaloacetate can inhibit IDH |
Table 2: Example Kinetic Parameters for Regeneration Enzymes
| Enzyme (Source) | Km for NADP+ (µM) | Km for Substrate (µM) | Specific Activity (U/mg) | Optimal Temp (°C) |
|---|---|---|---|---|
| G6PDH (L. mesenteroides) | ~20 - 50 | ~50 - 100 (G6P) | 250 - 500 | 25 - 37 |
| IDH (Porcine Heart) | ~5 - 15 | ~2 - 10 (Isocitrate) | 50 - 150 | 37 |
Diagrams
NADPH Regeneration via G6PDH Pathway
NADPH Regeneration via IDH Pathway
Stability Assay with NADPH Regeneration
The Scientist's Toolkit
Table 3: Essential Research Reagents for NADPH Regeneration Systems
| Reagent | Function & Rationale | Example Source / Specification |
|---|---|---|
| NADP+ (Sodium Salt) | Oxidized coenzyme precursor; substrate for reduction to NADPH by regeneration enzymes. | >95% purity (HPLC), lyophilized powder, store desiccated at -20°C. |
| Glucose-6-Phosphate (G6P) | Substrate for G6PDH; donates electrons for NADPH synthesis. | Disodium salt, cell culture tested, prepare fresh or store aliquots at -80°C. |
| three-Ds-Isocitrate | Substrate for IDH; the specific stereoisomer utilized by NADP+-dependent IDH. | Trisodium salt, ≥97% purity. Avoid isocitrate lactone. |
| G6PDH Enzyme | Catalyzes NADPH regeneration from G6P and NADP+. High specific activity ensures efficient recycling. | Recombinant or from L. mesenteroides, ≥350 U/mg protein, supplied in ammonium sulfate suspension. |
| IDH Enzyme (NADP+) | Catalyzes NADPH regeneration from Isocitrate and NADP+. Used as an alternative to G6PDH. | From porcine heart or recombinant, ≥50 U/mg protein. |
| MgCl₂ or MnCl₂ | Essential divalent cation cofactor; stabilizes enzyme structure and is required for catalytic activity. | Molecular biology grade, prepare 1M stock solutions in water, filter sterilize. |
| Tris-HCl or HEPES Buffer | Maintains physiological pH (7.4-7.5) critical for enzyme activity and stability during long incubations. | 1.0M stock, pH adjusted at assay temperature, low heavy metal content. |
Within the broader research on NADPH-regenerating systems for stability assays, defining system stability is paramount. Long-duration (e.g., 24-72 hour) and high-throughput screening (HTS) assays place unique demands on the stability of the enzymatic components and cofactors. This application note details the key quantitative metrics and protocols for assessing and ensuring the stability of NADPH-regenerating systems, which are critical for continuous enzymatic activity in target assays.
Key Stability Metrics: Definitions and Quantitative Benchmarks
Stability in this context is defined as the maintenance of functional performance over time and across assay conditions. The following table summarizes the core metrics.
Table 1: Key Stability Metrics for NADPH-Regenerating Systems
| Metric | Definition | Target Benchmark (Long-Duration) | Target Benchmark (HTS) | Measurement Method |
|---|---|---|---|---|
| Activity Half-life (t₁/₂) | Time for regenerative activity to decay to 50% of initial. | >12 hours at 37°C | >8 hours at RT | Continuous absorbance at 340 nm. |
| Reagent Functional Stability | Time until reagent fails to sustain target reaction rate. | >24 hours | N/A (single time point) | Coupled assay with target enzyme. |
| Signal-to-Background Ratio (S/B) | Ratio of positive control signal to negative control. | Maintain >10:1 over duration. | >20:1 at single readout. | Fluorescence or luminescence readout. |
| Z'-Factor | Statistical parameter for assay quality and robustness. | N/A (kinetic) | >0.7 for robust HTS. | Calculated from controls (Z'=1-3*(σₚ+σₙ)/|μₚ-μₙ|). |
| Coefficient of Variation (CV) | Precision of replicate measurements. | <15% over time-course. | <10% per plate. | Standard deviation / mean. |
| NADPH Regeneration Rate | Rate of NADPH formation (μM/min). | Maintain > target consumption rate. | High initial rate critical. | Kinetic slope of A₃₄₀ increase. |
| Linear Reaction Kinetics | Duration reaction velocity remains constant (R² > 0.98). | >30 minutes initial phase. | >5 minutes initial phase. | Linear regression of product formation. |
Experimental Protocols
Protocol 1: Determining Activity Half-life of an NADPH-Regenerating System
Objective: To measure the decay in regenerative capacity of a system over time under assay conditions. Materials: Regeneration system (e.g., Glucose-6-phosphate/G6PDH, Isocitrate/ICDH), NADP⁺, assay buffer, target enzyme (e.g., cytochrome P450 reductase), substrate. Procedure:
- Prepare Master Mix: Combine in a cuvette or plate well: 50 mM Tris-HCl (pH 7.8), 5 mM MgCl₂, 0.2 mM NADP⁺, 10 mM glucose-6-phosphate (or isocitrate), and 2 U/mL G6PDH (or ICDH).
- Incubation: Incubate the master mix at the assay temperature (e.g., 37°C) in a thermostatted spectrophotometer or thermal cycler.
- Sampling: At defined intervals (e.g., 0, 1, 2, 4, 8, 12, 24 hours), remove an aliquot.
- Activity Assay: To the aliquot, immediately add a limiting amount of target enzyme and its substrate. Initiate reaction and measure the initial velocity of NADPH consumption (decrease in A₃₄₀) or product formation.
- Analysis: Plot initial velocity vs. incubation time. Fit the decay curve to a first-order decay model. Calculate the half-life (t₁/₂ = ln(2)/k_decay).
Protocol 2: High-Throughput Suitability (Z'-Factor) Assessment
Objective: To statistically validate the robustness of an assay using the NADPH-regenerating system in a microplate format. Materials: 384-well plate, regeneration system, positive control (enzyme + substrate), negative control (no enzyme or heat-inactivated), detection reagent. Procedure:
- Plate Setup: In a 384-well plate, dispense 20 μL of the complete assay mix containing the regeneration system into all wells.
- Controls: Designate 32 wells as positive controls (add 5 μL of active target enzyme). Designate 32 wells as negative controls (add 5 μL of buffer or inactive enzyme).
- Incubation & Readout: Incubate at RT for 30 minutes. Add detection reagent (if applicable) and read fluorescence/luminescence/absorbance on a plate reader.
- Calculation: For both control sets, calculate the mean (μₚ, μₙ) and standard deviation (σₚ, σₙ). Apply the Z'-factor formula: Z' = 1 - [3*(σₚ + σₙ) / |μₚ - μₙ|].
- Interpretation: Z' > 0.5 is suitable; >0.7 is excellent for HTS.
Visualizations
Title: NADPH Regeneration Cycle in a Coupled Assay System
Title: Workflow for Assessing NADPH System Stability
The Scientist's Toolkit: Essential Research Reagent Solutions
Table 2: Key Reagents for NADPH Regeneration Stability Assays
| Reagent/Solution | Function & Role in Stability | Example (Supplier) |
|---|---|---|
| Glucose-6-Phosphate Dehydrogenase (G6PDH) | Core regenerating enzyme. Thermostable variants (e.g., from Leuconostoc mesenteroides) enhance long-duration stability. | Recombinant G6PDH, lyophilized (Sigma-Aldrich, Thermo Fisher) |
| Isocitrate Dehydrogenase (ICDH) | Alternative core enzyme. Often used for lower background in certain assays. | ICDH from porcine heart (Roche) |
| NADP⁺ (β-Nicotinamide Adenine Dinucleotide Phosphate) | Oxidized cofactor substrate. High-purity, stable formulations are critical. | NADP⁺ Na₄ salt, ≥97% (Roche, Oriental Yeast) |
| Glucose-6-Phosphate (G6P) / Isocitrate | Enzymatic substrate for regeneration. Solution stability and lack of contaminants affect performance. | D-Glucose-6-phosphate disodium salt (Sigma) |
| Thermostable Inorganic Pyrophosphatase (TIPP) | Prevents inhibition from pyrophosphate accumulation, stabilizing reaction rate over time. | TIPP from Thermus thermophilus (NEB) |
| BSA or Recombinant Albumin | Stabilizes enzymes, prevents surface adsorption in low-volume HTS formats. | Fatty-acid free BSA (New England Biolabs) |
| Specialized Assay Buffer | Maintains optimal pH and ionic strength; may contain stabilizing agents (e.g., DTT, Mg²⁺). | Tris or HEPES buffer with MgCl₂ |
| Lyophilized "Master Mix" Kits | Pre-optimized, homogeneous mixtures of regeneration components for consistency in HTS. | NADP Regenerating System (Promega), Vivid CYP Screening Kits (Thermo Fisher) |
Step-by-Step Protocols: Building Your In-House NADPH Regeneration System from Scratch
Within the broader thesis on optimizing NADPH-regenerating systems for long-term metabolic stability assays, the procurement of high-purity materials is the foundational step determining experimental success. The fidelity of these assays, used to evaluate drug metabolism and enzyme kinetics in drug development, is directly compromised by contaminants in enzymes, cofactors, or buffers. This application note details critical sourcing considerations and validated protocols for establishing a robust, reproducible NADPH regeneration system.
The Scientist's Toolkit: Essential Reagents for NADPH Regeneration Systems
| Reagent / Material | Function in NADPH System | Critical Sourcing Considerations |
|---|---|---|
| Glucose-6-Phosphate Dehydrogenase (G6PDH) | Key regenerating enzyme. Catalyzes NADP⁺ reduction to NADPH using Glucose-6-Phosphate. | Seek lyophilized, microbial (e.g., Leuconostoc mesenteroides) sources; purity >90% (SDS-PAGE); specific activity >500 U/mg. Low lactonase activity is crucial. |
| NADP⁺ (Nicotinamide Adenine Dinucleotide Phosphate) | Oxidized cofactor substrate for regeneration. Final electron acceptor. | Purity ≥98% (HPLC). Sodium salt form for solubility. Verify low contamination with NADPH (<2%) to avoid background signal. |
| Glucose-6-Phosphate (G6P) | Enzymatic substrate for G6PDH. Provides reducing equivalents. | ≥99% purity (HPLC). Disodium or monosodium salt. Must be DNAse/RNAse-free if used in sensitive assays. |
| Magnesium Chloride (MgCl₂) | Essential cofactor for G6PDH activity. Stabilizes enzyme structure. | Molecular biology grade, ≥99.0% purity. Prepare fresh solutions from anhydrous salt to prevent hydrolysis. |
| Tris or Phosphate Buffer | Maintains optimal pH (7.4-8.0) for system efficiency. | USP/PhEur grade for consistency. Certified DNAse, RNAse, protease-free. Low heavy metal content. |
| Stabilizing Agents (e.g., BSA, DTT) | Protect enzyme activity over long-term assays. | Fatty-acid-free, protease-free BSA. Ultrapure DTT. Verify no interference with assay detection. |
Application Notes: Sourcing and Qualification Protocols
Enzyme Purity Verification Protocol
Objective: Confirm purity and specific activity of G6PDH. Method:
- SDS-PAGE Analysis: Dilute 5 µg of sourced G6PDH in Laemmli buffer. Heat at 95°C for 5 min. Load onto a 4-20% gradient gel alongside a broad-range protein ladder. Run at 150V for 60 min. Stain with Coomassie Blue. A single band at ~55 kDa indicates high purity.
- Specific Activity Assay: Prepare Reaction Mix: 50 mM Tris-HCl (pH 8.0), 10 mM MgCl₂, 2 mM G6P, 0.2 mM NADP⁺. Final volume 1 mL at 25°C. Procedure: Add 0.1 U of enzyme (as stated by vendor) to the mix. Immediately monitor absorbance at 340 nm (for NADPH formation) for 3 minutes. Calculation: Specific Activity (U/mg) = (ΔA₃₄₀/min × V_total × df) / (ε × l × m). Where ε(NADPH)=6220 M⁻¹cm⁻¹, l=1 cm, m=mass of enzyme in mg, df=dilution factor.
Cofactor Contamination Assessment Protocol
Objective: Quantify NADPH contamination in commercial NADP⁺ lots. Method:
- Prepare a 10 mM NADP⁺ stock solution in HPLC-grade water.
- Analyze 20 µL injection via Reverse-Phase HPLC (C18 column, 250 x 4.6 mm). Use isocratic elution: 50 mM potassium phosphate buffer (pH 6.5) at 1 mL/min. Detect at 254 nm.
- NADPH elutes earlier than NADP⁺. Integrate peak areas. Contamination % = (AreaNADPH / (AreaNADPH+Area_NADP⁺)) × 100.
Experimental Protocol: Assembling a High-Stability NADPH Regenerating System
Title: Preparation of a Regenerating System for 24-Hour Stability Assays
Reagents:
- G6PDH (500 U/mL stock in 50% glycerol/20 mM Tris, pH 7.4)
- NADP⁺ (100 mM stock in water, pH adjusted to 7.0)
- Glucose-6-Phosphate (200 mM stock in water)
- MgCl₂ (1 M stock in water)
- Tris-HCl Buffer (1 M, pH 8.0)
Procedure:
- Prepare a 10X Regeneration Cocktail master mix:
- 100 mM Tris-HCl, pH 8.0
- 20 mM MgCl₂
- 10 mM NADP⁺
- 20 mM Glucose-6-Phosphate
- 10 U/mL G6PDH (add last, gently mix)
- Filter sterilize the 10X cocktail through a 0.22 µm low-protein-binding PES membrane.
- For the stability assay, dilute the 10X cocktail to 1X in your final reaction mixture (e.g., containing your cytochrome P450 enzyme and drug substrate).
- Critical: Pre-incubate the complete reaction mixture (minus the drug substrate) at 37°C for 5 minutes to establish steady-state NADPH levels before initiating the reaction with substrate.
- Monitor NADPH concentration spectrophotometrically at 340 nm at time zero and at regular intervals (e.g., every 2 hours) over 24 hours to confirm system stability.
Data Presentation: Typical Performance Metrics of Sourced Materials
| Material Tested | Specification | Acceptable Range | Typical Value from Qualified Lot |
|---|---|---|---|
| G6PDH Purity | % Single Band (SDS-PAGE) | ≥ 90% | 95% |
| G6PDH Specific Activity | U/mg protein | ≥ 500 | 720 |
| NADP⁺ Purity (HPLC) | % Peak Area | ≥ 98.0% | 99.2% |
| NADPH in NADP⁺ | % Contamination | ≤ 2.0% | 0.8% |
| G6P Purity (HPLC) | % | ≥ 99.0% | 99.5% |
| System Stability | [NADPH] at 24h | ≥ 85% of initial | 92% |
Visualizations
Diagram Title: Core NADPH Regeneration Reaction Pathway
Diagram Title: Workflow for Building a Stable NADPH System
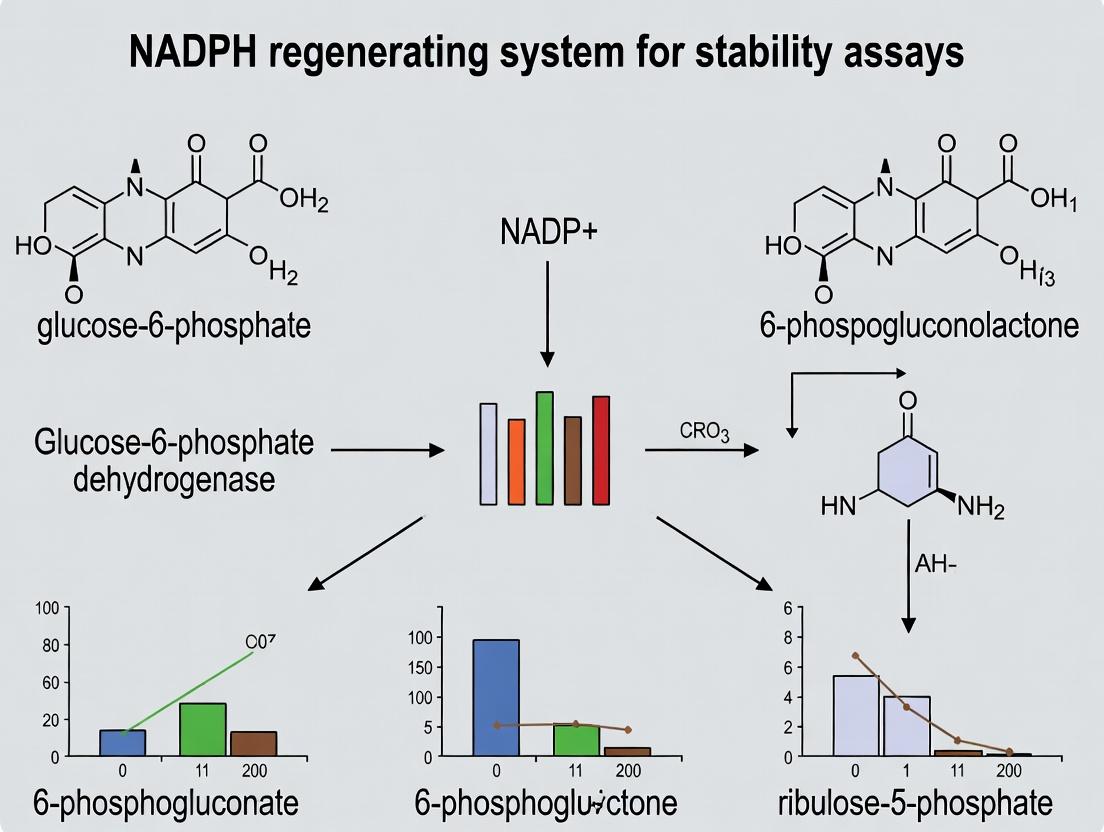
Within the broader thesis on preparing robust NADPH regenerating systems for enzyme stability and drug metabolism assays, the Glucose-6-Phosphate Dehydrogenase (G6PDH) system stands as a foundational, well-characterized method. This protocol details its application for the continuous regeneration of NADPH, a critical cofactor for cytochrome P450 (CYP) enzymes and other oxidoreductases, enabling long-term metabolic stability studies.
Principle and Pathway
G6PDH catalyzes the first committed step of the pentose phosphate pathway (PPP), oxidizing Glucose-6-Phosphate (G6P) to 6-Phosphogluconolactone while concurrently reducing NADP⁺ to NADPH.
Diagram 1: G6PDH Catalytic Reaction
Research Reagent Solutions & Essential Materials
Table 1: Key Reagents for G6PDH-Based NADPH Regeneration
| Reagent/Solution | Function & Rationale | Typical Stock Concentration |
|---|---|---|
| Recombinant G6PDH (e.g., from S. cerevisiae) | Catalytic enzyme for NADPH generation. High specific activity and stability are preferred. | 100-500 U/mL in storage buffer |
| Glucose-6-Phosphate (G6P) | The essential substrate for the regeneration reaction. | 100-500 mM in H₂O, pH ~7.0 |
| Nicotinamide Adenine Dinucleotide Phosphate (NADP⁺) | Oxidized cofactor, reduced to NADPH by G6PDH. | 10-50 mM in H₂O or buffer |
| Magnesium Chloride (MgCl₂) | Essential divalent cation cofactor for G6PDH activity. | 1 M in H₂O |
| Tris-HCl or Potassium Phosphate Buffer | Maintains optimal pH (7.5-8.0) for both G6PDH and target enzymes (e.g., CYPs). | 0.5-1.0 M, pH 7.8 |
| Target Enzyme System (e.g., CYP + Reductase) | The system consuming NADPH for stability or metabolism assays. | Varies |
Detailed Experimental Protocol
Preparation of a Master Regeneration System Cocktail
This protocol is designed for a final 1.0 mL incubation volume to support a CYP450 metabolic stability assay.
Table 2: Cocktail Setup for a 1.0 mL Assay
| Component | Final Concentration | Volume from Stock (Example Calculation) |
|---|---|---|
| Tris-HCl Buffer (pH 7.8) | 100 mM | 100 µL of 1.0 M stock |
| Glucose-6-Phosphate (G6P) | 10 mM | 20 µL of 500 mM stock |
| NADP⁺ | 1.0 mM | 20 µL of 50 mM stock |
| Magnesium Chloride (MgCl₂) | 3.0 mM | 3 µL of 1.0 M stock |
| Recombinant G6PDH | 1.0 U/mL | 2 µL of 500 U/mL stock |
| Sub-Total Volume | 145 µL | |
| Target Enzyme/Protein System | As required | e.g., 50-100 µL |
| Test Compound (in solvent) | As required (e.g., 10 µM) | e.g., 1-5 µL |
| Ultrapure Water | To final volume | To 1000 µL |
Procedure:
- Prepare a 1.5 mL microcentrifuge tube on ice.
- Sequentially add buffer, ultrapure water, MgCl₂, NADP⁺, and G6P. Mix gently by pipetting.
- Add the target enzyme system (e.g., human liver microsomes, recombinant CYP) and test compound. Mix gently.
- Initiate the reaction by adding the recombinant G6PDH. Mix thoroughly by gentle inversion.
- Immediately transfer an aliquot to a pre-warmed cuvette or plate for spectrophotometric monitoring, or place the entire tube in a shaking incubator (37°C) for time-point sampling.
Monitoring NADPH Regeneration and Consumption
Method: Spectrophotometric tracking at 340 nm.
- Prepare a reaction mixture as in Table 2, omitting the test compound for a baseline control.
- Load into a quartz cuvette (for continuous monitoring) or a 96-well UV-transparent plate.
- Record the absorbance at 340 nm (A₃₄₀) over 30-60 minutes at 30-second intervals (37°C).
- Calculate the rate of NADPH formation/steady-state concentration using the molar extinction coefficient (ε₃₄₀ = 6220 M⁻¹cm⁻¹).
Table 3: Example Kinetic Data from a Model Assay
| Time (min) | A₃₄₀ (Regeneration Only) | [NADPH] (µM)* | A₃₄₀ (Full System with CYP3A4) |
|---|---|---|---|
| 0 | 0.05 | 8.0 | 0.05 |
| 5 | 0.42 | 67.5 | 0.38 |
| 10 | 0.81 | 130.2 | 0.72 |
| 20 | 1.25 | 201.0 | 0.95 |
| 30 | 1.26 | 202.6 | 0.98 |
*Calculated using Beer-Lambert law: [NADPH] = (A₃₄₀ / 6220) * 10⁶
Diagram 2: G6PDH Stability Assay Workflow
Application Notes for Stability Assays
- Optimization is Critical: The ratio of G6PDH units to NADP⁺ and target enzyme concentration must be optimized to maintain a steady-state [NADPH] sufficient for the consuming enzyme without significant background drift.
- Substrate Depletion: Monitor test compound depletion via LC-MS/MS. A robust regenerating system will show linear metabolite formation for a longer duration compared to a single-bolus NADPH system.
- System Longevity: Under optimal conditions, this system can maintain NADPH levels for 60-120 minutes. Monitor A₃₄₀ throughout the assay to confirm stability.
- Controls: Always include:
- Complete System: All components.
- No G6P Control: Verifies NADPH consumption is regeneration-dependent.
- No Target Enzyme Control: Measures non-specific NADPH oxidation.
- Heat-Inactivated Enzyme Control.
Within the critical context of preparing robust NADPH regenerating systems for drug metabolism and stability assays, the Isocitrate Dehydrogenase (IDH) system serves as a principal enzymatic method. This application note details its operational principles, provides optimized protocols, and analyzes its suitability for various research applications in drug development.
Mechanism and Pathway
IDH catalyzes the oxidative decarboxylation of isocitrate to α-ketoglutarate, concurrently reducing NADP⁺ to NADPH. This reaction is irreversible and provides a stoichiometric and direct yield of NADPH.
Title: IDH Catalytic Reaction for NADPH Generation
Quantitative Comparison of NADPH Regeneration Systems
| System Parameter | IDH-Based System | Glucose-6-Phosphate Dehydrogenase (G6PDH) System | Formate Dehydrogenase (FDH) System |
|---|---|---|---|
| Reaction | Isocitrate → α-KG + CO₂ + NADPH | G6P → 6-PG + NADPH | Formate → CO₂ + NADH |
| Cofactor Generated | NADPH | NADPH | NADH |
| Theoretical Yield | 1 mol NADPH / mol isocitrate | 1 mol NADPH / mol G6P | 1 mol NADH / mol formate |
| Typical Rate (U/mg) | 20 - 50 | 100 - 300 | 2 - 10 |
| Byproducts | α-KG, CO₂ | 6-Phosphogluconolactone | CO₂ |
| Cost per 1000 units | $$$ | $$ | $$$$ |
| pH Optimum | 7.5 - 8.0 | 7.0 - 8.0 | 7.0 - 7.5 |
Detailed Protocol: IDH-Based NADPH Regeneration for Cytochrome P450 Stability Assays
Materials & Reagent Setup
- Tris-HCl Buffer (100 mM, pH 7.8): Maintains optimal enzymatic pH.
- Magnesium Chloride (10 mM): Essential divalent cation cofactor for IDH.
- NADP⁺ (0.5 mM): Oxidized cofactor substrate.
- D-Isocitrate (10 mM): Primary enzymatic substrate. Use trisodium salt for solubility.
- Recombinant IDH (≥ 20 U/mL): From E. coli or porcine heart. Specific activity should be verified.
- Target Enzyme (e.g., P450): The system under investigation.
- Incubation System: Thermostated water bath or plate reader at 37°C.
Procedure
- Prepare a master mix on ice containing:
- 500 µL Tris-HCl Buffer (100 mM, pH 7.8)
- 50 µL Magnesium Chloride (100 mM stock)
- 20 µL NADP⁺ (25 mM stock)
- 100 µL D-Isocitrate (100 mM stock)
- Nuclease-free water to a final volume of 980 µL.
- Pre-incubate the master mix at 37°C for 3 minutes in a spectrophotometer cuvette or assay plate.
- Initiate the regeneration reaction by adding 20 µL of recombinant IDH solution (20 U/mL).
- Monitor the increase in absorbance at 340 nm (A₃₄₀) for 2-3 minutes to confirm NADPH generation (ε₃₄₀ = 6220 M⁻¹cm⁻¹).
- Once stable generation is confirmed, immediately add the target enzyme (e.g., P450) and its specific substrate to begin the stability assay.
- Assay samples can be taken at timed intervals for analysis (e.g., HPLC, LC-MS) to quantify metabolite formation or enzyme activity loss.
Title: Workflow for P450 Assay with IDH NADPH Regeneration
Pros, Cons, and Best Uses Analysis
Advantages (Pros)
- Direct NADPH Production: Generates NADPH specifically, not NADH.
- Irreversible Reaction: Drives reaction to completion, minimizing equilibrium constraints.
- Clean Byproducts: α-Ketoglutarate is generally non-inhibitory to many enzymes.
- Well-Suited for High-Throughput: Compatible with microplate formats.
Disadvantages (Cons)
- Substrate Cost: D-isocitrate is more expensive than G6P.
- Potential Inhibition: Generated α-KG may inhibit certain enzymes in complex metabolic networks.
- Lower Catalytic Rate: Often has a lower Vₘₐₓ compared to the G6PDH system.
Best Use Cases
- Focused Oxidative Stability Assays: Where only NADPH is required and minimal interfering byproducts are desired.
- Reconstituted Monooxygenase Systems: For studying specific P450 isoforms without auxiliary enzymes.
- Coupling with α-KG-Dependent Enzymes: Where the byproduct can be utilized in a subsequent reaction.
The Scientist's Toolkit: Essential Research Reagents
| Reagent/Solution | Function in IDH System | Key Consideration |
|---|---|---|
| Recombinant IDH | Catalytic engine for NADPH regeneration. | Source (microbial vs. mammalian) affects specific activity and cost. |
| D-Isocitrate (Trisodium Salt) | Primary substrate. High purity ensures maximal NADPH yield. | Prepare fresh or aliquot and store at -20°C to prevent degradation. |
| NADP⁺ (Disodium Salt) | Oxidized cofactor electron acceptor. | Critical for stoichiometry. Verify concentration spectrophotometrically (A₂₆₀). |
| MgCl₂ or MnCl₂ | Divalent cation cofactor. Essential for IDH activity. | Mg²⁺ is most common. Some IDH isoforms prefer Mn²⁺. |
| Tris or Phosphate Buffer | Maintains optimal pH (7.5-8.5). | Avoid buffers containing amines that might interfere. |
| NADPH Standard | For calibration curves to quantify regeneration rate and efficiency. | Essential for validating the system performance before primary assay. |
Within the broader thesis on NADPH regenerating system (NRS) preparation for stability assays, this work details the integration of robust NRS into critical in vitro enzyme stability assays. Maintaining NADPH homeostasis is paramount for studying the activity and stabilization of cytochrome P450s (CYPs), reductases (e.g., NADPH-cytochrome P450 reductase, CPR), and antioxidant enzymes (e.g., Catalase, Glutathione Peroxidase). This application note provides current protocols and data for implementing a stable NRS in high-throughput and conventional assay formats to generate reliable kinetic and stabilization parameters.
The Scientist's Toolkit: Essential Research Reagent Solutions
| Reagent / Material | Function in Assay |
|---|---|
| Glucose-6-Phosphate Dehydrogenase (G6PDH) | Core regenerating enzyme. Catalyzes NADP+ reduction to NADPH using glucose-6-phosphate, maintaining cofactor supply. |
| NADP+ (Oxidized Form) | Cofactor precursor. Substrate for the regenerating system, constantly recycled to NADPH. |
| Glucose-6-Phosphate (G6P) | Energy substrate. Provides electrons for the reduction of NADP+ via G6PDH. |
| Magnesium Chloride (MgCl₂) | Cofactor for G6PDH. Essential divalent cation for optimal enzymatic activity. |
| Recombinant Human CYP Isozymes (e.g., 3A4, 2D6) | Drug-metabolizing enzymes. Target proteins for stability studies; activity is NADPH-dependent. |
| NADPH-Cytochrome P450 Reductase (CPR) | Redox partner. Transfers electrons from NADPH to CYP enzymes; stability is often assayed jointly. |
| Antioxidant Enzymes (Catalase, SOD, GPx) | Target systems. Enzymes whose protective activity against oxidative stress can be monitored under sustained NADPH supply. |
| LC-MS/MS System | Analytical tool. For quantifying metabolite formation (CYP assays) or substrate depletion with high sensitivity. |
| Fluorescent/UV-Vis Microplate Reader | Detection instrument. Enables high-throughput kinetic measurements of enzyme activity. |
NADPH Stability in Common Buffers
A stable NRS must maintain [NADPH] over assay duration. Data from a recent stability study (comparing 100 µM initial NADPH with/without NRS in 100 mM Potassium Phosphate, pH 7.4, 37°C) is summarized below.
Table 1: NADPH Stability Under Various Conditions Over 120 Minutes
| Condition | NADPH Remaining at 60 min (%) | NADPH Remaining at 120 min (%) | Observed Degradation Rate (min⁻¹) |
|---|---|---|---|
| NADPH Alone | 42.3 ± 3.1 | 18.7 ± 2.4 | 0.0152 |
| Full NRS (1 U/mL G6PDH, 5 mM G6P) | 98.5 ± 1.2 | 96.8 ± 1.5 | 0.0003 |
| NRS, No G6P | 45.1 ± 2.8 | 20.1 ± 3.0 | 0.0149 |
| NRS, No G6PDH | 41.8 ± 2.5 | 19.5 ± 2.1 | 0.0150 |
CYP450 Activity Stabilization with NRS
CYP3A4 midazolam 1'-hydroxylation activity was monitored over 2 hours with a single bolus of NADPH vs. continuous regeneration.
Table 2: CYP3A4 Metabolic Activity Sustained by NADPH Supply
| NADPH Delivery Method | Initial Rate (pmol/min/pmol CYP) | Rate at 120 min (pmol/min/pmol CYP) | % Activity Retained |
|---|---|---|---|
| Single Bolus (100 µM) | 12.5 ± 0.9 | 4.2 ± 0.5 | 33.6% |
| Continuous Regeneration (NRS) | 12.3 ± 1.1 | 11.1 ± 0.8 | 90.2% |
Antioxidant Enzyme Assay Performance
Glutathione Peroxidase (GPx) activity assay, which consumes NADPH via Glutathione Reductase coupling, benefits from NRS by preventing signal decline due to NADPH depletion.
Table 3: GPx Assay Signal Linearity with Different NADPH Formats
| Assay Condition | Linear Range (min) | R² of Kinetic Plot | Inter-assay CV (%) |
|---|---|---|---|
| Traditional (Bolus NADPH) | 0-8 | 0.991 | 8.5 |
| Integrated NRS | 0-30 | 0.999 | 3.2 |
Detailed Experimental Protocols
Protocol 1: Preparation of a Standard NADPH Regenerating System (10X Stock)
Purpose: To create a stable, long-lasting source of NADPH for enzymatic assays. Reagents:
- NADP+ Sodium Salt (e.g., Sigma N0505)
- D-Glucose-6-Phosphate (G6P) Disodium Salt
- Glucose-6-Phosphate Dehydrogenase (G6PDH), from Leuconostoc mesenteroides (preferred for NADP+ specificity)
- Magnesium Chloride (MgCl₂)
- Tris or Potassium Phosphate Buffer (pH 7.4)
Procedure:
- Prepare 10 mL of 100 mM Tris-HCl buffer, pH 7.4, containing 15 mM MgCl₂. Chill on ice.
- Dissolve the following components sequentially in the buffer:
- 41 mg NADP+ (final 5 mM)
- 30.6 mg G6P (final 10 mM)
- Gently add 100 units of G6PDH enzyme solution. Mix by slow inversion.
- Adjust final volume to 10 mL with cold buffer. Do not vortex after adding G6PDH.
- Aliquot and store at -80°C. Avoid repeated freeze-thaw cycles. Thaw on ice for use.
- Final 1X Working Concentration in Assay: 0.5 mM NADP+, 1 mM G6P, 1 U/mL G6PDH, 1.5 mM MgCl₂.
Protocol 2: CYP450 Inhibition/Stability Assay in 96-Well Format with Integrated NRS
Purpose: To measure time-dependent CYP activity for stabilization or inhibition studies with constant NADPH supply. Reagents: Recombinant CYP isoform (e.g., CYP3A4) + CPR supersomes, CYP-specific fluorogenic probe (e.g., 7-Benzyloxy-4-(trifluoromethyl)-coumarin for CYP3A4), NRS (10X stock from Protocol 1), 0.5 M Potassium Phosphate Buffer (pH 7.4).
Procedure:
- Assay Buffer: Prepare 1X incubation buffer (100 mM KPi, pH 7.4).
- Master Mix (MM): For 100 reactions, combine in order:
- 10 mL 1X Assay Buffer
- 1.1 mL of NRS (10X Stock) -> final 1X
- 100 µL of 1 mM fluorogenic probe substrate (final 10 µM)
- Optional: Test compound (inhibitor/stabilizer) in DMSO (keep DMSO ≤0.5%).
- Enzyme Dilution: Dilute CYP/CPR supersomes in cold 100 mM KPi buffer to 2X the desired final concentration (e.g., 20 pmol/mL for a 10 pmol/mL final).
- Plate Setup: Add 90 µL of Master Mix to each well of a black 96-well plate.
- Reaction Initiation: Add 10 µL of the 2X enzyme dilution to start the reaction. For negative controls, add 10 µL of buffer without enzyme.
- Kinetics Measurement: Immediately place plate in a pre-warmed (37°C) fluorescence microplate reader. Monitor fluorescence (Ex ~409 nm, Em ~460 nm for BFC) every 30-60 seconds for 60-120 minutes.
- Data Analysis: Calculate initial velocities and time-dependent changes in activity. Compare slopes (activity) between NRS and bolus NADPH conditions.
Protocol 3: Antioxidant Enzyme (Glutathione Peroxidase, GPx) Activity Assay with Coupled NRS
Purpose: To measure GPx activity by continuously monitoring NADPH consumption in a coupled enzyme system. Reagents: GPx sample, Glutathione Reductase (GR), Reduced Glutathione (GSH), Cumene Hydroperoxide (substrate), NADPH, NRS components.
Procedure:
- Prepare Reaction Mixture (per well):
- 50 mM Potassium Phosphate buffer, pH 7.0 (with 1 mM EDTA)
- 1 mM GSH
- 0.5 U/mL GR
- Integrated NRS: 0.2 mM NADP+, 1 mM G6P, 0.5 U/mL G6PDH, 1.5 mM MgCl₂.
- GPx sample (cell lysate or purified enzyme).
- Add 180 µL of the reaction mixture (without peroxide) to a UV-transparent 96-well plate. Pre-incubate at 25°C for 5 min.
- Establish baseline absorbance at 340 nm for 1 minute.
- Initiate reaction by adding 20 µL of 12 mM Cumene Hydroperoxide (final 1.2 mM).
- Immediately monitor the decrease in A₃₄₀ (NADPH consumption) for 5-10 minutes. The rate is proportional to GPx activity.
- Calculation: GPx activity = (ΔA₃₄₀/min * Total Volume) / (6.22 mM⁻¹cm⁻¹ * Sample Volume * Pathlength). The NRS ensures the rate is not limited by initial NADPH concentration.
Visualization of Workflows and Pathways
Diagram Title: CYP Assay with Integrated NRS Workflow
Diagram Title: NRS Regeneration and Enzyme Consumption Cycle
1.0 Context & Introduction Within the broader thesis on optimizing NADPH-regenerating systems (NADPH-RS) for long-term enzyme stability assays, precise component concentration is paramount. The core challenge is a tripartite optimization: minimizing reagent cost, maximizing catalytic efficiency (i.e., sustained NADPH regeneration), and maintaining an analytically robust signal-to-noise ratio (SNR) for spectrophotometric or fluorometric detection. This protocol details the systematic approach for calculating and validating these optimal concentrations.
2.0 Quantitative Data Summary: NADPH-RS Components & Cost Analysis
Table 1: Standard NADPH-RS Components with Typical Ranges & Relative Cost
| Component | Primary Function | Typical Conc. Range | Cost per µmol (Rel. Units) | Notes on SNR Impact |
|---|---|---|---|---|
| NADP+ | Oxidized cofactor substrate | 0.1 - 2.0 mM | 100 (High) | Low [NADP+] limits max signal; high [NADP+] increases background absorbance. |
| Glucose-6-Phosphate (G6P) | Reduced substrate donor | 1.0 - 10.0 mM | 10 (Low) | Must be in excess over NADP+; minimal direct impact on 340 nm signal. |
| Glucose-6-Phosphate Dehydrogenase (G6PDH) | Regenerating enzyme | 0.5 - 10.0 U/mL | 1000 (Very High) | High [G6PDH] speeds regeneration but adds protein background & cost. |
| MgCl₂ | Essential cofactor | 1.0 - 5.0 mM | 1 (Very Low) | Required for G6PDH activity; negligible cost & optical interference. |
Table 2: Calculated Optimization Matrix for a Model System
| Scenario | [NADP+] (mM) | [G6PDH] (U/mL) | Est. Regen. Rate (µM/min) | Assay Cost per Run | Predicted SNR (340 nm) | Rationale |
|---|---|---|---|---|---|---|
| Cost-Minimized | 0.15 | 0.8 | 12.5 | 1.0 (Baseline) | Low (8:1) | Minimizes expensive components; risk of rate-limiting. |
| Signal-Optimized | 0.5 | 3.0 | 48.2 | 4.2 | High (25:1) | Ensures robust signal above detector noise floor. |
| Balanced Protocol | 0.25 | 2.0 | 32.1 | 2.5 | Good (18:1) | Recommended starting point for stability assays. |
3.0 Experimental Protocols
Protocol 3.1: Determining the Minimal G6PDH Concentration for Maximal Initial Rate Objective: To define the lowest enzyme concentration yielding Vmax, ensuring the system is not rate-limiting. Materials: See "Scientist's Toolkit" (Section 5.0). Procedure:
- Prepare a master mix containing 50 mM Tris-HCl (pH 8.0), 5 mM MgCl₂, 2.0 mM NADP+, and 10 mM G6P.
- Aliquot 990 µL of master mix into a series of cuvettes.
- To each cuvette, add G6PDH to final concentrations of 0.1, 0.5, 1.0, 2.0, 5.0, and 10.0 U/mL. Start reaction with enzyme addition.
- Immediately monitor the increase in absorbance at 340 nm (A₃₄₀) for 60 seconds.
- Calculate initial velocity (ΔA₃₄₀/min) for each sample. Use ε₃₄₀ = 6220 M⁻¹cm⁻¹.
- Plot velocity vs. [G6PDH]. The point where velocity plateaus defines the minimal sufficient [G6PDH].
Protocol 3.2: Signal-to-Noise Ratio Assessment for NADPH Detection Objective: Quantify the analytical robustness of the chosen concentrations. Materials: Spectrophotometer or plate reader, black/clear flat-bottom plates. Procedure:
- Prepare the "Signal" sample: Full reaction mix with optimal concentrations (e.g., from Table 2, Balanced Protocol). Incubate 5 min.
- Prepare the "Noise" sample: Identical mix but omit G6P to prevent NADPH generation. This measures background from enzyme turbidity and NADP+ absorbance.
- Measure A₃₄₀ for both samples in triplicate, using appropriate blanks (buffer only).
- Calculate SNR: Mean(Signal - Blank) / Standard Deviation(Noise).
- An SNR > 10 is generally acceptable for quantitative assays. If lower, incrementally increase [NADP+] and reassess.
Protocol 3.3: Long-Term Stability Assay Simulation Objective: Validate the NADPH-RS's ability to maintain steady-state [NADPH] over extended times. Procedure:
- Initiate a 2 mL reaction using your optimized concentrations in a cuvette.
- Record the A₃₄₀ at time zero (t₀).
- Seal the cuvette with parafilm, incubate at your assay temperature (e.g., 25°C).
- Measure A₃₄₀ at hourly intervals for 6-8 hours.
- Convert A₃₄₀ to [NADPH]. A stable plateau (<10% decline) confirms a robust, non-limiting regenerating system for long-term assays.
4.0 Mandatory Visualizations
Title: Core NADPH Regeneration Catalytic Cycle
Title: Optimization Workflow for Cost, Efficiency, and SNR
5.0 The Scientist's Toolkit
Table 3: Essential Research Reagent Solutions for NADPH-RS Optimization
| Item | Function & Rationale | Example Supplier/ Cat. No. (for reference) |
|---|---|---|
| High-Purity NADP+ (Sodium Salt) | Primary cofactor; purity critical for low background absorbance. | Sigma-Aldrich, N0505 |
| Glucose-6-Phosphate Dehydrogenase (from yeast) | The regenerating enzyme; high specific activity reduces protein load. | Roche, 10127671001 |
| D-Glucose-6-Phosphate (Disodium Salt) | Energy source for regeneration; must be fresh to avoid hydrolysis. | Thermo Fisher, AAJ61601MA |
| Magnesium Chloride Hexahydrate | Essential divalent cation cofactor for G6PDH activity. | Various, ACS grade |
| Tris-HCl Buffer (1.0 M, pH 8.0) | Provides stable physiological pH for enzymatic activity. | Various, molecular biology grade |
| UV-Transparent Microcuvettes or Plate | For accurate absorbance measurement at 340 nm. | BrandTech, 759150D |
| Precision Spectrophotometer/ Plate Reader | Must have accurate monochromator/filter for 340 nm detection. | Agilent, Molecular Devices, etc. |
Solving Common Pitfalls: Optimizing Your NADPH System for Maximum Stability and Reproducibility
Within the critical research on NADPH regenerating system preparation for stability assays, a persistent challenge is distinguishing between signal drift caused by the instability of the primary reporter enzyme (e.g., luciferase) and failure of the cofactor regeneration system itself. Accurate diagnosis is paramount for assay development, high-throughput screening, and drug discovery workflows. This application note provides a systematic framework and detailed protocols to isolate and identify the root cause of signal decay in NADPH-dependent luminescent or fluorescent assays.
Core Diagnostic Strategy & Logical Framework
The diagnostic pathway involves sequentially eliminating potential failure points. The logical decision tree is outlined below.
Experimental Protocols
Protocol 3.1: Differential Diagnostic Assay for Signal Drift
Objective: To distinguish between reporter enzyme instability and NADPH regeneration failure.
Materials: See "Scientist's Toolkit" (Section 5). Workflow:
- Setup: In a 96-well plate, prepare the complete assay mixture containing your reporter enzyme (e.g., 5 nM luciferase), NADP⁺ (e.g., 100 µM), regeneration substrates (Glucose-6-Phosphate, 2 mM), and regeneration enzyme (G6PDH, 0.5 U/mL). Initiate the reaction.
- Time-Course Measurement: Monitor signal (e.g., luminescence) kinetically every 2-5 minutes for 60-120 minutes at controlled temperature (e.g., 25°C).
- Intervention 1 (Substrate Pulse): At the 30-minute mark, add a concentrated bolus of the primary substrate (e.g., D-luciferin) to double its initial concentration. Observe if signal is restored to initial maximum.
- Intervention 2 (NADPH Direct Quant.): At the 45-minute mark, transfer a 50 µL aliquot to a separate plate. Add 50 µL of NADPH detection reagent (e.g., based on resazurin/diaphorase) and measure fluorescence (Ex/Em ~560/590 nm). Compare to a standard curve and a time-zero aliquot.
- Intervention 3 (Fresh Enzyme Test): At the 60-minute mark, add a fresh aliquot of the reporter enzyme (equivalent to starting concentration) to the original well. Observe if the rate of signal production post-addition matches the initial rate.
Protocol 3.2: Regeneration System Stability Calibration Assay
Objective: To independently assess the longevity and efficiency of the NADPH regenerating system.
Materials: See "Scientist's Toolkit". Workflow:
- Regeneration-Only Mixture: Prepare a solution containing NADP⁺ (100 µM), G6PDH (2 U/mL), Glucose-6-Phosphate (5 mM) in assay buffer. Omit the primary reporter enzyme.
- Coupling Reaction: Add a stable, excess concentration of a coupling enzyme that continuously consumes NADPH, such as glutathione reductase (1 U/mL) and its substrate, oxidized glutathione (GSSG, 1 mM). The reduction of GSSG to GSH is directly proportional to NADPH turnover.
- Monitor Cofactor Turnover: Follow the consumption of NADPH indirectly by measuring the depletion of its UV absorbance at 340 nm over 2 hours. Alternatively, use a fluorescent NADPH sensor protein.
- Quantify Failure Rate: Calculate the rate of NADPH turnover decay. A stable regeneration system will maintain a linear rate. A decay indicates regeneration component instability (often G6PDH).
Data Presentation & Analysis
Table 1: Diagnostic Outcomes from Signal Drift Experiments
| Diagnostic Test | Observation | Interpretation | Corrective Action |
|---|---|---|---|
| Fresh Substrate Pulse | Signal returns to ~100% initial maximum. | Signal drift due to substrate depletion/inhibition. Not an enzyme or regeneration fault. | Optimize substrate concentration; use stabilized substrate formulations. |
| Direct NADPH Measurement | NADPH level remains >90% of initial. | Regeneration system is functional. Drift is likely due to reporter enzyme instability (denaturation, inhibition). | Stabilize enzyme with carriers (BSA), additives (glycerol), or use a more robust enzyme mutant. |
| Direct NADPH Measurement | NADPH level declines <70% of initial. | Regeneration system is failing to maintain cofactor pool. | Investigate regeneration enzyme (G6PDH) stability; increase its concentration or use a thermostable homolog. |
| Fresh Enzyme Addition | Signal rate recovers fully. | Confirms regeneration system is intact. Primary enzyme was the unstable component. | As above for enzyme stabilization. |
| Fresh Enzyme Addition | Signal rate does not recover. | Combined failure: Regeneration system is spent AND primary enzyme is inactivated. | Re-optimize both systems independently. Consider alternative regeneration pairs (e.g., isocitrate/IDH). |
Table 2: Key Stability Parameters for Common Regeneration System Components
| Component | Typical Conc. in Assay | Common Stability Issues | Recommended Stabilizers |
|---|---|---|---|
| NADP⁺ / NADPH | 50 – 200 µM | Chemical degradation in solution (hydrolysis). | Prepare fresh stocks in neutral pH buffer; store aliquots at -80°C. |
| Glucose-6-Phosphate (G6P) | 1 – 5 mM | Generally stable. | Prepare in assay buffer, store at -20°C for short term. |
| Glucose-6-Phosphate Dehydrogenase (G6PDH) | 0.5 – 2 U/mL | Thermal denaturation, surface adsorption. | Use in glycerol-containing storage buffers; add non-reactive carrier proteins (BSA 0.1 mg/mL). |
| Reporter Enzyme (e.g., Luciferase) | Variable | Thermal instability, oxidative damage, proteolysis. | Add DTT (1 mM), glycerol (5%), BSA (0.1 mg/mL). Use engineered stable variants. |
The Scientist's Toolkit: Key Research Reagent Solutions
| Item | Function & Rationale |
|---|---|
| Recombinant, Purified G6PDH (Thermostable) | The core regeneration enzyme. Thermophilic variants (from Thermoplasma acidophilum) offer superior stability in long assays. |
| NADP⁺ Sodium Salt (High Purity) | The oxidised cofactor precursor. High purity minimizes contaminant-driven degradation. Essential for preparing standardized stocks. |
| D-Luciferin (Stabilized Formulation) | Common substrate for firefly luciferase-based NADPH reporting. Stabilized salts (e.g., D-luciferin potassium) prevent auto-oxidation and baseline drift. |
| Firefly Luciferase (Mutant, Stable) | The primary reporter. Engineered mutants (e.g., Ultra-Glo, Luc2) provide enhanced half-life and resistance to assay inhibitors. |
| Resazurin Sodium Salt | Redox dye for direct NADPH quantification. In the presence of diaphorase, reduction by NADPH to fluorescent resorufin provides a direct readout. |
| BSA (Protease-Free, Fatty Acid-Free) | Universal stabilizing agent. Reduces surface adsorption of enzymes, buffers against denaturation, and stabilizes dilute protein solutions. |
| Microplate, 96-well, Low Binding, White | For luminescence assays. White plates maximize signal reflection; low-binding surface minimizes enzyme loss. |
| Kinetic-Compatible Plate Reader | Equipped with temperature control (25-37°C) and injectors for performing the diagnostic substrate/enzyme pulses during a run. |
Optimizing pH, Ionic Strength, and Temperature for Cofactor and Enzyme Longevity
Within the framework of developing robust NADPH regenerating systems for drug metabolism and stability assays, maintaining the functional longevity of both the cofactor (NADPH) and the regenerating enzyme (e.g., glucose-6-phosphate dehydrogenase, G6PDH) is paramount. This application note details the systematic optimization of three critical physicochemical parameters—pH, ionic strength, and temperature—to maximize stability. Protocols for assessing degradation kinetics and a toolkit for implementation are provided.
NADPH is a critical reducing agent in cytochrome P450 and reductase assays used in drug development. In situ regeneration systems are employed to maintain NADPH pools, but their efficiency is limited by the instability of both NADPH and the regenerating enzyme under suboptimal conditions. Degradation leads to nonlinear reaction kinetics and unreliable assay data. Optimizing the solution environment is a foundational step in ensuring reproducible and long-lasting activity for high-throughput screening and kinetic studies.
Quantitative Effects of Environmental Parameters
The following tables summarize key quantitative findings on the stability of NADPH and common regenerating enzymes.
Table 1: Optimal Ranges for Stability of NADPH and Regenerating Enzymes
| Component | Optimal pH Range | Optimal Temperature (°C) | Critical Ionic Strength Consideration | Half-life (t½) under Optimal Conditions* |
|---|---|---|---|---|
| NADPH (in buffer) | 7.0 - 8.5 | 4 | Low to moderate (< 150 mM) | > 48 hours (at 4°C) |
| Glucose-6-Phosphate Dehydrogenase (G6PDH) | 7.5 - 8.5 | 4 - 25 (assay temp) | Moderate (50-200 mM) | > 1 week (at 4°C) |
| Formate Dehydrogenase (FDH) | 7.0 - 8.0 | 4 - 30 | Low (< 100 mM) | Several days (at 4°C) |
| Phosphite Dehydrogenase (PTDH) | 7.5 - 8.5 | 4 - 37 | Varies by isoform | High thermostability reported |
Note: t½ is highly dependent on specific formulation and purity. Data compiled from recent stability studies.
Table 2: Impact of Deviation from Optimal Conditions on Half-life (t½)
| Parameter | Deviation Condition | Component | Approximate t½ Reduction vs. Optimal | Primary Degradation Mechanism |
|---|---|---|---|---|
| pH | pH 6.0 (acidic) | NADPH | 70-80% | Acid-catalyzed hydrolysis |
| pH | pH 9.5 (alkaline) | G6PDH | 60-70% | Denaturation & aggregation |
| Temperature | 25°C vs. 4°C | NADPH | ~50% | Increased oxidation rate |
| Temperature | 37°C vs. 25°C | Most Dehydrogenases | 40-60% | Thermal denaturation |
| Ionic Strength | Very High (>500 mM) | G6PDH (Leuconostoc) | 30-50% | Competitive ion binding, structure disruption |
Experimental Protocols
Protocol 1: Determining Optimal pH for Enzyme-Cofactor Complex Stability
Objective: To identify the pH that maximizes the sustained activity of an NADPH regenerating system. Materials: Purified regenerating enzyme (e.g., G6PDH), NADP⁺, enzyme substrate (e.g., Glucose-6-Phosphate), universal buffer system (e.g., 50 mM HEPES, 50 mM Tris, adjust pH as needed), spectrophotometer. Procedure:
- Prepare 1 mL reaction mixtures in universal buffer at pH increments from 6.5 to 9.0 (e.g., 6.5, 7.0, 7.5, 8.0, 8.5, 9.0).
- Each mixture contains: 50 mM buffer, 0.2 mM NADP⁺, 5 mM G6P, 2 mM MgCl₂ (cofactor).
- Pre-incubate mixtures at assay temperature (e.g., 25°C) for 5 minutes.
- Initiate reactions by adding a fixed activity unit (e.g., 0.1 U) of G6PDH.
- Immediately monitor the increase in absorbance at 340 nm (A₃₄₀) for 5 minutes to determine initial velocity (Vᵢ).
- Aliquot each pH reaction and incubate at 4°C. At intervals (0, 24, 48 hrs), measure residual activity by repeating step 5 with a fresh aliquot.
- Plot Residual Activity (%) vs. Time for each pH. The pH yielding the highest residual activity over time is optimal for longevity.
Protocol 2: Assessing Ionic Strength Effects on Cofactor Stability
Objective: To quantify NADPH degradation kinetics under varying ionic strengths. Materials: NADPH, buffer (e.g., 50 mM Tris-HCl, pH 7.8), NaCl, spectrophotometer. Procedure:
- Prepare 500 µL solutions of 0.1 mM NADPH in Tris buffer containing 0, 50, 150, 300, and 500 mM NaCl.
- Immediately measure the A₃₄₀ of each fresh solution (t=0).
- Aliquot solutions into sealed, low-binding microtubes. Incubate one set at 4°C and a duplicate set at 25°C.
- At defined intervals (0, 2, 6, 24, 48 hours), measure A₃₄₀ for each aliquot.
- Calculate remaining NADPH concentration using the molar extinction coefficient (ε₃₄₀ = 6220 M⁻¹cm⁻¹).
- Plot Ln([NADPH]ₜ/[NADPH]₀) vs. Time. The slope gives the degradation rate constant (k) for each condition. Compare k across ionic strengths and temperatures.
The Scientist's Toolkit: Key Research Reagent Solutions
| Reagent/Material | Function & Rationale for Longevity |
|---|---|
| HEPES or Tris Buffer (50-100 mM) | Provides stable pH in the optimal 7.5-8.5 range, minimizing acid/base-catalyzed degradation. |
| MgCl₂ (1-5 mM) | Common essential cofactor for many dehydrogenases (e.g., G6PDH); stabilizes enzyme structure and active site. |
| Dithiothreitol (DTT, 0.5-1 mM) | Reducing agent that protects enzyme cysteine residues from oxidation, maintaining activity. |
| Bovine Serum Albumin (BSA, 0.1% w/v) | Stabilizes enzymes in dilute solutions by preventing surface adsorption and aggregation. |
| EDTA (0.1-0.5 mM) | Chelates trace heavy metals that can catalyze oxidation of NADPH and enzyme thiol groups. |
| Glycerol (10-20% v/v) | Cryoprotectant and stabilizer for enzyme storage; reduces molecular mobility, slowing denaturation. |
| Inert Atmosphere (Argon/N₂) | Sparging solutions or storing under inert gas limits oxidative degradation of NADPH. |
Visualizing the Optimization Strategy and Workflow
Title: Workflow for Optimizing Regeneration System Longevity
Title: How Parameters Affect Cofactor and Enzyme Stability
Within the context of preparing robust NADPH-regenerating systems for enzymatic stability assays in drug development, managing secondary interference is critical. Substrate inhibition, product inhibition, and the accumulation of inhibitory byproducts (e.g., ADP, phosphate) can severely skew assay results by altering enzyme kinetics and stability profiles. This document provides application notes and protocols to identify, mitigate, and control these factors to ensure data fidelity in NADPH-dependent reactions.
Table 1: Common Inhibitors in NADPH-Regenerating Systems
| Inhibitor Type | Example Compound | Typical Source | Approx. IC50/Ki | Mitigation Strategy |
|---|---|---|---|---|
| Substrate | NADP+ (High conc.) | Initial cofactor prep | >2 mM | Optimize concentration to 0.1-0.5 mM |
| Product | NADP+ | Glucose-6-phosphate dehydrogenase (G6PDH) reaction | 0.05-0.2 mM | Use excess substrate; employ coupled enzyme removal |
| Byproduct | ADP | Kinase or ATP-dependent regenerating steps | 0.1-0.5 mM | Add apyrase or creatine phosphate/kinase system |
| Byproduct | Phosphate (Pi) | Hydrolysis reactions, buffer | Variable | Use phosphate-free buffers (e.g., HEPES, Tris) |
| Byproduct | Ammonium (NH4+) | Glutamate dehydrogenase reactions | 5-10 mM | Use alternative dehydrogenase (e.g., formate) |
Table 2: Performance Metrics of Mitigation Strategies
| Strategy | Target Interference | Assay Stability Improvement | Additional Cost/Complexity |
|---|---|---|---|
| Enzyme Coupling (e.g., Pyruvate to Lactate) | NADPH depletion, NADP+ buildup | 40-60% longer linear phase | Moderate (additional enzyme) |
| Scavenger Enzymes (Apyrase for ADP) | ADP inhibition | Reduces inhibition by >70% | Low |
| Dialysis or Buffer Exchange | Small molecule byproducts | Restores >90% initial activity | High, time-consuming |
| Continuous-Flow Membrane Reactor | All soluble inhibitors | Enables steady-state for >24h | Very High |
| Cofactor Regeneration with Formate Dehydrogenase | Minimizes NH4+ production | Eliminates ammonium concern | High (enzyme cost, O2 sensitivity) |
Experimental Protocols
Protocol 3.1: Diagnosing Inhibition Type in NADPH-Regeneration
Objective: Determine if observed assay slowdown is due to substrate or product inhibition. Materials:
- Purified target enzyme (e.g., cytochrome P450 reductase).
- NADPH-regenerating system: 0.2 mM NADP+, 10 mM Glucose-6-phosphate (G6P), 2 U/mL G6PDH.
- Assay buffer (50 mM HEPES-KOH, pH 7.4, 5 mM MgCl2).
- Microplate reader (capable of 340 nm absorbance). Procedure:
- Prepare a master mix containing buffer, G6P, and G6PDH.
- Aliquot master mix into a 96-well plate. In Column A, vary NADP+ concentration (0.01, 0.05, 0.1, 0.5, 1.0, 2.0 mM). In Column B, vary G6P concentration (1, 2, 5, 10, 20 mM) with fixed 0.2 mM NADP+.
- Initiate reaction by adding target enzyme.
- Monitor A340 decline (NADPH consumption) for 30 minutes at 30°C.
- Analysis: Plot initial velocity (ΔA340/min) vs. substrate concentration. A velocity decrease at the highest NADP+ concentrations indicates substrate inhibition. A linear velocity decrease over time at fixed [NADP+] suggests product (NADP+) accumulation.
Protocol 3.2: Implementing a Byproduct Scavenging System
Objective: Extend the linear operational period of an NADPH-regenerating system by removing ADP. Materials:
- Standard NADPH-regenerating system (as in 3.1).
- Apyrase (ATP-diphosphohydrolase, 50-200 U/mL stock).
- Alternative system: 10 mM Creatine Phosphate, 20 U/mL Creatine Kinase. Procedure:
- Set up two parallel 1 mL reactions with the standard regenerating system and target enzyme.
- Reaction A (Control): No additions.
- Reaction B (Test): Supplement with 5 U/mL apyrase OR 10 mM creatine phosphate + 20 U/mL creatine kinase.
- Incubate at 37°C. At t=0, 15, 30, 60, 90, 120 minutes, remove 100 µL aliquots.
- Quench aliquots and measure residual target enzyme activity via a standard endpoint assay.
- Analysis: Compare activity half-life (t1/2) between Reaction A and B. An increased t1/2 in Reaction B confirms byproduct interference mitigation.
Diagrams
Diagram 1: Inhibition Pathways in NADPH Cycling
Diagram 2: Scavenging Protocol Workflow
The Scientist's Toolkit
Table 3: Essential Research Reagent Solutions
| Item | Function in Managing Interference | Example Product/Catalog # (Note) |
|---|---|---|
| Glucose-6-Phosphate Dehydrogenase (G6PDH) | Core regenerating enzyme. Reduces NADP+ to NADPH. | Sigma G-5885; use from Leuconostoc mesenteroides (NADP+-preferred). |
| NADP+ Sodium Salt | Essential oxidized cofactor. Maintain optimal conc. to avoid substrate inhibition. | Roche 10107824001; prepare fresh, high-purity stocks. |
| Apyrase (ATP-diphosphohydrolase) | Scavenges inhibitory ADP (and ATP) by converting to AMP + Pi. | NEB M0398S; useful in ATP-coupled systems. |
| Creatine Phosphate / Creatine Kinase | Alternative ADP scavenging system. Regenerates ATP from ADP. | Sigma 27920 & 37520; minimizes phosphate buildup vs. apyrase. |
| Formate Dehydrogenase (FDH) | For clean NADPH regeneration from formate, producing only CO2 (no NH4+). | Sigma F-8648; requires anaerobic handling. |
| Dialysis Cassettes (3.5 kDa MWCO) | Physical removal of small molecule inhibitors after prolonged reactions. | Thermo Fisher 66380; for buffer exchange. |
| HEPES or TES Buffer | Phosphate-free buffering to prevent Pi interference with kinases/phosphatases. | Thermo Fisher 15630080; use at 50-100 mM. |
| Enzyme-based Phosphate Scavenger | e.g., Purine Nucleoside Phosphorylase + 7-methylguanosine. Removes inorganic phosphate. | Hampton Research HR2-611 (in screening kits). |
Within the context of developing a robust NADPH regenerating system for stability assays, the selection of stabilizing agents is paramount. Long-term enzymatic activity and reagent integrity depend on mitigating aggregation, oxidation, and thermal denaturation. This note details the application of Bovine Serum Albumin (BSA), Dithiothreitol (DTT), and cryoprotectants, providing protocols for their use in preserving system functionality over extended periods.
Key Stabilizing Agents: Functions and Mechanisms
Bovine Serum Albumin (BSA)
BSA acts as a non-specific stabilizer by adsorbing to surfaces, preventing protein adhesion, and sequestering hydrophobic compounds. It reduces loss of low-concentration enzymes via surface adsorption and provides a mild reducing environment.
Dithiothreitol (DTT)
DTT is a reducing agent that maintains thiol groups in a reduced state, critical for enzymes like glutathione reductase in NADPH regeneration cycles. It prevents disulfide bond formation that can lead to irreversible inactivation.
Cryoprotectants (e.g., Glycerol, Sucrose)
Polyols like glycerol stabilize proteins via the preferential exclusion mechanism, raising the free energy of the denatured state. They also suppress ice crystal formation during freeze-thaw cycles.
Table 1: Efficacy of Stabilizing Agents in NADPH System Activity Retention
| Agent & Concentration | Function | % Activity Retained (4°C, 7 days) | % Activity Retained (-80°C, 30 days) |
|---|---|---|---|
| None (Control) | - | 35% | 22% |
| BSA (0.1% w/v) | Surface Passivation | 68% | 55% |
| DTT (1 mM) | Redox Buffer | 58% | 45% |
| Glycerol (20% v/v) | Cryoprotection | 75%* | 92% |
| BSA + DTT + Glycerol | Combined Stabilization | 89%* | 96% |
*Assayed at 4°C without freezing.
Table 2: Recommended Working Concentrations for Long-Term Assays
| Reagent | Typical Concentration Range | Key Consideration for NADPH Systems |
|---|---|---|
| BSA | 0.1 – 1.0% (w/v) | Use fatty-acid-free for dehydrogenase assays. |
| DTT | 0.5 – 5 mM | Fresh preparation required; sensitive to oxidation. |
| Glycerol | 10 – 25% (v/v) | >30% may inhibit some enzymes. |
| Sucrose | 5 – 20% (w/v) | Non-chelating alternative. |
Experimental Protocols
Protocol 1: Formulating a Stabilized NADPH Regenerating System for Long-Term Storage
Objective: Prepare a glucose-6-phosphate dehydrogenase (G6PD)-based regenerating system stable for >30 days at -80°C. Materials:
- NADP+ (Sigma, N0505)
- Glucose-6-phosphate (G6P)
- Recombinant G6PD
- Magnesium chloride (MgCl₂)
- Tris-HCl buffer (pH 7.5)
- Fatty-acid-free BSA (Thermo Fisher, AM2616)
- Ultrapure DTT (GoldBio, DTT10)
- Molecular biology-grade glycerol
Procedure:
- Prepare a 2X concentrated master mix in 50 mM Tris-HCl, 10 mM MgCl₂ (pH 7.5):
- 2 mM NADP+
- 20 mM Glucose-6-phosphate
- 0.2% (w/v) fatty-acid-free BSA
- 2 mM DTT (add fresh from a 1M stock)
- Gently mix and aliquot into low-protein-binding microtubes.
- To the aliquot designated for freezing, add an equal volume of 40% (v/v) glycerol in the same Tris/MgCl₂ buffer to achieve a final 20% glycerol concentration. Mix by gentle inversion.
- Flash-freeze aliquots in liquid nitrogen and store at -80°C.
- For use: Thaw aliquots rapidly at 25°C and keep on ice. Add recombinant G6PD enzyme immediately prior to assay initiation. Do not re-freeze.
Protocol 2: Testing Stabilizer Efficacy in a 7-Day Stability Assay
Objective: Quantify the protective effect of BSA and DTT on NADPH regeneration activity at 4°C. Method:
- Prepare five 1 mL samples of the NADPH regenerating system (1X concentration) as per Protocol 1, but without glycerol and omitting G6PD:
- Sample A: No additives (Control)
- Sample B: With 0.1% BSA
- Sample C: With 1 mM DTT
- Sample D: With 0.1% BSA + 1 mM DTT
- Sample E: Complete system with G6PD added (Time-Zero Control)
- Store samples A-D at 4°C in the dark.
- At days 0, 1, 3, and 7, remove 100 µL from each stored sample and from the Time-Zero Control (E).
- Initiate the reaction by adding a fixed activity of G6PD (if not already present) to all assay samples.
- Monitor NADPH generation kinetically at 340 nm (ε = 6220 M⁻¹cm⁻¹) for 3 minutes.
- Calculate initial velocity (nmol/min). Express activity as a percentage of the Time-Zero Control (E) from day 0.
The Scientist's Toolkit: Key Research Reagent Solutions
Table 3: Essential Materials for Stabilized Assay Preparation
| Item (Example Supplier) | Function in Stabilization | Critical Note |
|---|---|---|
| Fatty-Acid-Free BSA (Thermo Fisher) | Reduces surface adsorption; stabilizes dilute proteins. | Standard BSA may contain enzymes that interfere. |
| Ultrapure DTT (GoldBio) | Maintains sulfhydryl groups in reduced state. | Prepare fresh 1M stock in water, aliquot, store at -20°C. |
| Molecular Biology Grade Glycerol (Sigma) | Cryoprotectant; stabilizes protein structure. | Autoclave for sterile applications. |
| D-Sucrose (MilliporeSigma) | Non-permeating cryoprotectant and osmolytes. | Useful for systems sensitive to reducing agents. |
| Trehalose (Carbosynth) | Biocompatible stabilizer for lyophilization. | Protects during drying by water replacement. |
| Low-Protein-Bind Tubes (Corning) | Minimizes loss of proteins/reagents to tube walls. | Essential for low-concentration components. |
Visualizations
Diagram 1: How Stabilizing Agents Counteract Degradation Pathways
Diagram 2: Protocol for Preparing a Stabilized NADPH System
Lyophilization and Storage Strategies for Pre-Mixed Regeneration Components
Within the thesis research focused on developing stable, high-throughput NADPH regenerating systems for cytochrome P450 inhibition and metabolic stability assays, the formulation and long-term storage of pre-mixed regeneration components is a critical bottleneck. This application note details optimized lyophilization and storage protocols for the key enzymatic components—glucose-6-phosphate dehydrogenase (G6PDH) and NADP+—along with stabilizers, to produce ready-to-use pellets with enhanced stability, eliminating daily reconstitution variability and improving assay reproducibility.
Key Research Reagent Solutions
| Reagent/Material | Function in Regeneration System | Key Consideration |
|---|---|---|
| Glucose-6-Phosphate Dehydrogenase (G6PDH) | Key enzyme catalyzing NADP+ reduction to NADPH using Glucose-6-Phosphate. | Thermolabile; requires stabilizers (e.g., trehalose, BSA) during lyophilization. |
| β-Nicotinamide Adenine Dinucleotide Phosphate (NADP+) | Oxidized cofactor substrate reduced to NADPH by G6PDH. | Hygroscopic; sensitive to hydrolytic degradation in solution. |
| Lyoprotectants (Trehalose, Sucrose) | Form amorphous glass matrix during freeze-drying, stabilizing protein structure and preventing aggregation. | Typically used at 5-10% (w/v) in final lyophilization mix. |
| Bovine Serum Albumin (BSA) | Acts as a bulking agent and protein stabilizer, reducing surface adsorption of G6PDH. | Use fatty-acid-free grade to avoid interference. |
| Tris or HEPES Buffer | Maintains pH during lyophilization and upon reconstitution. | Avoid phosphate buffers if lyophilized with cations (risk of pH shift). |
Table 1: Stability of Lyophilized vs. Liquid NADPH Regeneration System Components at -20°C
| Component & Form | Initial Activity/Concentration | Residual Activity/Concentration After 6 Months | Key Degradation Mode |
|---|---|---|---|
| G6PDH, Liquid (-20°C) | 100 U/mL | 72 ± 5% | Protein aggregation, loss of native conformation. |
| G6PDH, Lyophilized Pellet (-20°C) | 100 U/pellet | 98 ± 2% | Minimal, provided moisture <1%. |
| NADP+, Liquid (-20°C) | 100 mM | 85 ± 3% | Hydrolytic cleavage to nicotinamide. |
| NADP+, Lyophilized in Matrix (-20°C) | 100 µmol/pellet | 99 ± 1% | Oxidation if packaged under air; use inert gas. |
| Pre-mixed G6PDH/NADP+/Trehalose Pellet | 100% NADPH Gen. Rate | 96 ± 2% NADPH Gen. Rate | Slight delay in initial reconstitution kinetics. |
Table 2: Effect of Lyoprotectant Formulation on Reconstitution Time and Initial Activity
| Lyophilization Formulation | Cake Appearance | Reconstitution Time (s, 1mL) | Initial G6PDH Activity Recovery (%) |
|---|---|---|---|
| G6PDH + NADP+ only | Collapsed, brittle | >120 | 65 ± 8 |
| + 5% Sucrose | Partial collapse | 45 ± 10 | 88 ± 4 |
| + 5% Trehalose + 0.1% BSA | Intact, porous | 22 ± 3 | 99 ± 2 |
| + 10% Trehalose | Intact, hard | 60 ± 12 | 97 ± 2 |
Experimental Protocols
Protocol 4.1: Formulation and Aliquotting for Lyophilization
- Prepare a master mix on ice containing:
- 100 mM Tris-HCl buffer, pH 7.8.
- 5% (w/v) D-(+)-Trehalose dihydrate.
- 0.1% (w/v) Fatty-acid-free Bovine Serum Albumin (BSA).
- 2.0 mM NADP+ (disodium salt).
- 2.0 U/mL Glucose-6-Phosphate Dehydrogenase (from Leuconostoc mesenteroides).
- Gently mix by inversion. Avoid vortexing to prevent protein shearing.
- Filter sterilize the solution using a 0.22 µm PVDF syringe filter.
- Precisely aliquot 1.0 mL of the filtered solution into each well of a sterile, non-binding, 2mL lyophilization glass vial or a specialized lyo-plate.
- Place the filled vials/plates on a pre-cooled shelf in the lyophilizer or transfer to a -80°C freezer for initial freezing.
Protocol 4.2: Optimized Lyophilization Cycle
Note: Parameters are for a pilot-scale manifold or shelf freeze-dryer. Scale as needed.
- Freezing: Ramp shelf temperature to -50°C at 1°C/min. Hold for 2 hours to ensure complete solidification.
- Primary Drying: Apply vacuum to reach 100 µBar. Increase shelf temperature to -35°C at 0.5°C/min. Hold for 48 hours. Condenser temperature should be <-55°C.
- Secondary Drying: Gradually ramp shelf temperature to +25°C over 5 hours. Hold at 25°C and 50 µBar for 10 hours.
- Backfill & Seal: At the end of the cycle, backfill vials with dry, inert argon or nitrogen gas to atmospheric pressure. Immediately seal vials with rubber stoppers and aluminum crimp caps under the inert atmosphere. For plates, use heat-sealed foil pouches with desiccant under nitrogen.
Protocol 4.3: Quality Control and Reconstitution
- Moisture Analysis: Using a coulometric Karl Fischer titrator, analyze the residual moisture of 3 random vials from each batch. Accept if <1.0% (w/w).
- Visual Inspection: All cakes should be intact, porous, and white/off-white without collapse or melt-back.
- Reconstitution & Activity Assay: a. Add 1.0 mL of sterile, cold assay buffer (or water) directly to one pellet. b. Gently swirl (do not vortex) until fully dissolved (~20-30 seconds). c. Perform a standard NADPH generation assay: In a UV-transparent cuvette, mix 0.1 mL reconstituted mix, 0.8 mL 100 mM Tris pH 7.8, 0.05 mL 20 mM Glucose-6-Phosphate. Monitor the linear increase in A340 for 2 minutes. d. Calculate recovered activity against a fresh, non-lyophilized standard mix.
Diagrams
Title: Lyophilization and Assay Workflow
Title: NADPH Regeneration in Metabolic Assay
Benchmarking Performance: Validating Your System Against Commercial Kits and Best Practices
Within the research thesis on optimizing NADPH regenerating systems for long-term enzyme stability assays, establishing robust validation criteria for the regenerating enzymes themselves is paramount. Two critical kinetic parameters must be empirically verified: Linear Reaction Velocity and Cofactor Turnover Number (TON). Linear velocity confirms the assay conditions support a constant reaction rate, essential for accurate coupling. The TON quantifies the catalytic efficiency and operational lifetime of the regenerating enzyme (e.g., glucose-6-phosphate dehydrogenase, G6PDH), directly impacting the sustainability of the NADPH pool. This document provides detailed application notes and protocols for determining these criteria.
Key Concepts & Validation Targets
Linear Reaction Velocity: The initial rate of the reaction where product formation is directly proportional to time, indicating that substrate is not limiting, enzyme is stable, and product inhibition is negligible. This must be established for the NADPH-generating reaction under proposed assay conditions.
Cofactor Turnover Number (TON): The total number of NADPH molecules each molecule of regenerating enzyme can produce before inactivation under specified conditions. It is a measure of the enzyme's operational stability and is calculated as: TON = (Total moles of NADPH produced) / (Total moles of active enzyme).
Research Reagent Solutions Toolkit
| Reagent / Material | Function in Validation Assays |
|---|---|
| Purified Regenerating Enzyme (e.g., G6PDH) | The catalyst for NADPH regeneration. Must be highly purified to avoid side reactions. |
| NADP⁺ (Oxidized Form) | The cofactor substrate to be reduced to NADPH. |
| Enzyme-Specific Substrate (e.g., Glucose-6-Phosphate) | The electron donor for the reduction of NADP⁺. |
| Buffer System (e.g., Tris-HCl, pH 8.0) | Maintains optimal pH for enzyme activity and stability. |
| MgCl₂ or Other Cofactors | Often required as a cofactor for enzymes like G6PDH. |
| Spectrophotometer / Plate Reader | For continuous monitoring of NADPH formation at 340 nm. |
| Stopping Solution (e.g., Acid or Base) | Quenches the reaction at specific time points for discontinuous assays. |
Experimental Protocol: Establishing Linear Reaction Velocity
Objective: To verify that the initial rate of NADPH production by the regenerating enzyme is constant over a defined period under the chosen assay conditions.
Procedure:
- Prepare Reaction Mix (1 mL standard cuvette):
- Buffer: 950 µL of appropriate assay buffer (e.g., 50 mM Tris-HCl, 5 mM MgCl₂, pH 8.0).
- Substrate: Add G6P to a final concentration of 5 mM.
- Cofactor: Add NADP⁺ to a final concentration of 0.5 mM.
- Equilibrate the mixture in a spectrophotometer at the assay temperature (e.g., 25°C).
Initiate Reaction:
- Add 50 µL of diluted G6PDH solution to yield a final activity of ~0.1 U/mL.
- Mix rapidly and commence monitoring absorbance at 340 nm (A₃₄₀).
Data Acquisition:
- Record A₃₄₀ every 10-15 seconds for 5-10 minutes.
- Perform the reaction in triplicate.
Data Analysis:
- Convert A₃₄₀ to NADPH concentration using the extinction coefficient (ε₃₄₀ = 6.22 mM⁻¹cm⁻¹).
- Plot [NADPH] versus time.
- Perform linear regression on the initial data points. The reaction is considered linear within the period where R² ≥ 0.98.
- The slope of the linear region is the linear reaction velocity (v_linear), expressed in µM/min.
Acceptance Criterion: The plotted progress curve must show a linear phase (R² ≥ 0.98) lasting for at least 3-5 minutes, which should exceed the interval between measurements in the coupled stability assay.
Experimental Protocol: Determining Cofactor Turnover Number (TON)
Objective: To measure the total catalytic output of the regenerating enzyme before significant inactivation in the presence of saturating substrate and cofactor.
Procedure:
- Set Up High-Volume Reaction:
- In a sealed microcentrifuge tube maintained at assay temperature, combine:
- Buffer, G6P (5 mM final), and NADP⁺ (0.5 mM final) in a total volume of 500 µL.
- Add a precisely quantified amount of G6PDH (e.g., 5 pmoles, based on active site titration or vendor-provided specific activity).
- In a sealed microcentrifuge tube maintained at assay temperature, combine:
Monitor Reaction to Completion:
- Incubate the mixture at constant temperature.
- Periodically (e.g., every 15-30 minutes), remove a 50 µL aliquot and quench it with 5 µL of 1M HCl.
- Neutralize an aliquot of the quenched sample with an equivalent amount of base.
- Measure the total [NADPH] in the neutralized aliquot spectrophotometrically.
Endpoint Determination:
- Continue until the [NADPH] plateaus for two consecutive time points, indicating reaction completion (enzyme inactivation or substrate depletion).
TON Calculation:
- Determine the Total Moles of NADPH Produced at the plateau from the final concentration and total reaction volume.
- Divide by the Total Moles of Active Enzyme initially added.
- TON = (Total NADPH produced, in moles) / (Moles of G6PDH added).
Acceptance Criterion for Stability Assays: The TON must be significantly greater than the total NADPH turnover required during the entire planned duration of the long-term stability assay. A minimum safety factor of 10x is recommended.
Table 1: Example Validation Data and Acceptance Criteria for a G6PDH-based NADPH Regenerator
| Parameter | Method | Target Value (Example) | Purpose in Stability Assay |
|---|---|---|---|
| Linear Velocity (v_linear) | Continuous A₃₄₀ monitoring | ≥ 1.2 µM/min, R² ≥ 0.98 over 5 min | Ensures coupling reaction does not become rate-limiting. |
| Linear Phase Duration | From progress curve | ≥ 5 minutes | Must exceed sampling interval of main assay. |
| Turnover Number (TON) | Discontinuous endpoint assay | ≥ 50,000 mol NADPH / mol enzyme | Confirms enzyme can sustain regeneration for entire assay duration. |
| Required TON Safety Factor | Calculation | >10x (vs. total assay need) | Ensures robustness against enzyme lot variability. |
Visualizing the Validation Workflow and Kinetic Context
Diagram 1: Validation Workflow for NADPH Regenerator
Diagram 2: Kinetic Parameters in NADPH Regeneration
Within the broader thesis on preparing robust NADPH regenerating systems for drug metabolism stability assays, the choice between in-house preparation and commercial kits is pivotal. Stability assays, such as those measuring the intrinsic clearance of drug candidates in liver microsomes or hepatocytes, require consistent and efficient NADPH regeneration to sustain cytochrome P450 activity. This analysis compares the cost, performance, and operational considerations of both approaches to inform protocol selection for high-throughput and research settings.
Quantitative Data Comparison: In-House vs. Commercial Kits
Table 1: Cost-Benefit & Performance Analysis Summary
| Parameter | In-House System (Typical Formulation) | Commercial Regeneration Kits (e.g., Corning, Thermo Fisher, BioVision) |
|---|---|---|
| Upfront Material Cost per 100 mL* | ~$15 - $30 | ~$150 - $400 |
| Key Components | Glucose-6-Phosphate (G6P), NADP⁺, Glucose-6-Phosphate Dehydrogenase (G6PDH), MgCl₂ | Lyophilized or concentrated blends of the above; often includes buffers. |
| Preparation Time | 30-60 minutes (weighing, solubilization, QC) | 5-10 minutes (reconstitution) |
| Consistency/Lot Variability | Subject to component source variability; requires in-house QC. | High batch-to-batch consistency; QC provided by vendor. |
| Stability After Prep | 4-8 hours on ice (G6PDH activity loss); best prepared fresh. | Often stable for weeks when stored as per instructions (e.g., -20°C aliquots). |
| Flexibility | Highly flexible; concentrations can be adjusted for specific assays. | Fixed ratios; optimized for general use but less adaptable. |
| Critical Performance Metric: Lag Phase | Can be minimized (<1 min) with optimal G6PDH activity. | Consistently short and optimized; critical for rapid start of reactions. |
| Required Technical Skill | High (understanding of biochemistry, calibration). | Low (follow manufacturer's protocol). |
| Best Suited For | Large-scale screening labs, where cost savings outweigh prep time; custom assay development. | Medium-throughput labs, GLP environments, labs prioritizing reproducibility and time savings. |
*Cost estimates based on current list prices for reagent-grade components versus commercial kits for microsomal incubations. Volumes scaled for typical high-throughput screening needs.
Experimental Protocols for Comparison
Protocol 1: Preparation of In-House NADPH Regenerating System
Objective: To prepare a fresh, 10X concentrated NADPH regenerating solution for use in metabolic stability assays.
Materials (Research Reagent Solutions):
- Solution A (100mM Glucose-6-Phosphate): Dissolve 282 mg of G6P (disodium salt) in 5 mL of ultrapure water. Aliquot and store at -20°C.
- Solution B (10mM NADP⁺): Dissolve 8.3 mg of NADP⁺ (disodium salt) in 1 mL of ultrapure water. Aliquot and store at -80°C.
- Solution C (G6PDH Suspension): Commercially available enzyme (e.g., from Leuconostoc mesenteroides). Store at 4°C.
- Solution D (1M MgCl₂): Dissolve 2.03 g of MgCl₂·6H₂O in 10 mL of water. Autoclave or filter sterilize. Store at room temperature.
- Assay Buffer: 100 mM Potassium Phosphate Buffer, pH 7.4.
Procedure:
- Thaw Solutions A, B, and D on ice.
- In a 1.5 mL microcentrifuge tube on ice, combine the following to make a 1 mL 10X stock:
- 100 µL Solution A (100mM G6P) → Final [10mM]
- 100 µL Solution B (10mM NADP⁺) → Final [1mM]
- 100 µL Solution D (1M MgCl₂) → Final [100mM]
- 10 µL Solution C (G6PDH, ~1000 U/mL) → Final [~10 U/mL]
- 690 µL Assay Buffer
- Mix gently by inversion. Do not vortex the enzyme.
- Quality Control: Perform a kinetic absorbance assay at 340 nm by adding 100 µL of the 10X stock to 900 µL of buffer in a quartz cuvette. The absorbance increase (due to NADPH formation) should be rapid and linear. Calculate the regeneration rate.
- Dilute this 10X stock 1:10 into the final incubation mixture (e.g., containing microsomes and test compound). Use immediately.
Protocol 2: Utilization of a Commercial Regeneration Kit
Objective: To reconstitute and use a commercial NADPH regeneration kit for a cytochrome P450 inhibition assay.
Materials:
- Commercial NADPH Regeneration System (e.g., Corning Gentest NADPH Regenerating System, Catalog #451220).
- Ultrapure water, pre-chilled.
- Assay Buffer (as specified by the assay protocol).
Procedure:
- Retrieve the kit components (typically vials of Solution A (NADP⁺), Solution B (G6P), and sometimes a separate G6PDH vial) from -20°C storage. Place on ice.
- Reconstitute each vial with the volume of ultrapure water specified in the product insert to create the recommended stock concentrations (e.g., Solution A to 33 mM NADP⁺, Solution B to 165 mM G6P).
- For a 1 mL final incubation volume requiring a 1X regenerating system, combine directly in the reaction tube:
- 10 µL of reconstituted Solution A (NADP⁺)
- 10 µL of reconstituted Solution B (G6P)
- 5 µL of G6PDH suspension (or as per insert)
- X µL of MgCl₂ solution (if not included in the kit buffers; follow insert)
- Y µL of Assay Buffer
- Test compounds, enzyme (microsomes), and substrate.
- Mix gently by pipetting. Initiate the reaction, typically by the addition of the enzyme or regenerating system mix. The kit is optimized for immediate use without further QC.
Visualizations: Pathways & Workflow
Diagram 1: NADPH Regeneration Pathway in Stability Assays
Diagram 2: Experimental Decision Workflow
The Scientist's Toolkit: Key Research Reagent Solutions
Table 2: Essential Materials for NADPH-Regeneration Based Stability Assays
| Item | Typical Source/Example | Critical Function in Assay |
|---|---|---|
| Glucose-6-Phosphate (G6P) | Sigma-Aldrich (G7879), Roche | The energy-rich substrate oxidized by G6PDH to initiate the regeneration cycle. |
| β-Nicotinamide Adenine Dinucleotide Phosphate (NADP⁺) | Sigma-Aldrich (N0505), Oriental Yeast | The oxidized cofactor reduced to NADPH, the essential electron donor for CYPs. |
| Glucose-6-Phosphate Dehydrogenase (G6PDH) | Roche (10127671001), Sigma (G6378) | The catalytic enzyme that couples G6P oxidation to NADP⁺ reduction. |
| Magnesium Chloride (MgCl₂) | Various high-purity suppliers | Essential divalent cation cofactor for optimal G6PDH enzymatic activity. |
| Potassium Phosphate Buffer | In-house preparation from salts (KH₂PO₄/K₂HPO₄) | Maintains physiological pH (7.4) for both microsomal enzymes and the regenerating system. |
| Pooled Human Liver Microsomes (pHLM) | Corning, XenoTech, BioIVT | The source of drug-metabolizing cytochrome P450 enzymes for intrinsic clearance assays. |
| Commercial Regeneration Kit | Corning Gentest, Thermo Fisher SRE0105 | Integrated, QC-tested solution providing all necessary components for consistent regeneration. |
| LC-MS/MS System | e.g., Sciex, Agilent, Waters | The analytical backbone for quantifying the depletion of parent drug over time in stability assays. |
Application Notes
Within the overarching thesis on optimizing NADPH regenerating systems (NRS) for in vitro metabolic stability assays, a critical application is the precise characterization of drug-drug interaction (DDI) potential. The integrity and consistency of the NRS—typically comprising NADP+, glucose-6-phosphate, and glucose-6-phosphate dehydrogenase—directly influence the accurate measurement of key pharmacokinetic (PK) parameters for cytochrome P450 (CYP450) enzymes. This case study examines how a robust NRS preparation impacts the determination of enzyme half-life (T₁/₂), inhibition constant (IC₅₀), and subsequent in vitro-in vivo extrapolation (IVIVE).
An unstable or suboptimal NRS leads to non-linear NADPH depletion, causing erroneous velocity calculations in both time-dependent (TDI) and reversible inhibition assays. This introduces significant variability in derived PK parameters, compromising the prediction of clinical DDIs. The following data, gathered from recent methodological studies, underscores the sensitivity of these parameters to assay conditions.
Table 1: Impact of NRS Quality on Derived CYP450 PK Parameters
| Parameter | Optimal NRS Condition | Suboptimal NRS (e.g., NADPH Depletion) | Consequence for DDI Prediction |
|---|---|---|---|
| CYP450 T₁/₂ (min) | Stable, linear reaction velocity (e.g., 45.2 ± 3.1 for CYP3A4) | Apparent prolongation or shortening (e.g., 62.5 ± 8.7 or 32.4 ± 7.9) | Misclassification of TDI potential (false negative/positive). |
| IC₅₀ (µM) | Accurate, reproducible (e.g., 12.3 µM [95% CI: 10.5-14.1]) | Shifted IC₅₀; wider confidence intervals (e.g., 8.1 µM [95% CI: 5.0-18.3]) | Over/under-estimation of reversible inhibition risk. |
| Kinetic Constant (kᵢₙₐcₜ, min⁻¹) | Reliably calculated from linear inactivation phase | Non-linear plots; inaccurate kᵢₙₐcₜ estimation | Flawed calculation of inactivation efficiency (kᵢₙₐcₜ/Kᵢ). |
| IVIVE Scaling Factor | Robust, data-driven | Highly variable, unreliable | Inaccurate prediction of clinical AUC change. |
Experimental Protocols
Protocol 1: Preparation of a Stable NADPH Regenerating System (NRS) Objective: To prepare a consistent NRS for use in CYP450 inhibition and stability assays.
- Prepare Stock Solutions:
- 100 mM NADP⁺ in purified water. Adjust pH to ~7.4. Store at -80°C in aliquots.
- 500 mM Glucose-6-Phosphate (G6P) in water. Store at -20°C.
- Glucose-6-Phosphate Dehydrogenase (G6PDH): Reconstitute lyophilized powder per manufacturer's instructions to ~100 U/mL in buffer. Store at -80°C.
- Working NRS (10X Concentration): For a final 1X concentration of 1 mM NADP⁺, 10 mM G6P, and 1 U/mL G6PDH, combine:
- NADP⁺ stock (100 mM): 100 µL
- G6P stock (500 mM): 200 µL
- G6PDH stock (100 U/mL): 100 µL
- 0.1 M Potassium Phosphate Buffer (pH 7.4): 600 µL
- Total Volume: 1.0 mL. Prepare fresh daily and keep on ice.
- Quality Control: Verify NRS performance by monitoring the linear production of NADPH spectrophotometrically at 340 nm (ε = 6220 M⁻¹cm⁻¹) over 60 minutes in a control incubation without test article.
Protocol 2: Determination of CYP450 IC₅₀ Using a Robust NRS Objective: To determine the half-maximal inhibitory concentration (IC₅₀) of a compound for a specific CYP isoform.
- Reaction Setup: In a 96-well plate, pre-incubate human liver microsomes (HLM, 0.1 mg/mL) with seven concentrations of test compound (spanning expected IC₅₀ range) and the 1X NRS in potassium phosphate buffer (pH 7.4) for 5 min at 37°C.
- Reaction Initiation: Start the reaction by adding a CYP isoform-specific probe substrate (e.g., midazolam for CYP3A4, phenacetin for CYP1A2) at its approximate Kₘ concentration.
- Termination & Analysis: Stop reactions at a linear time point (e.g., 10 min) with an equal volume of stop solution (e.g., acetonitrile with internal standard). Centrifuge, and analyze supernatant via LC-MS/MS to quantify metabolite formation.
- Data Analysis: Plot percentage of remaining enzyme activity (relative to vehicle control) vs. log[inhibitor]. Fit data to a four-parameter logistic model to calculate IC₅₀.
Protocol 3: Determination of Time-Dependent Inhibition (TDI) and Inactivation Half-life (T₁/₂) Objective: To assess if a compound causes irreversible CYP450 inactivation and determine the inactivation half-life.
- Primary Incubation: Incubate HLM with test compound (at a single concentration) and NRS at 37°C. Remove aliquots at multiple time points (e.g., 0, 5, 10, 15, 20, 30 min).
- Dilution & Secondary Activity Assay: Dilute each aliquot 10-fold into a secondary incubation containing NRS and a high concentration of probe substrate. This dilutes the test compound below its reversible IC₅₀, measuring only irreversibly inactivated enzyme.
- Residual Activity Measurement: After a short secondary incubation (e.g., 5 min), stop reactions and quantify metabolite formation via LC-MS/MS.
- Data Analysis: Plot natural log of residual enzyme activity (%) vs. primary incubation time. The slope of the linear portion equals -kₒbₛ (observed inactivation rate constant). Calculate T₁/₂ = ln(2) / kₒbₛ. The kᵢₙₐcₜ and Kᵢ can be derived from kₒbₛ at multiple inhibitor concentrations.
Visualizations
NRS Role in CYP450 Inactivation Pathway
Experimental Workflow for CYP450 T1/2 Determination
The Scientist's Toolkit: Essential Research Reagents
| Item | Function in CYP450 PK Assays |
|---|---|
| High-Purity NADP⁺ | Essential oxidized cofactor; purity is critical to prevent background noise and ensure efficient reduction by the NRS. |
| Glucose-6-Phosphate (G6P) | Substrate for G6PDH, driving the continuous regeneration of NADPH from NADP⁺. |
| Glucose-6-Phosphate Dehydrogenase (G6PDH) | The enzyme catalyst of the NRS, converting G6P and NADP⁺ to 6-phosphogluconolactone and NADPH. |
| Pooled Human Liver Microsomes (HLM) | Gold-standard enzyme source containing physiologically relevant levels and ratios of human CYP450 isoforms. |
| Isoform-Specific Probe Substrates | Selective fluorometric or MS-detectable substrates (e.g., Bupropion for CYP2B6) to measure individual CYP activity. |
| LC-MS/MS System with UPLC | For sensitive, specific, and high-throughput quantification of metabolite formation from probe substrates. |
| Potassium Phosphate Buffer (pH 7.4) | Standard physiological buffer for maintaining optimal pH and ionic strength for CYP450 activity. |
| Time-Dependent Inhibition Positive Controls | Known inactivators (e.g., Erythromycin for CYP3A4) to validate assay performance and NRS stability. |
1. Introduction & Context Within a thesis focused on developing a robust NADPH regenerating system for drug metabolism and stability assays, assessing reproducibility is paramount. The reliability of data on metabolite formation, enzyme kinetics, or oxidative stress responses hinges on the consistent performance of the NADPH regeneration cycle (involving enzymes like glucose-6-phosphate dehydrogenase). This document outlines protocols and application notes to rigorously evaluate inter-assay (run-to-run) and inter-operator variability, establishing confidence in the prepared system’s stability and performance.
2. Key Variability Metrics & Quantitative Summary Data from a hypothetical validation study using a standard CYP450 inhibition assay with the NADPH regenerating system are summarized below.
Table 1: Inter-Assay Variability (Single Operator, n=6 Assays over 3 Days)
| Metric | CYP3A4 Control Activity (nmol/min/mg) | IC50 of Reference Inhibitor (Ketoconazole, nM) | Background NADPH Depletion Rate (ΔA340/min) |
|---|---|---|---|
| Mean | 8.5 | 28.5 | -0.0021 |
| SD | 0.42 | 2.1 | 0.00015 |
| %CV | 4.9% | 7.4% | 7.1% |
| Acceptable Criteria | CV < 15% | CV < 20% | CV < 10% |
Table 2: Inter-Operator Variability (Three Operators, Same Protocol)
| Operator | CYP2C9 Activity (nmol/min/mg) | Signal (S)/Background (B) Ratio | Intra-Run %CV (n=3 replicates) |
|---|---|---|---|
| A | 5.6 | 12.1 | 4.2% |
| B | 5.9 | 11.4 | 5.1% |
| C | 5.2 | 10.8 | 6.0% |
| Overall Mean ± SD | 5.57 ± 0.35 | 11.43 ± 0.66 | 5.1% ± 0.91% |
| Inter-Operator %CV | 6.3% | 5.8% | 17.8% |
3. Experimental Protocols
Protocol 3.1: Assessing Inter-Assay Variability of the NADPH Regenerating System
- Objective: Quantify run-to-run precision of the enzymatic regeneration system within a specific assay format.
- Materials: See "The Scientist's Toolkit" (Section 5).
- Procedure:
- Prepare a master mix of the NADPH regenerating system (final concentrations: 1.3 mM NADP⁺, 3.3 mM G6P, 0.4 U/mL G6PDH, 3.3 mM MgCl₂ in pH 7.4 buffer). Aliquot and freeze at -80°C for the study duration.
- On three non-consecutive days, thaw one aliquot per assay run.
- For each run, perform a standard CYP450 activity assay (e.g., using a luminescent or fluorescent substrate) in triplicate, using a control microsomal protein and a single inhibitor concentration.
- Include a blank reaction (without enzyme) in each run to monitor non-specific NADPH depletion (measure absorbance at 340 nm for 10 mins).
- Record the primary enzyme activity output and the blank depletion rate.
- Calculate the mean, standard deviation (SD), and coefficient of variation (%CV) for the activity and depletion rate across all runs.
Protocol 3.2: Assessing Inter-Operator Variability
- Objective: Determine the impact of different analysts on assay results using the same protocol and reagents.
- Materials: As in Protocol 3.1, with a single, centrally prepared master reagent batch.
- Procedure:
- Three trained operators independently execute the same assay protocol (e.g., CYP2C9 activity with tolbutamide) on the same day.
- Each operator prepares their own serial dilutions of substrate/inhibitor from the same stock solutions and uses an aliquot from the common NADPH regenerating system master mix.
- Each operator runs the assay in triplicate.
- Record raw data, calculate enzyme activity and Signal/Background ratio for each operator.
- Perform a one-way ANOVA or calculate the overall mean, SD, and %CV across operators' means to quantify inter-operator variability.
4. Visualization of Workflows and Relationships
Diagram Title: Validation Workflow for Reproducibility Checks
Diagram Title: NADPH Regeneration Cycle in CYP Assay
5. The Scientist's Toolkit: Essential Research Reagent Solutions Table 3: Key Reagents and Materials for Reproducibility Studies
| Item | Function / Role in Reproducibility | Example & Notes |
|---|---|---|
| Lyophilized or Glycerol Stocks of G6PDH | Provides consistent enzymatic activity for NADPH regeneration across experiments. | Recombinant microbial source (e.g., from Leuconostoc mesenteroides) for high stability. Aliquot to avoid freeze-thaw cycles. |
| NADP⁺ and G6P (High-Purity Salts) | Substrate and cofactor for the regeneration system. Purity impacts background noise. | ≥98% purity, spectrophotometrically tested. Prepare stock solutions in validated buffer, pH-adjusted. |
| Assay-Specific Enzyme Source | The biological catalyst whose activity is being measured (e.g., CYP450). | Human liver microsomes (HLM) or recombinant CYP enzymes. Use a characterized, single lot for a validation study. |
| Fluorogenic/Luminogenic Probe Substrate | Enables sensitive, high-throughput measurement of target enzyme activity. | e.g., 7-benzyloxy-4-(trifluoromethyl)-coumarin (BFC) for CYP3A4. Consistent substrate quality is critical. |
| Positive Control Inhibitor | Validates assay sensitivity and correct system function. | e.g., Ketoconazole (CYP3A4), Sulfaphenazole (CYP2C9). Use a well-characterized reference standard. |
| Low-Binding Microplates & Tips | Minimizes non-specific adsorption of enzymes/reagents, a source of variability. | Polypropylene or specific treated polystyrene plates. |
| Calibrated Liquid Handling Systems | Ensures accurate and precise dispensing of reagents, especially critical for serial dilutions. | Regularly serviced and calibrated multichannel pipettes or automated dispensers. |
Within the broader thesis on NADPH regeneration system preparation for stability assays, the adaptation of these systems for continuous coupled assays and high-throughput screening (HTS) represents a critical advancement. This application note details the methodologies to transition from endpoint stability measurements to dynamic, continuous readouts suitable for enzyme kinetic studies and large-scale compound library screening in drug discovery.
Core Principles of Continuous Coupled NADPH Systems
A continuous coupled assay links the primary enzymatic reaction of interest to the oxidation or reduction of NADPH, which is itself continuously regenerated. This allows for real-time monitoring of the primary reaction rate without substrate depletion. For HTS, the system must be robust, miniaturizable, and compatible with automated liquid handlers and plate readers.
Research Reagent Solutions Toolkit
| Reagent/Material | Function in Continuous/HTS Assay |
|---|---|
| Glucose-6-Phosphate Dehydrogenase (G6PDH) | The canonical NADPH regenerating enzyme. Converts Glucose-6-Phosphate and NADP+ to 6-Phosphogluconolactone and NADPH. |
| Isocitrate Dehydrogenase (IDH) | Alternative regenerating enzyme; uses Isocitrate and NADP+ to yield α-Ketoglutarate, CO2, and NADPH. Offers system flexibility. |
| NADP+ (Oxidized Form) | Essential cofactor substrate for the regenerating enzyme. Must be highly pure and stable. |
| Regeneration Substrate (G6P or Isocitrate) | Fuel for the regenerating enzyme. Concentration is optimized to avoid rate-limiting effects. |
| Target Enzyme & Substrate | The enzyme and its specific substrate for which activity/ inhibition is being measured. |
| Detection Enzyme & Probe | Enzyme (e.g., glutathione reductase) and probe (e.g., DTNB) that couples NADPH consumption to a detectable signal (e.g., colorimetric, fluorescent). |
| HTS-Optimized Buffer | Contains stabilizers (BSA, glycerol), antioxidants (DTT), and salts to maintain activity in low-volume, long-term assays. |
| 384 or 1536-Well Microplates | Low-volume plates with clear bottoms for optical assays, compatible with automation. |
| Non-Reacting Plate Sealer | Prevents evaporation during kinetic reads in plate readers (e.g., adhesive or thermal seals). |
Protocol for a Continuous Coupled Cytochrome P450 Inhibition Assay
Objective: To measure real-time inhibition of a cytochrome P450 (CYP) enzyme via a continuous coupled NADPH consumption assay in 384-well format.
Principle: CYP enzyme converts substrate to product, consuming O2 and oxidizing NADPH. NADPH is regenerated by G6PDH. The net NADPH concentration, detected by its intrinsic fluorescence (Ex 340 nm / Em 460 nm), remains steady until a CYP inhibitor is added, causing a decrease in the consumption rate and a rise in NADPH fluorescence.
Materials:
- Recombinant CYP enzyme (e.g., CYP3A4)
- Specific CYP fluorogenic substrate (e.g., 7-benzyloxy-4-trifluoromethylcoumarin for CYP3A4)
- NADPH Regeneration System: 1.3 mM NADP+, 3.3 mM Glucose-6-Phosphate, 0.4 U/mL G6PDH, 3.3 mM MgCl2.
- Assay Buffer: 100 mM Potassium Phosphate, pH 7.4.
- Test inhibitors in DMSO.
- 384-well black-walled, clear-bottom microplates.
- Multichannel pipettes or automated liquid handler.
- Fluorescent plate reader with kinetic capability.
Procedure:
- Plate Preparation: Dilute compounds in DMSO and pin-transfer 50 nL to assay plates. Include vehicle (DMSO) control wells and a control well with a potent inhibitor (e.g., Ketoconazole).
- Master Mix Preparation: Prepare Master Mix A on ice: Assay Buffer, CYP enzyme (final 10-50 nM), and fluorogenic substrate (final substrate concentration at Km).
- Regeneration System Preparation: Prepare Master Mix B: Assay Buffer, NADP+, G6P, and MgCl2. Keep G6PDH separate until just before dispensing.
- Initiation: Add G6PDH to Master Mix B. Immediately, using an automated dispenser, add Master Mix A (containing enzyme and substrate) to all wells of the assay plate. Follow immediately with Master Mix B (containing full regeneration system). Final assay volume: 50 µL.
- Kinetic Measurement: Immediately place plate in pre-warmed (37°C) plate reader. Shake for 10 seconds. Initiate kinetic reading of fluorescence (Ex 340/Em 460) every 30-60 seconds for 30-60 minutes.
- Data Analysis: Plot fluorescence vs. time. The initial linear slope is proportional to CYP activity. Calculate % inhibition relative to vehicle control.
HTS Adaptation and Optimization Data
Table 1: Optimization Parameters for HTS-Compatible NADPH-Coupled Assay
| Parameter | Typical Range Tested | Optimized Value (Example) | Impact on Assay |
|---|---|---|---|
| Final DMSO Concentration | 0.1% - 2.0% | ≤ 1.0% | Minimizes enzyme inhibition and solvent artifacts. |
| Enzyme Concentration | 5 - 100 nM | 20 nM | Ensures signal is within dynamic range and cost-effective. |
| NADP+ Concentration | 0.5 - 2.0 mM | 1.3 mM | Saturating for regeneration, not cost-prohibitive. |
| G6PDH Concentration | 0.1 - 1.0 U/mL | 0.4 U/mL | Ensures regeneration rate >> CYP consumption rate. |
| Incubation Temperature | 25°C - 37°C | 37°C | Physiological relevance; increases reaction rate. |
| Z'-Factor (HTS QC metric) | 0 - 1 | > 0.7 | Indicates excellent separation between high (vehicle) and low (inhibitor) controls. |
| Signal-to-Background Ratio | - | > 5:1 | Robust signal for reliable detection. |
Critical Protocol: Determining Regeneration System Capacity
Before HTS, it is essential to verify the regeneration system can maintain linear NADPH levels under maximal target enzyme activity.
Procedure:
- Set up the continuous assay as in Section 4, but omit test compounds.
- Vary the concentration of the target enzyme (e.g., CYP) across a wide range, including concentrations higher than planned for HTS.
- Monitor the kinetic trace of NADPH fluorescence. A stable, horizontal trace indicates regeneration matches consumption. An upward drift indicates regeneration exceeds consumption; a downward drift indicates consumption is outpacing regeneration, leading to eventual substrate depletion.
- The maximum target enzyme activity supported by a given regeneration system mix is the point just before a consistent downward drift is observed. The HTS enzyme concentration should be 3-5 fold below this capacity.
Visualization of Workflows and Pathways
Diagram 1: Continuous Coupled Assay with NADPH Regeneration (86 chars)
Diagram 2: HTS Protocol for Continuous NADPH-Coupled Assay (73 chars)
Conclusion
A meticulously prepared and validated NADPH regenerating system is the cornerstone of high-quality, reproducible enzyme stability assays, directly impacting the reliability of kinetic and inhibition data in drug discovery. By mastering the foundational biochemistry, implementing robust methodological protocols, proactively troubleshooting performance issues, and rigorously validating against benchmarks, researchers can significantly enhance data fidelity. The future of these systems lies in their adaptation for more complex, physiologically relevant assays—such as those incorporating human hepatocytes or microphysiological systems—and their integration into automated, AI-driven screening platforms. Investing in a stable NADPH regeneration strategy is not merely a technical step but a critical contributor to derisking the drug development pipeline and accelerating the translation of preclinical findings to clinical success.