Ligand-Based Drug Design: Approaches, Applications, and Advances in Modern Drug Discovery
This article provides a comprehensive overview of Ligand-Based Drug Design (LBDD), a pivotal computational approach in modern drug discovery when the 3D structure of a biological target is unavailable.
Ligand-Based Drug Design: Approaches, Applications, and Advances in Modern Drug Discovery
Abstract
This article provides a comprehensive overview of Ligand-Based Drug Design (LBDD), a pivotal computational approach in modern drug discovery when the 3D structure of a biological target is unavailable. Tailored for researchers, scientists, and drug development professionals, it explores the foundational principles of LBDD, details key methodologies like Quantitative Structure-Activity Relationship (QSAR) and pharmacophore modeling, and discusses their practical applications in lead identification and optimization. The content further addresses common challenges and optimization strategies, validates LBDD through comparisons with structure-based methods, and highlights the growing impact of integrated and AI-enhanced approaches for developing novel therapeutics.
The Foundations of Ligand-Based Drug Design: Principles and Core Concepts
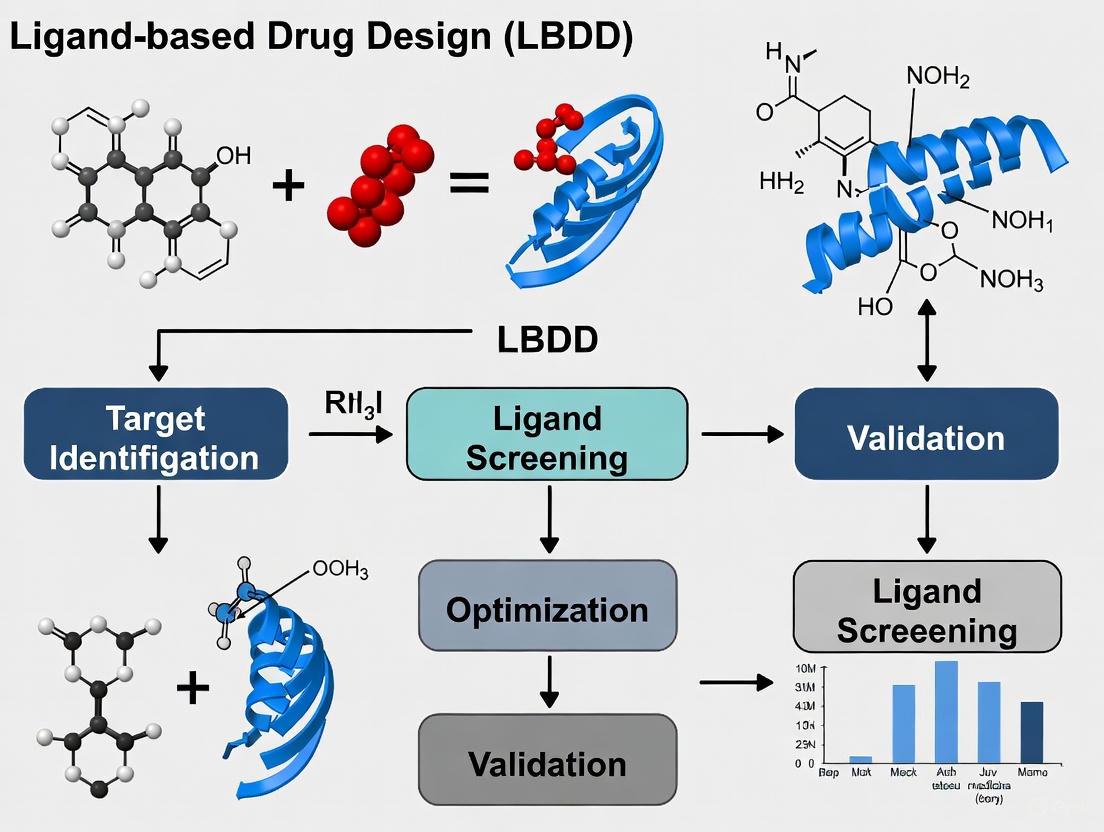
Ligand-Based Drug Design (LBDD) represents a cornerstone computational strategy in modern drug discovery for targets lacking three-dimensional structural data. This application note delineates the core principles, methodologies, and protocols of LBDD, framing it within the broader context of rational drug design. We provide a detailed examination of quantitative structure-activity relationship (QSAR) modeling and pharmacophore development as primary techniques, supplemented by structured workflows and reagent solutions. Designed for researchers and drug development professionals, this document serves as a practical guide for implementing LBDD strategies to accelerate lead identification and optimization, particularly for recalcitrant targets such as membrane proteins and novel disease mechanisms.
In the drug discovery pipeline, the absence of a resolved three-dimensional (3D) structure for a target protein—often the case for membrane-associated proteins like G-protein coupled receptors (GPCRs), nuclear receptors, and transporters—presents a significant hurdle [1]. Ligand-Based Drug Design (LBDD) emerges as a powerful solution to this challenge, enabling drug discovery efforts based solely on knowledge of small molecules (ligands) known to modulate the target's biological activity [2] [3]. This approach is fundamentally independent of any direct structural information about the target itself, operating instead on the principle that compounds with similar structural and physicochemical properties are likely to exhibit similar biological activities [4].
The core of LBDD is the establishment of a Structure-Activity Relationship (SAR), which correlates variations in the chemical structures of known ligands with their measured biological activities [5] [1]. By iteratively analyzing this SAR, researchers can elucidate the key features responsible for biological activity and rationally design new compounds with improved potency, selectivity, and pharmacokinetic profiles [1]. The continued relevance of LBDD is underscored by the fact that over 50% of FDA-approved drugs target membrane proteins, for which 3D structures are often unavailable, ensuring LBDD's critical role in the foreseeable future of drug development [1].
Theoretical Foundations and Key LBDD Methods
LBDD methodologies range from simple similarity comparisons to complex quantitative models, all aiming to translate chemical information into predictive tools for compound design.
Quantitative Structure-Activity Relationship (QSAR)
QSAR is a mathematical modeling technique that relates a suite of numerical descriptors, which encode the physicochemical and structural properties of a set of ligands, to their quantitative biological activity [1] [6]. The general workflow involves calculating molecular descriptors for compounds with known activity, using statistical methods to build a model that links these descriptors to the activity, and then using the validated model to predict the activity of new, untested compounds [7].
Molecular Descriptors can be one-dimensional (1D), such as molecular weight or hydrogen bond count; two-dimensional (2D), derived from the molecular graph and including topological indices; or three-dimensional (3D), capturing spatial attributes like molecular volume and stereochemistry [1]. The choice of statistical method for model building depends on the data characteristics. Multiple Linear Regression (MLR) and Partial Least Squares (PLS) are common for linear relationships, while machine learning techniques like Support Vector Machines (SVM) can handle non-linearity [1]. A critical final step is model validation using techniques like cross-validation and external test sets to ensure the model's predictive robustness and avoid overfitting [1] [7].
Pharmacophore Modeling
A pharmacophore model is an abstract representation of the steric and electronic features that are necessary for a molecule to interact with a biological target and trigger its pharmacological response [1] [6]. It captures the essential molecular interactions—such as hydrogen bond donors/acceptors, hydrophobic regions, and charged groups—and their relative spatial arrangement, without being tied to a specific chemical scaffold [5]. This makes pharmacophore models exceptionally useful for scaffold hopping, the process of identifying novel chemotypes that possess the same critical interaction capabilities as known active ligands [2]. Once developed, these models can be used as 3D queries to perform virtual screening of large compound databases to identify new potential hit compounds [5].
Molecular Similarity and Machine Learning
Foundational to LBDD is the similarity principle, which posits that structurally similar molecules are likely to have similar properties [4]. This principle is often implemented through similarity searching in chemical databases using molecular fingerprints or other 2D/3D descriptors [1]. More recently, machine learning (ML) algorithms have been increasingly employed to build robust predictive models for both activity (QSAR) and physicochemical properties (QSPR) [8] [2]. These ML models can uncover complex, non-linear patterns within large chemical datasets that may be missed by traditional statistical methods, further enhancing the power and predictive accuracy of LBDD campaigns [2].
Table 1: Comparison of Primary LBDD Methods
| Method | Core Principle | Key Requirements | Primary Output | Best Use-Case |
|---|---|---|---|---|
| QSAR | Quantitative relationship between molecular descriptors and biological activity [1]. | Set of compounds with known biological activities and calculated descriptors [7]. | Predictive mathematical model for activity [1]. | Lead optimization; predicting potency of analog series. |
| Pharmacophore Modeling | Identification of essential steric/electronic features for bioactivity [1] [6]. | Multiple known active ligands (and sometimes inactives) for a target [5]. | 3D spatial query of essential features [5]. | Virtual screening for novel scaffolds (scaffold hopping) [2]. |
| Similarity Searching | Similar molecules have similar activities [4]. | One or more known active compound(s). | Ranked list of compounds similar to the query. | Early-stage hit identification from large databases. |
LBDD Experimental Protocols
This section provides detailed, executable protocols for core LBDD workflows, from data curation to model application.
Protocol: Developing a Robust QSAR Model
This protocol outlines the steps for constructing a validated QSAR model, based on a study of anticancer compounds on a melanoma cell line [7].
I. Data Curation and Preparation
- Data Collection: Curate a set of chemical structures and their corresponding biological activity values (e.g., IC₅₀, GI₅₀, Ki). The dataset should be as congeneric as possible. Example: Retrieve 70 compounds and their pGI₅₀ activities from a database like the National Cancer Institute (NCI) [7].
- Structure Optimization: Convert 2D structures into 3D models. Clean and minimize the structures using a molecular mechanics force field (e.g., MM2) to remove strain. Follow with more advanced optimization using methods like Density Functional Theory (DFT) at the B3LYP/6-311G(d) level to obtain equilibrium geometries [7].
- Descriptor Calculation: Use software toolkits like PaDEL to calculate a wide range of molecular descriptors from the optimized 3D structures [7].
II. Data Splitting and Model Building
- Training/Test Set Division: Split the dataset into a training set (typically 70-80%) for model development and a test set (20-30%) for external validation. Use algorithms like the Kennard-Stone method to ensure representative sampling of the chemical space [7].
- Descriptor Selection and Model Generation: Use a variable selection algorithm such as the Genetic Function Algorithm (GFA) to identify the most relevant, non-redundant descriptors. Build the model using a regression technique like Multiple Linear Regression (MLR) [7].
III. Model Validation and Application
- Statistical Validation: Evaluate the model using the training set with metrics including the squared correlation coefficient (R²) and the cross-validated correlation coefficient (Q²cv). Example: A robust model may have R² = 0.885 and Q²cv = 0.842 [7].
- External Validation: Assess the model's predictive power on the untouched test set using the predictive R² (R²pred). Example: A model with R²pred = 0.738 is considered predictive [7].
- Define Applicability Domain (AD): Establish the chemical space domain for which the model can make reliable predictions. Use methods like the leverage approach to identify when a new compound is outside the model's AD [7].
- Activity Prediction: Use the validated model to predict the activity of newly designed compounds before they are synthesized.
Diagram 1: QSAR model development and validation workflow.
Protocol: Pharmacophore Model Generation and Virtual Screening
This protocol describes the creation of a pharmacophore model and its use in screening compound libraries.
I. Input Ligand Preparation
- Select a Training Set: Assemble a set of known active ligands that are structurally diverse but share a common mechanism of action. Including known inactive compounds can also help refine the model.
- Conformational Sampling: For each ligand in the training set, generate a representative ensemble of low-energy conformations using molecular mechanics force fields (e.g., CHARMM, AMBER) or stochastic methods. Accurate sampling is critical for capturing the bioactive conformation [1].
II. Model Generation and Validation
- Feature Identification and Alignment: Use pharmacophore modeling software (e.g., in Schrödinger or MOE) to identify common chemical features (e.g., hydrogen bond donors/acceptors, hydrophobic regions, aromatic rings) across the active ligands. The algorithm will then superimpose the ligand conformations to find the best spatial overlap of these features.
- Model Validation: Validate the generated model by testing its ability to correctly discriminate between known active and inactive compounds not used in the training set.
III. Database Screening
- Prepare a Virtual Library: Convert a commercial (e.g., ZINC) or in-house compound database into a searchable 3D format, ensuring multiple conformers and protonation states are considered [5].
- Run Pharmacophore Query: Use the validated pharmacophore model as a 3D search query against the prepared database.
- Analyze and Prioritize Hits: Examine the top-matching compounds, considering the fit value and visual inspection of the alignment with the model. Select promising hits for subsequent in vitro testing.
Successful LBDD relies on a suite of software, data, and computational resources. The table below catalogs key solutions used in the field.
Table 2: Key Research Reagent Solutions for LBDD
| Category | Item/Solution | Function in LBDD | Examples & Notes |
|---|---|---|---|
| Software & Tools | Cheminformatics Suites | Calculate molecular descriptors, build QSAR/pharmacophore models, and perform virtual screening. | Commercial: Schrödinger Suite, MOE, OpenEye [5]. Open-Source: PaDEL descriptor calculator [7]. |
| Conformational Sampling Tools | Generate ensembles of low-energy 3D conformations for ligands, which is crucial for pharmacophore modeling and 3D-QSAR. | Molecular dynamics (MD) codes: CHARMM, AMBER, GROMACS [5] [1]. | |
| Scaffold Hopping Tools | Identify novel chemotypes that match a given pharmacophore or shape, enabling lead diversification. | Cresset's Spark [2]. | |
| Data Resources | Compound Databases | Source of commercially available compounds for virtual screening and of bioactivity data for model training. | ZINC (90+ million purchasable compounds) [5], ChEMBL, PubChem [9]. |
| Bioactivity Databases | Provide publicly available structure-activity data for building and validating LBDD models. | ChEMBL, PubChem BioAssay [9]. | |
| Computational Resources | High-Performance Computing (HPC) | Provides the necessary computing power for intensive tasks like MD simulations, conformational analysis, and large-scale virtual screening. | GPU-accelerated computing clusters can significantly speed up calculations [5]. |
Concluding Remarks
Ligand-Based Drug Design stands as an indispensable paradigm in computational medicinal chemistry, effectively bridging the knowledge gap when target structures are elusive. By leveraging the chemical information encoded in known active compounds, LBDD empowers researchers to derive predictive models and abstract functional patterns that guide the rational design of novel therapeutics. The integration of advanced molecular modeling, robust statistical and machine learning techniques, and the vast chemical data now available ensures that LBDD will remain a vital component of the drug discovery arsenal. As computational power and algorithms continue to evolve, the accuracy, scope, and impact of LBDD strategies are poised to expand further, solidifying their role in delivering the next generation of effective medicines.
The "molecular similarity principle" stands as a foundational concept in ligand-based drug design (LBDD), asserting that structurally similar molecules are more likely to exhibit similar biological activities [10]. This principle underpins a wide array of computational methods used in drug discovery when three-dimensional structural information for the biological target is unavailable [11] [12]. By exploiting the structural and physicochemical similarities between known active compounds and unknown candidates, researchers can efficiently identify and optimize novel drug leads, significantly accelerating the drug discovery pipeline [13].
This article explores the central role of molecular similarity in predicting bioactivity, detailing key methodologies such as pharmacophore modeling, Quantitative Structure-Activity Relationships (QSAR), and modern machine learning approaches. We provide detailed application notes and experimental protocols to guide researchers in implementing these powerful LBDD techniques, complete with validated workflows, necessary reagent solutions, and visualization tools to facilitate practical application in drug development settings.
Key Methodological Frameworks
Pharmacophore Modeling and Similarity Searching
A pharmacophore represents the essential three-dimensional arrangement of molecular features responsible for a ligand's biological activity, including hydrogen bond donors/acceptors, hydrophobic regions, and charged groups [13]. Pharmacophore modeling translates this abstract concept into a computable query for virtual screening.
Protocol 2.1.1: Ligand-Based Pharmacophore Generation
- Objective: To create a pharmacophore model from a set of known active ligands for virtual screening.
- Materials: A congeneric series of 20-30 compounds with known biological activities (e.g., IC₅₀ or Ki values); computational software such as Discovery Studio [5] or OpenEye ROCS [14].
- Procedure:
- Data Curation: Collect and prepare a diverse set of active ligands. Generate energetically reasonable 3D conformations for each ligand using a tool like OMEGA [14].
- Molecular Alignment: Superimpose the ligand conformations based on their common pharmacophoric features using automated algorithms (e.g., HipHop or HypoGen) [13].
- Feature Identification: Analyze the aligned ensemble to identify conserved chemical features (e.g., hydrogen bond donors, acceptors, hydrophobic centroids, aromatic rings) critical for biological activity.
- Model Validation: Assess the model's quality by its ability to discriminate between known active and inactive compounds in a test dataset. Use statistical measures like the Guner-Henry score or enrichment factor.
Application Note: Pharmacophore models are highly effective for "scaffold hopping"—identifying novel chemotypes that maintain the crucial pharmacophore pattern, thereby enabling the discovery of structurally distinct compounds with the desired bioactivity [15] [10].
Quantitative Structure-Activity Relationships (QSAR)
QSAR is a computational methodology that quantifies the relationship between the physicochemical/structural properties (descriptors) of a series of compounds and their biological activity [11] [12]. The resulting model can predict the activity of new, untested compounds.
Protocol 2.2.1: Developing a 3D-QSAR Model using CoMFA/CoMSIA
- Objective: To build a predictive 3D-QSAR model that correlates molecular fields with biological activity.
- Materials: A dataset of compounds with measured biological activity; molecular modeling software with 3D-QSAR capabilities (e.g., SYBYL for CoMFA/CoMSIA).
- Procedure:
- Molecular Alignment: Superimpose all molecules in the training set according to a common pharmacophore or a reference molecule's bioactive conformation.
- Descriptor Calculation: Place the aligned molecules within a 3D grid. Calculate steric (Lennard-Jones) and electrostatic (Coulombic) field energies at each grid point for CoMFA. For CoMSIA, calculate additional similarity indices for steric, electrostatic, hydrophobic, and hydrogen-bonding fields [11].
- Model Building: Use Partial Least Squares (PLS) regression to correlate the field descriptors with the biological activity values [12].
- Model Validation: Perform internal validation (e.g., Leave-One-Out cross-validation to obtain q²) and external validation by predicting the activity of a test set not used in model building [12].
Table 1: Key Statistical Metrics for QSAR Model Validation
| Metric | Description | Acceptance Threshold |
|---|---|---|
| q² (LOO-CV) | Cross-validated correlation coefficient | Typically > 0.5 [12] |
| r² | Non-cross-validated correlation coefficient | > 0.8 [12] |
| RMSE | Root Mean Square Error | As low as possible |
| F Value | Fisher F-test statistic | Should be significant |
Application Note: The interpretative contour maps generated by CoMFA and CoMSIA visually highlight regions where specific molecular properties (e.g., increased steric bulk or electronegativity) enhance or diminish biological activity, providing direct guidance for lead optimization [11].
Machine Learning and Deep Learning in Molecular Similarity
Advanced machine learning models have dramatically enhanced the ability to capture complex, non-linear relationships between molecular structure and bioactivity [16] [13].
Protocol 2.3.1: Building a Machine Learning Model for Bioactivity Prediction
- Objective: To train a model that predicts bioactivity from molecular fingerprints or descriptors.
- Materials: A large dataset of compounds with annotated bioactivity (e.g., from ChEMBL [16]); programming environment (e.g., Python); machine learning libraries (e.g., scikit-learn, DeepChem).
- Procedure:
- Descriptor Calculation: Encode molecules using numerical descriptors. Common choices include ECFP4 fingerprints (2D structure) [16], USRCAT (3D shape and pharmacophore) [16], or physicochemical properties.
- Model Training: Train a machine learning algorithm on the training set. Options include:
- Random Forest / Support Vector Machines (SVMs): Effective for structured data and smaller datasets [13].
- Graph Neural Networks (GNNs): Directly learn from molecular graph structures, capturing complex topological features [16].
- Chemical Language Models (CLMs): Treat molecules as text sequences (e.g., SMILES) to generate novel bioactive structures [16].
- Model Evaluation: Assess the model's predictive performance on a held-out test set using metrics like Mean Absolute Error (MAE) for regression or AUC-ROC for classification.
Application Note: Models like DRAGONFLY and TransPharmer integrate deep learning with interactome data (drug-target networks) or pharmacophore fingerprints, enabling "zero-shot" or conditioned de novo design of novel bioactive molecules with high predicted affinity and synthesizability [16] [15].
Essential Research Reagent Solutions
Successful implementation of LBDD relies on a suite of computational tools and data resources.
Table 2: Key Research Reagent Solutions for LBDD
| Tool/Resource Name | Type | Primary Function in LBDD |
|---|---|---|
| ROCS (OpenEye) [14] | Software | Rapid 3D shape and chemical feature similarity searching for virtual screening. |
| OMEGA (OpenEye) [14] | Software | Rapid generation of small molecule conformer libraries for 3D modeling. |
| ZINC Database [5] | Database | A publicly accessible repository of commercially available compounds for virtual screening (~90 million molecules). |
| ChEMBL Database [16] | Database | A manually curated database of bioactive molecules with drug-like properties, containing binding affinities and ADMET information. |
| CHARMM/AMBER [5] | Force Field | Empirical energy functions for molecular mechanics simulations and geometry optimization. |
| DRAGONFLY [16] | Deep Learning Model | Interactome-based deep learning for de novo molecular design, combining graph and language models. |
| TransPharmer [15] | Deep Learning Model | A generative model using pharmacophore fingerprints to design novel bioactive ligands. |
Integrated Workflows and Visualization
Combining ligand-based and structure-based methods in a sequential or parallel workflow can leverage their complementary strengths and mitigate individual weaknesses [17].
Diagram 1: A sequential LB-SB virtual screening workflow.
Case Study 4.1: Combined VS for HDAC8 Inhibitors [17] A successful application of a sequential workflow involved identifying histone deacetylase 8 (HDAC8) inhibitors. Researchers first screened a 4.3-million-compound library using a ligand-based pharmacophore model. The top 500 hits were subsequently filtered using ADMET criteria and then evaluated by structure-based molecular docking. This integrated approach led to the identification of compounds SD-01 and SD-02, which demonstrated potent inhibitory activity with IC₅₀ values of 9.0 and 2.7 nM, respectively.
The following diagram illustrates the logical flow of information and decision points within a standard ligand-based drug design campaign.
Diagram 2: The iterative ligand-based drug design cycle.
Key Scenarios for Employing LBDD in Drug Discovery Projects
Ligand-based drug design (LBDD) represents a foundational computational approach employed in drug discovery when three-dimensional structural information of the biological target is unavailable or limited [12]. This methodology derives critical insights from the known chemical structures and physicochemical properties of molecules that interact with the target of interest, enabling researchers to identify and optimize novel bioactive compounds through indirect inference [12] [18]. As a cornerstone of computer-aided drug design (CADD), LBDD operates on the fundamental principle that structurally similar molecules often exhibit similar biological activities—the "similarity principle" that underpins quantitative structure-activity relationship (QSAR) modeling and pharmacophore development [12] [19]. The continued relevance and utility of LBDD in modern drug discovery stems from its ability to accelerate early-stage projects where structural data may be sparse, while complementing structure-based approaches in later stages of lead optimization [17] [19].
The strategic implementation of LBDD is particularly valuable in addressing several common challenges in pharmaceutical research, including orphan targets with unknown structures, the need for rapid hit identification, and scaffold-hopping to discover novel chemotypes with improved properties [18]. This application note delineates the key scenarios where LBDD approaches provide maximal impact, supported by quantitative data comparisons, detailed experimental protocols, and visual workflow guides to facilitate implementation by research scientists and drug development professionals.
Key Application Scenarios for LBDD
Table 1: Primary Scenarios for Employing Ligand-Based Drug Design
| Scenario | Key LBDD Methods | Typical Output | Advantages Over SBDD |
|---|---|---|---|
| Targets with Unknown 3D Structure | Pharmacophore modeling, QSAR, Similarity searching [12] [18] | Predictive models of activity, Novel hit compounds [12] | Applicable without protein crystallization or homology modeling [12] [19] |
| Rapid Virtual Screening | 2D/3D molecular similarity, Shape-based screening [17] [14] | Prioritized compound libraries, Enriched hit rates [17] | Higher throughput for screening ultra-large libraries [19] |
| Scaffold Hopping & Lead Optimization | Pharmacophore mapping, QSAR with molecular descriptors [12] [18] | Novel chemotypes with maintained activity, Optimized potency [18] | Identifies structurally diverse compounds with similar bioactivity [17] |
| PPI Inhibitor Development | Conformationally sampled pharmacophores, 3D-QSAR [12] [18] | PPI inhibitors with validated activity [18] | Addresses challenging flat binding interfaces [18] |
| ADMET Property Prediction | QSAR models with physicochemical descriptors [12] | Predicted pharmacokinetic and toxicity profiles [18] | Enables early elimination of problematic compounds [18] |
Targets with Unknown or Difficult-to-Obtain 3D Structures
LBDD approaches provide the primary computational strategy when the three-dimensional structure of the target protein remains undetermined through experimental methods like X-ray crystallography or cryo-electron microscopy [12] [19]. This scenario frequently occurs in early-stage discovery programs for novel targets or for target classes that prove recalcitrant to structural characterization. In the development of 5-lipoxygenase (5-LOX) inhibitors, for instance, researchers successfully employed LBDD strategies for years before the protein's crystal structure was solved, utilizing pharmacophore modeling and QSAR to guide the optimization of novel anti-inflammatory agents [20]. Similarly, LBDD enabled the discovery of novel antimicrobials targeting Staphylococcus aureus transcription without requiring the protein structure of the NusB-NusE complex [18].
The strategic advantage of LBDD in this scenario stems from its reliance solely on ligand information, circumventing the need for resource-intensive protein structure determination [12]. When structural data is unavailable, LBDD methods can leverage known active compounds to develop predictive models that capture the essential structural features required for target binding and biological activity, providing a rational foundation for compound design and optimization [12] [18].
Rapid Virtual Screening of Ultra-Large Chemical Libraries
The exponential growth of commercially available chemical space, now encompassing billions of synthesizable compounds, presents both opportunity and challenge for virtual screening initiatives [17] [19]. LBDD techniques, particularly those utilizing simplified molecular representations like 2D fingerprints or 3D shape descriptors, enable computationally efficient screening of massive compound collections at a scale that often proves prohibitive for structure-based methods like molecular docking [17].
Similarity-based virtual screening, one of the most widely used LBDD techniques, operates on the principle that structurally similar molecules tend to exhibit similar biological activities [19]. This approach can rapidly identify potential hits from large libraries by comparing candidate molecules against known active compounds using molecular descriptors [19]. The throughput advantages of LBDD become particularly evident in industrial applications where screening billions of compounds necessitates extremely efficient computational methods [19]. Following initial ligand-based enrichment, more computationally intensive structure-based approaches can be applied to the refined subset, creating an efficient hybrid workflow [17] [19].
Scaffold Hopping and Lead Optimization
Once initial hit compounds have been identified, LBDD provides powerful tools for scaffold hopping—the identification of structurally distinct compounds exhibiting similar biological activity—and systematic lead optimization [12] [18]. Pharmacophore modeling and 3D-QSAR techniques can abstract the essential functional features responsible for biological activity from known active molecules, enabling researchers to transcend specific chemical scaffolds and identify novel chemotypes that maintain critical interactions with the target [12] [14].
In lead optimization, QSAR modeling quantitatively correlates structural descriptors with biological activity, establishing predictive mathematical relationships that guide the rational design of analogs with improved potency [12] [18]. The conformationally sampled pharmacophore (CSP) approach exemplifies advanced LBDD methodology that accounts for ligand flexibility, often yielding models with enhanced predictive capability for scaffold hopping applications [12]. These approaches enable medicinal chemists to explore structural modifications while maintaining core pharmacophoric elements, balancing potency optimization with improvements in other drug-like properties [12] [18].
Targeting Protein-Protein Interactions (PPIs)
Protein-protein interactions represent an important class of therapeutic targets but often present challenges for structure-based design due to their extensive, relatively flat interfaces with limited deep binding pockets [18]. LBDD has emerged as a particularly valuable approach for PPI inhibitor development, as demonstrated in the discovery of nusbiarylins—novel antimicrobials that disrupt the NusB-NusE interaction in Staphylococcus aureus [18].
In this application, researchers developed a ligand-based pharmacophore model based on known active compounds and their antimicrobial activity, successfully identifying novel chemotypes with predicted activity against this challenging PPI target [18]. The LBDD workflow encompassed pharmacophore generation, 3D-QSAR analysis, and machine learning-based AutoQSAR modeling, culminating in the identification of promising candidates with computed binding free energies ranging from -58 to -66 kcal/mol [18]. This case study highlights how LBDD can effectively address difficult targets where traditional structure-based approaches may struggle.
ADMET Property Prediction
Beyond primary pharmacological activity, LBDD approaches play a crucial role in predicting absorption, distribution, metabolism, excretion, and toxicity (ADMET) properties—critical determinants of compound viability and eventual clinical success [18]. QSAR models trained on curated ADMET datasets can forecast key pharmacokinetic and safety parameters based on chemical structure alone, enabling early identification and mitigation of potential developability issues [18].
The integration of ADMET prediction into LBDD workflows allows researchers to prioritize compounds with balanced efficacy and safety profiles early in the discovery process, potentially reducing late-stage attrition [18]. These predictive models utilize molecular descriptors encoding structural and physicochemical properties known to influence biological behavior, providing valuable insights beyond primary activity measurements [12] [18].
Integrated LBDD Experimental Protocol
Phase 1: Compound and Activity Data Collection
Objective: Compile a comprehensive dataset of known active and inactive compounds with associated biological activity data to serve as the foundation for LBDD model development.
Materials and Reagents:
- Chemical Databases: Commercial (e.g., ChemDiv, ZINC) or proprietary compound libraries
- Activity Data: Experimentally determined IC~50~, EC~50~, K~i~, or MIC values from standardized assays
- Software Tools: Molecular spreadsheet applications (e.g., OpenEye FILTER, Schrödinger Canvas) for descriptor calculation [14]
Procedure:
- Curate Training Set: Collect a minimum of 20-50 compounds with reliable activity data spanning at least 3-4 orders of magnitude in potency [12]. Ensure chemical diversity while maintaining a congeneric series to facilitate meaningful comparisons.
- Define Activity Thresholds: Establish criteria for classifying compounds as "active," "inactive," and "intermediate" based on biological activity measurements. For example, in antimicrobial discovery, pMIC values ≥5.0 may define actives while pMIC ≤3.0 define inactives [18].
- Calculate Molecular Descriptors: Generate comprehensive molecular descriptors including:
Phase 2: Pharmacophore Model Generation
Objective: Develop a ligand-based pharmacophore hypothesis that captures the essential structural features responsible for biological activity.
Materials and Reagents:
- Software Platform: Pharmacophore modeling suite (e.g., Schrödinger PHASE, OpenEye ROCS) [18] [14]
- Conformational Sampling: Tools for comprehensive conformer generation (e.g., OpenEye OMEGA) [14]
Procedure:
- Conformational Analysis: Generate representative low-energy conformations for each training set compound using systematic search or stochastic algorithms [12] [14].
- Pharmacophore Development:
- Identify common chemical features (hydrogen bond donors/acceptors, hydrophobic regions, aromatic rings, charged groups) across active compounds [18]
- Exclude features present in inactive compounds to refine specificity
- Develop multiple hypotheses with varying feature combinations and spatial constraints
- Hypothesis Selection: Evaluate models using statistical scoring (e.g., survival scores, select scores) and select the optimal pharmacophore based on:
Phase 3: Quantitative Structure-Activity Relationship (QSAR) Modeling
Objective: Establish quantitative mathematical relationships between molecular descriptors and biological activity to enable predictive compound design.
Materials and Reagents:
- Statistical Software: QSAR modeling platforms (e.g., OpenEye 3D-QSAR, Schrödinger QSAR) [14] or programming environments (R, Python with scikit-learn)
- Validation Tools: Cross-validation routines, external test sets, y-randomization scripts [12]
Procedure:
- Descriptor Selection: Apply feature selection algorithms (genetic algorithms, stepwise regression) to identify the most relevant molecular descriptors [12].
- Model Construction: Develop QSAR models using appropriate statistical techniques:
- Model Validation: Assess predictive power and robustness through:
Phase 4: Virtual Screening and Hit Identification
Objective: Apply validated LBDD models to screen virtual compound libraries and identify novel hit candidates for experimental testing.
Materials and Reagents:
- Screening Libraries: Commercial databases (e.g., ChemDiv, Enamine, ZINC) or proprietary corporate collections [18]
- Screening Tools: Ultra-high throughput similarity search platforms (e.g., OpenEye ROCS X, FastROCS) [14]
Procedure:
- Library Preparation: Pre-process screening libraries by:
- Pharmacophore Screening: Screen pre-processed libraries against the validated pharmacophore model to identify compounds matching the essential feature arrangement [18].
- Similarity Searching: Perform 2D and 3D similarity searches using known active compounds as queries:
- QSAR Prediction: Apply validated QSAR models to predict activity of database compounds and prioritize those with highest predicted potency.
- Consensus Scoring: Integrate results from multiple LBDD methods to identify consensus hits with strong support across different approaches [17] [19].
Phase 5: Hit Evaluation and Experimental Validation
Objective: Critically evaluate computational hits and select the most promising candidates for experimental confirmation.
Materials and Reagents:
- ADMET Prediction Tools: Software for predicting physicochemical properties, metabolic stability, and toxicity (e.g., OpenEye QUAPAC, pKa Prospector) [14]
- Structural Visualization: Molecular graphics software for manual inspection of proposed binding modes
- Compound Acquisition: Commercial sources or internal medicinal chemistry for compound synthesis
Procedure:
- Property Filtering: Apply ADMET criteria to eliminate compounds with unfavorable properties:
- Poor solubility, permeability, or metabolic stability predictions
- Structural alerts for toxicity or reactive functional groups [18]
- Unfavorable physicochemical properties beyond accepted drug-like space
- Structural Diversity Analysis: Select hits representing distinct chemotypes to ensure structural diversity in experimental testing [18].
- Commercial Availability/Synthesizability Assessment: Prioritize compounds that are commercially available or readily synthesizable [16].
- Experimental Testing: Subject prioritized hits to in vitro biological evaluation:
- Primary activity assays to confirm target engagement
- Counter-screening against related targets to assess selectivity
- Cytotoxicity assays to identify non-specific effects
- Iterative Optimization: Use experimental results to refine LBDD models and guide subsequent design cycles [12] [18].
Case Study: LBDD for Novel Antimicrobial Discovery
Table 2: LBDD Application in Staphylococcus aureus Antimicrobial Development
| LBDD Component | Implementation | Result/Output |
|---|---|---|
| Training Set | 61 nusbiarylin compounds with measured MIC values [18] | Activity range: pMIC 3.0-5.0 for model development |
| Pharmacophore Model | AADRR_1 hypothesis: 2 acceptors, 1 donor, 2 aromatic rings [18] | Survival score: 4.885; Select score: 1.608; BEDROC: 0.639 |
| 3D-QSAR Model | Based on pharmacophore alignment and PLS analysis [18] | Predictive model for novel compound activity |
| Virtual Screening | ChemDiv PPI database screened against pharmacophore [18] | 4 identified hits with predicted pMIC 3.8-4.2 |
| Validation | Docking studies and binding free energy calculations [18] | Confirmed binding to NusB target (-58 to -66 kcal/mol) |
Case Study Workflow Visualization
Research Reagent Solutions
Table 3: Essential Research Reagents for LBDD Implementation
| Reagent/Tool Category | Specific Examples | Function in LBDD Workflow |
|---|---|---|
| Compound Databases | ChemDiv, ZINC, Enamine, MCULE, PubChem | Sources of chemical structures for virtual screening and training set creation [18] |
| Pharmacophore Modeling | Schrödinger PHASE, OpenEye ROCS, MOE Pharmacophore | Development of 3D pharmacophore hypotheses from known actives [18] [14] |
| QSAR Modeling | OpenEye 3D-QSAR, Schrödinger QSAR, MATLAB, R | Construction of quantitative structure-activity relationship models [12] [14] |
| Similarity Search Tools | OpenEye FastROCS, EON, BROOD, RDKit | 2D and 3D similarity searching for scaffold hopping and lead optimization [14] |
| Descriptor Calculation | OpenEye FILTER, pKa Prospector, QUAPAC, Dragon | Computation of molecular descriptors for QSAR and compound profiling [14] |
| Conformer Generation | OpenEye OMEGA, CONFLEX, CORINA | Generation of representative 3D conformations for pharmacophore modeling and 3D-QSAR [14] |
In the absence of a solved three-dimensional structure for a potential drug target, ligand-based drug design (LBDD) provides a powerful alternative pathway for drug discovery and lead optimization [12]. This approach relies entirely on the structural information and physicochemical properties of known active ligands to develop new drug candidates [11]. The fundamental hypothesis underpinning LBDD is that similar structural or physicochemical properties yield similar biological activity [12]. By studying a set of known active compounds, researchers can derive crucial insights into the structural requirements for binding and activity, enabling the rational design of novel compounds with improved pharmacological profiles.
LBDD methods are particularly valuable when the target structure remains unknown or difficult to resolve, and they have successfully led to the development of therapeutic agents across multiple disease areas [12] [18]. The approach typically involves analyzing a congeneric series of compounds with varying levels of biological activity to establish a quantitative structure-activity relationship (QSAR), which can then guide the optimization of lead compounds [12]. As the number of known bioactive compounds in public databases continues to grow, the potential for LBDD to accelerate drug discovery increases correspondingly.
Core LBDD Methodologies and Data Types
Quantitative Structure-Activity Relationships (QSAR)
QSAR is a computational methodology that quantifies the correlation between the chemical structures of a series of compounds and their biological activity [12]. The general QSAR workflow involves multiple consecutive steps: identifying ligands with experimentally measured biological activity, calculating relevant molecular descriptors, discovering correlations between these descriptors and the biological activity, and rigorously testing the statistical stability and predictive power of the developed model [12]. The molecular descriptors used in QSAR can encompass a wide range of structural and physicochemical properties that serve as a molecular "fingerprint" correlating with biological activity [12].
Advanced 3D-QSAR methods like Comparative Molecular Field Analysis (CoMFA) and Comparative Molecular Similarity Indices Analysis (CoMSIA) extend these principles to three-dimensional molecular fields, providing visual representations of the regions around molecules where specific physicochemical properties enhance or diminish biological activity [12] [11]. For example, in the development of 5-lipoxygenase (5-LOX) inhibitors, CoMFA and CoMSIA were used to generate derivatives of 5-hydroxyindole-3-carboxylate with predicted improved affinity, based on structural and electrostatic similarities to the lead compound [11].
Pharmacophore Modeling
A pharmacophore model represents the essential structural features and their spatial arrangements necessary for a molecule to interact with its target and elicit a biological response [21]. It abstracts specific molecular functionalities into generalized features such as hydrogen bond donors, hydrogen bond acceptors, hydrophobic regions, and charged groups. Pharmacophore models can be derived either from a set of known active ligands (ligand-based) or from the 3D structure of the target binding site (structure-based) [18].
In a recent application, researchers developed a ligand-based pharmacophore model to discover novel antimicrobials against Staphylococcus aureus by targeting bacterial transcription [18]. The model, named AADRR_1, comprised two hydrogen bond acceptors (A), one hydrogen bond donor (D), and two aromatic rings (R). This hypothesis was selected based on robust statistical scores (select score: 1.608, survival score: 4.885) and demonstrated excellent ability to distinguish active from inactive compounds [18].
The Challenge of Nonadditivity in SAR
A significant challenge in classical SAR analysis is the common occurrence of nonadditivity (NA), where the simultaneous change of two functional groups results in a biological activity that dramatically differs from the expected contribution of the individual changes [22]. Systematic analysis of both pharmaceutical industry data and public bioactivity data reveals that significant nonadditivity events occur in 57.8% of inhouse assays and 30.3% of public assays [22]. Furthermore, 9.4% of all compounds in the analyzed pharmaceutical database and 5.1% from public sources displayed significant additivity shifts [22].
Nonadditivity presents substantial challenges for traditional QSAR models and machine learning approaches, as these methods often struggle to predict nonadditive data accurately [22]. Identifying and understanding nonadditive events is crucial for rational drug design, as they may indicate important SAR features, variations in binding modes, or fundamental measurement errors [22].
Table 1: Key LBDD Techniques and Their Applications
| Technique | Core Principle | Typical Application | Key Advantages |
|---|---|---|---|
| 2D/3D QSAR | Establishes mathematical relationships between molecular descriptors and biological activity | Lead optimization for congeneric series | Quantitative predictions of activity; Handles large datasets |
| Pharmacophore Modeling | Identifies essential 3D arrangement of structural features | Virtual screening; Scaffold hopping | Not limited to congeneric series; Intuitive interpretation |
| Matched Molecular Pair (MMP) Analysis | Systematic identification of small structural changes and their effects on properties | SAR transfer; Medchem optimization | Simple interpretation; Identifies consistent transformation effects |
| Shape-Based Screening | Compares molecular shape and electrostatic properties | Identifying novel chemotypes with similar binding potential | Can find structurally diverse compounds with similar binding |
Experimental Protocols and Workflows
Protocol 1: Developing a QSAR Model
Objective: To construct a statistically robust QSAR model for predicting the biological activity of novel compounds.
Materials and Software:
- A dataset of compounds with reliable biological activity measurements (IC₅₀, Ki, EC₅₀, etc.)
- Molecular modeling software (Schrödinger, MOE, OpenEye, or open-source alternatives)
- Statistical analysis environment (R, Python, or built-in software modules)
Procedure:
Data Curation and Preparation
- Collect a series of 20-50 congeneric compounds with experimentally determined biological activity values [12].
- Convert activity values to negative logarithmic scale (pIC₅₀, pKi, etc.) for linear regression analysis.
- Apply appropriate chemical standardization: neutralize charges, generate canonical tautomers, and clear unknown stereochemistry [22].
Molecular Descriptor Generation
- Optimize the 3D geometry of each compound using molecular mechanics or quantum chemical methods [12].
- Calculate relevant molecular descriptors (electronic, steric, hydrophobic, topological) using software such as Dragon, RDKit, or MOE.
- Select descriptors with sufficient variance and low intercorrelation to avoid overfitting.
Model Development and Validation
- Split the dataset into training (70-80%) and test (20-30%) sets using rational methods (e.g., Kennard-Stone).
- Use statistical methods like Partial Least Squares (PLS) or Multiple Linear Regression (MLR) to build the model [12].
- Validate the model internally using cross-validation (leave-one-out or k-fold) and calculate Q² [12].
- Validate the model externally using the test set and calculate predictive R².
- Apply domain of applicability analysis to define the model's reliable prediction scope.
Troubleshooting Tips:
- If the model shows poor predictive power (Q² < 0.5), consider expanding the chemical diversity of the dataset or exploring different descriptor sets.
- If overfitting occurs (high R², low Q²), reduce the number of descriptors or apply regularization techniques.
Protocol 2: Pharmacophore-Based Virtual Screening
Objective: To identify novel hit compounds using a pharmacophore model for database screening.
Materials and Software:
- A set of known active compounds (minimum 3-5 highly active compounds for model generation)
- Inactive compounds (if available, to improve model selectivity)
- Database of screening compounds (e.g., ZINC, ChEMBL, in-house collections)
- Pharmacophore modeling software (Schrödinger PHASE, MOE, Catalyst)
Procedure:
Pharmacophore Model Generation
- Select a diverse set of active compounds representing different chemical scaffolds but common biological activity.
- Conformational analysis: generate a representative set of low-energy conformers for each compound.
- Identify common pharmacophore features (hydrogen bond donors/acceptors, hydrophobic regions, aromatic rings, charged groups) across the active molecules.
- Generate multiple pharmacophore hypotheses and select the best model based on statistical scores (survival score, site score, vector score) [18].
Model Validation
- Test the model's ability to discriminate known active compounds from inactive ones using receiver operating characteristics (ROC) curve analysis [18].
- Calculate enrichment factors (EF) to assess the model's performance in virtual screening.
- Verify that the model aligns with known SAR data, if available.
Virtual Screening and Hit Identification
- Screen a database of compounds (commercial or in-house) using the validated pharmacophore model.
- Apply appropriate ADMET filters to remove compounds with undesirable properties.
- Visually inspect the top-ranking hits to verify sensible alignment with the pharmacophore features.
- Select 20-50 compounds for experimental testing based on pharmacophore fit, chemical diversity, and commercial availability.
Validation: The workflow should successfully identify known active compounds when applied to a test set containing both active and inactive molecules. A successful model typically achieves an enrichment factor >10 and area under the ROC curve >0.7.
Table 2: Key Research Reagent Solutions for LBDD
| Resource Type | Specific Examples | Function in LBDD | Access Information |
|---|---|---|---|
| Chemical Databases | ZINC15, ChEMBL, PubChem | Sources of known bioactive compounds and screening libraries; provide structural and bioactivity data | Publicly available (ZINC: https://zinc15.docking.org) |
| Molecular Modeling Software | Schrödinger Suite, MOE, OpenEye, RDKit | Small molecule optimization, descriptor calculation, pharmacophore modeling, QSAR analysis | Commercial and open-source options |
| Descriptor Calculation Tools | Dragon, PaDEL, RDKit | Generation of molecular descriptors for QSAR modeling | Commercial and open-source options |
| Pharmacophore Modeling | Schrödinger PHASE, MOE Pharmacophore, Catalyst | Create, validate, and use pharmacophore models for virtual screening | Commercial software |
| SAR Analysis Tools | Matched Molecular Pair analysis, R-group decomposition | Systematic analysis of structural changes and their effects on activity | Available in major modeling suites and open-source packages |
Case Study: Antimicrobial Discovery Targeting Staphylococcus aureus
In a recent application of LBDD, researchers developed novel antimicrobials against Staphylococcus aureus by targeting bacterial transcription through inhibition of the NusB-NusE protein-protein interaction [18]. The study utilized a dataset of 61 nusbiarylin compounds with known antimicrobial activity against S. aureus.
The LBDD workflow integrated multiple computational approaches:
- A ligand-based pharmacophore model (AADRR_1) was developed using the PHASE module, containing two hydrogen bond acceptors, one hydrogen bond donor, and two aromatic rings.
- A 3D-QSAR model was built to visualize how chemical modifications influence antimicrobial activity and predict activities of new compounds.
- An AutoQSAR model using machine learning methods validated the predictions from the 3D-QSAR model.
- ADME/T calculations filtered out compounds with undesirable properties.
This integrated approach identified four promising compounds (J098-0498, 1067-0401, M013-0558, and F186-026) as potential antimicrobials against S. aureus, with predicted pMIC values ranging from 3.8 to 4.2. Docking studies confirmed that these molecules bound tightly to NusB with favorable binding free energies ranging from -58 to -66 kcal/mol [18].
Table 3: Statistical Performance of LBDD Models in Antimicrobial Discovery
| Model Type | Statistical Metric | Value | Interpretation |
|---|---|---|---|
| Pharmacophore (AADRR_1) | Select Score | 1.608 | Quality of hypothesis fit |
| Survival Score | 4.885 | Overall model quality | |
| BEDROC | 0.639 | Early recognition capability | |
| 3D-QSAR | R² | 0.904 | Good explanatory power |
| Q² | 0.658 | Good predictive capability | |
| Pearson-R | 0.872 | Good correlation coefficient |
Advanced Applications: Integrating LBDD with Structure-Based Methods
While LBDD is powerful on its own, its integration with structure-based methods creates a synergistic approach that leverages the advantages of both techniques [17]. Three primary strategies have emerged for combining ligand-based and structure-based virtual screening:
Sequential Approaches: The virtual screening pipeline is divided into consecutive steps, typically starting with faster LB methods for pre-filtering followed by more computationally intensive SB methods for the final selection [17] [23]. This strategy optimizes the tradeoff between computational cost and methodological complexity.
Parallel Approaches: Both LB and SB methods are run independently, and the best candidates identified from each method are selected for biological testing [23]. The final rank order often leads to meaningful increases in both performance and robustness over single-modality approaches.
Hybrid Approaches: These integrate LB and SB information into a single, unified method that simultaneously considers both ligand similarity and complementarity to the target structure [17] [23]. This represents the most sophisticated integration, potentially overcoming limitations of individual methods.
The selection of an appropriate strategy depends on the specific project requirements, available data, and computational resources. As both LB and SB methods continue to evolve, their strategic integration will likely play an increasingly important role in accelerating drug discovery.
Ligand-Based Drug Design (LBDD) represents a cornerstone methodology in computer-aided drug discovery, applied in scenarios where the three-dimensional structure of the biological target is unknown or difficult to obtain [19] [6]. Instead of relying on direct structural information about the target protein, LBDD infers critical binding characteristics from the physicochemical properties and structural patterns of known active molecules [19] [1]. This approach stands in contrast to Structure-Based Drug Design (SBDD), which requires detailed three-dimensional structural information of the target, typically obtained through X-ray crystallography, cryo-electron microscopy, or nuclear magnetic resonance (NMR) techniques [6]. The strategic advantage of LBDD becomes particularly evident during the early stages of drug discovery when structural information is sparse, offering distinct benefits in speed, resource efficiency, and broader applicability across diverse target classes [19] [1].
For researchers engaged in hit identification and lead optimization, LBDD provides a powerful suite of computational tools that can significantly accelerate the discovery pipeline. By leveraging known structure-activity relationships (SAR), LBDD enables the prediction and design of novel compounds with improved biological attributes even in the absence of target structural data [1]. This application note delineates the quantitative advantages, detailed methodologies, and practical implementation protocols for harnessing LBDD in contemporary drug discovery campaigns.
Core Advantages of LBDD
The strategic implementation of LBDD offers three distinct categories of advantages that address critical challenges in modern drug discovery. The comparative analysis below quantifies these benefits relative to structure-based approaches.
Table 1: Comparative Analysis of LBDD versus SBDD Approaches
| Parameter | LBDD Approach | SBDD Approach |
|---|---|---|
| Structural Dependency | No target structure required [6] | Requires 3D target structure [19] |
| Computational Speed | High-throughput screening of trillion-compound libraries [24] | Docking billions of compounds computationally intensive [25] |
| Resource Requirements | Significant reduction in experimental screening time and cost [6] | Dependent on expensive structural biology techniques [6] |
| Target Applicability | Suitable for membrane proteins, GPCRs, and targets without solved structures [1] | Limited to targets with solved or predictable structures [19] |
| Data Requirements | Requires sufficient known active compounds for model building [19] | Requires high-quality structural data [19] |
| Scaffold Hopping Capability | Excellent for identifying novel chemotypes via similarity searching [24] | Limited by binding site complementarity [19] |
Operational Speed and Efficiency
LBDD techniques enable exceptionally rapid virtual screening operations, significantly accelerating early-stage hit identification. Modern LBDD platforms can efficiently navigate trillion-sized chemical spaces to identify compounds similar to known actives, a process that dramatically outperforms traditional experimental screening in terms of speed [24]. The underlying efficiency stems from the computational tractability of similarity comparisons compared to the more computationally intensive molecular docking procedures used in SBDD [19] [25]. This speed advantage translates directly to reduced project timelines, allowing research teams to rapidly prioritize synthetic efforts and experimental testing.
Resource Optimization
The resource-efficient nature of LBDD manifests through multiple dimensions of the drug discovery process. By employing computational filtering before synthesis and testing, LBDD minimizes costly experimental procedures [6]. Virtual screening based on ligand similarity or quantitative structure-activity relationship (QSAR) models can process millions of compounds in silico, focusing resource-intensive synthetic chemistry and biological testing only on the most promising candidates [19] [1]. This strategic resource allocation becomes particularly valuable in academic settings or small biotech companies where research budgets are constrained.
Broad Applicability
LBDD demonstrates exceptional versatility across biologically significant but structurally challenging target classes. Notably, more than 50% of FDA-approved drugs target membrane proteins such as G protein-coupled receptors (GPCRs), nuclear receptors, and transporters [1]. For these targets, obtaining high-resolution three-dimensional structures remains technically challenging, making LBDD the preferred methodological approach [1]. This applicability extends to novel targets without structural characterization, enabling drug discovery campaigns against emerging biological targets of therapeutic interest.
Key Methodologies and Experimental Protocols
Similarity-Based Virtual Screening
Similarity-based virtual screening operates on the fundamental principle that structurally similar molecules tend to exhibit similar biological activities [19]. This methodology employs computational comparison techniques to identify novel candidate compounds from large chemical databases based on their resemblance to known active molecules.
Protocol 1: Similarity-Based Screening Using Molecular Fingerprints
Step 1: Query Compound Selection and Preparation
- Select known active compound(s) with confirmed biological activity against the target of interest
- Generate canonical Simplified Molecular Input Line Entry Specification (SMILES) representations
- Remove salts and standardize tautomeric states using chemoinformatics toolkits
- Generate 2D molecular fingerprints (e.g., ECFP4, MACCS keys) [1]
Step 2: Database Preparation
- Obtain compound database from commercial vendors or internal collections
- Apply standard chemical standardization protocols (neutralization, desalting)
- Generate identical fingerprint representations for all database compounds
- Implement appropriate chemical space indexing for rapid similarity searching [24]
Step 3: Similarity Calculation
- Select appropriate similarity metric (Tanimoto coefficient recommended)
- Calculate similarity between query fingerprint and all database compounds
- Apply similarity threshold (typically >0.7-0.8 for scaffold hopping) [24]
- Rank compounds by descending similarity score
Step 4: Result Analysis and Hit Selection
- Visualize chemical structures of top-ranking compounds
- Apply additional filters (drug-likeness, synthetic accessibility)
- Select diverse chemotypes from high-ranking compounds for experimental testing
Figure 1: Similarity-Based Virtual Screening Workflow
Quantitative Structure-Activity Relationship (QSAR) Modeling
QSAR modeling establishes mathematical relationships between chemical structure descriptors and biological activity, enabling predictive assessment of novel compounds [1]. This approach facilitates lead optimization by quantifying the structural features that contribute to potency and selectivity.
Protocol 2: 2D-QSAR Model Development and Application
Step 1: Dataset Curation
- Compile structurally diverse compounds with consistent biological activity data
- Ensure adequate sample size (>30 compounds recommended)
- Divide dataset into training (70-80%) and test sets (20-30%) using rational division methods
Step 2: Molecular Descriptor Calculation
- Compute comprehensive set of 2D molecular descriptors (topological, electronic, hydrophobic)
- Apply descriptor pre-processing (normalization, variance filtering)
- Remove highly correlated descriptors (|r| > 0.95) to reduce multicollinearity [1]
Step 3: Model Building
- Select appropriate machine learning algorithm (Random Forest, PLS, SVM)
- Implement feature selection (genetic algorithm, stepwise selection)
- Train model using training set compounds
- Validate model using internal cross-validation (leave-one-out, k-fold)
Step 4: Model Validation
- Apply model to external test set for predictivity assessment
- Calculate validation metrics (R², Q², RMSE, MAE) [26]
- Perform y-randomization to confirm model robustness
Step 5: Model Application
- Screen virtual compound libraries using validated QSAR model
- Prioritize compounds with predicted high activity
- Select candidates spanning diverse structural classes for synthesis and testing
Pharmacophore Modeling
Pharmacophore modeling identifies the essential steric and electronic features responsible for molecular recognition and biological activity [6]. This methodology provides a three-dimensional framework for designing novel compounds that maintain critical interactions with the biological target.
Protocol 3: Common Feature Pharmacophore Generation
Step 1: Conformational Analysis
- Select training set of 3-10 structurally diverse active compounds
- Generate representative conformational ensembles for each compound
- Apply energy window (typically 10-20 kcal/mol) and RMSD criteria (0.5-1.0 Å) [1]
Step 2: Pharmacophore Hypothesis Generation
- Align conformations using flexible superposition algorithms
- Identify common chemical features (H-bond donors/acceptors, hydrophobic regions, aromatic rings, charged groups)
- Define spatial tolerances for each feature element
- Generate multiple pharmacophore hypotheses
Step 3: Hypothesis Validation
- Test ability to discriminate known actives from inactive compounds
- Select optimal hypothesis based on enrichment metrics
- Verify hypothesis robustness using external test set
Step 4: Virtual Screening
- Screen compound databases against validated pharmacophore model
- Apply geometric constraints and feature matching criteria
- Rank hits by fit value and visual inspection
- Select compounds for experimental validation
The Scientist's Toolkit: Essential Research Reagents and Solutions
Successful implementation of LBDD methodologies requires both computational tools and chemical resources. The following table summarizes key solutions for establishing robust LBDD capabilities.
Table 2: Essential Research Reagents and Computational Solutions for LBDD
| Tool Category | Representative Solutions | Key Functionality | Application Context |
|---|---|---|---|
| Chemical Databases | ZINC, ChEMBL, REAL Database [25] | Source of compounds for virtual screening | Provides screening libraries containing billions of commercially available compounds |
| Descriptor Calculation | RDKit, PaDEL, Dragon | Generation of molecular descriptors | Computes structural features for QSAR and similarity searching |
| Similarity Searching | InfiniSee [24], Scaffold Hopper [24] | Chemical space navigation | Identifies structurally similar compounds and novel chemotypes |
| QSAR Modeling | scikit-learn [26], Orange, WEKA | Machine learning model development | Builds predictive models linking structure to activity |
| Pharmacophore Modeling | Phase, MOE, LigandScout | 3D pharmacophore creation and screening | Identifies essential structural features for bioactivity |
| Conformational Analysis | OMEGA, CONFLEX, CORINA | Generation of 3D conformers | Samples accessible conformational space for flexible alignment |
Integrated Workflow for Practical Implementation
The strategic integration of multiple LBDD techniques creates a synergistic effect that enhances hit identification efficiency. The following workflow represents a validated approach for practical LBDD implementation in drug discovery projects.
Figure 2: Integrated LBDD Workflow for Hit Identification
This integrated methodology begins with known active compounds and applies parallel LBDD techniques to maximize the probability of identifying novel hits. Similarity-based screening rapidly identifies structurally analogous compounds, while QSAR modeling enables activity prediction across broader chemical space. Pharmacophore modeling captures essential three-dimensional features necessary for bioactivity. The computational triaging stage applies consensus scoring to prioritize compounds identified by multiple methods, followed by experimental validation of top candidates. This approach efficiently leverages limited structural information to generate valuable lead compounds for further optimization.
Ligand-Based Drug Design represents a powerful, efficient, and broadly applicable strategy for modern drug discovery. Its advantages in speed, resource efficiency, and applicability to challenging target classes make it an indispensable component of the computational drug discovery toolkit. The methodologies and protocols detailed in this application note provide researchers with practical frameworks for implementing LBDD in their discovery pipelines. As chemical and biological databases continue to expand and machine learning algorithms become increasingly sophisticated, the impact and utility of LBDD approaches are poised for continued growth, offering robust solutions for the ongoing challenges of drug development.
Core LBDD Methodologies and Their Real-World Applications
Quantitative Structure-Activity Relationship (QSAR) modeling represents a cornerstone of modern computational drug discovery, establishing mathematical relationships between the structural properties of chemical compounds and their biological activities [27] [28]. The fundamental principle underlying QSAR formalism is that differences in structural properties are responsible for variations in biological activities of compounds [28]. These methodologies have evolved significantly from classical approaches based on simple physicochemical parameters to advanced techniques incorporating the three-dimensional properties of molecules and their conformational flexibility [27] [29].
Within the context of ligand-based drug design (LBDD), QSAR approaches are particularly valuable when the three-dimensional structure of the biological target is unknown [27]. By exploiting the structural information of active ligands, researchers can develop predictive models that guide the optimization of lead compounds and prioritize candidates for synthesis and biological testing [30] [31]. This review comprehensively examines the theoretical foundations, practical applications, and experimental protocols for implementing QSAR strategies across different dimensional representations, with a particular emphasis on the transition from 2D descriptors to 3D field-based approaches.
Theoretical Foundations: The Dimensional Evolution of QSAR
The Dimensional Spectrum of Molecular Descriptors
Molecular descriptors are numerical representations that encode various chemical, structural, or physicochemical properties of compounds, forming the basis for QSAR modeling [29]. These descriptors are systematically classified according to the level of structural representation they encompass:
- 1D Descriptors: These include global molecular properties such as molecular weight, atom counts, and functional group presence [27] [29].
- 2D Descriptors: These topological descriptors capture information derived from the molecular connection table, including topological indices, molecular connectivity, and electronic parameters such as logP [27] [30] [29].
- 3D Descriptors: These encode geometric and shape-related properties derived from the three-dimensional structure of molecules, including molecular surface area, volume, and electrostatic potential maps [27] [29] [28].
- 4D Descriptors: An extension of 3D-QSAR, these descriptors account for conformational flexibility by considering ensembles of molecular structures from molecular dynamics simulations rather than a single static conformation [27].
Comparative Analysis of QSAR Dimensions
Table 1: Comparative analysis of QSAR methodologies across different dimensions
| Dimension | Descriptor Examples | Typical Applications | Key Advantages | Principal Limitations |
|---|---|---|---|---|
| 2D-QSAR | Molecular weight, logP, TPSA, rotatable bonds, hydrogen bond donors/acceptors [32] [30] | ADMET prediction, preliminary screening, high-throughput profiling [32] | Rapid calculation, alignment-independent, suitable for large datasets [32] | Limited representation of 3D structure and stereochemistry [27] |
| 3D-QSAR | Steric/electrostatic field values, molecular interaction fields [31] [28] | Lead optimization, pharmacophore mapping, activity prediction for congeneric series [31] [28] | Captures spatial molecular features, provides visual guidance for optimization [28] | Requires molecular alignment, sensitive to conformation selection [27] [28] |
| 4D-QSAR | Grid cell occupancy descriptors (GCODs) of interaction pharmacophore elements [27] | Complex ligand-receptor interactions, flexible molecular systems [27] | Accounts for conformational flexibility, multiple alignments, and induced fit [27] | Computationally intensive, complex model interpretation [27] |
Application Note 1: 2D-QSAR for Angiogenin Inhibitors in Cancer Therapeutics
Background and Objective
Angiogenin is a monomeric protein recognized as an important factor in angiogenesis, making it an ideal drug target for treating cancer and vascular dysfunctions [30]. This application note details the development of a 2D-QSAR model for small molecule angiogenin inhibitors, employing a ligand-based approach for cancer drug design when structural information of the target protein was limited [30].
Experimental Protocol
Dataset Curation and Preparation
- Compound Collection: 30 inhibitor compounds of angiogenin and their biological activities (Kᵢ) were collected from published literature [30].
- Activity Data Preparation: Kᵢ values (μM) were converted to molar units and transformed to negative logarithmic scale (pKᵢ = -log Kᵢ) to ensure a linear relationship with free energy changes [30].
- Training-Test Set Division: The dataset was divided into a training set (75%, 23 compounds) for model development and a test set (25%, 7 compounds) for validation. Division was performed by sorting compounds by biological activity to ensure both sets spanned the entire activity range [30].
- Structure Optimization: Compound structures were sketched using Maestro (Schrödinger), converted to 3D structures using LigPrep, and subjected to geometry optimization and energy minimization using MacroModel with OPLS-2005 all-atom force field [30].
Descriptor Generation and Selection
- Descriptor Calculation: 50 different 2D structural descriptors were generated using QikProp (Schrödinger) [30].
- Descriptor Filtering: 18 descriptors with constant values across the dataset were removed. The remaining 32 descriptors were selected for QSAR modeling [30].
- Multicollinearity Assessment: Descriptors were evaluated for intercorrelation to minimize redundancy in the model [30].
Model Development and Validation
- Multiple Linear Regression (MLR): Initially applied but resulted in a mono-parametric equation due to descriptor multicollinearity [30].
- Partial Least Squares (PLS) Regression: Implemented using MINITAB software to handle correlated descriptors. The optimum number of latent variables was determined using leave-one-out cross-validation based on the lowest Predicted Residual Error Sum of Squares (PRESS) [30].
- Model Refinement: Descriptors with negligible regression coefficients were sequentially removed until reliable statistical measures were obtained [30].
- Validation Metrics: Model quality was assessed using squared correlation coefficient (R²), adjusted R², standard deviation, PRESS, F-value, and significance level (p-value). Internal validation was performed using leave-one-out cross-validation (q²) [30].
Key Findings and Research Implications
The optimized PLS-based 2D-QSAR model demonstrated that ring atoms and hydrogen bond donors positively contributed to angiogenin inhibitory activity [30]. These structural insights provide medicinal chemists with valuable guidance for designing novel angiogenin inhibitors with potential anticancer properties, highlighting how 2D-QSAR serves as an efficient preliminary screening tool in ligand-based drug design pipelines.
Application Note 2: 3D-QSAR and Pharmacophore Modeling for Pyrazoline Derivatives as Antiamoebic Agents
Background and Objective
With increasing resistance to metronidazole, the standard treatment for amoebiasis caused by Entamoeba histolytica, there is an urgent need for novel therapeutic agents [31]. This application note outlines the implementation of 3D-QSAR and pharmacophore modeling for a series of 60 pyrazoline derivatives with documented activity against the HM1:IMSS strain of E. histolytica [31].
Experimental Protocol
Dataset Preparation and Molecular Modeling
- Compound Selection: 60 pyrazoline derivatives with known antiamoebic activity (IC₅₀) were retrieved from PubChem database [31].
- Activity Expression: Biological activities were converted to pIC₅₀ (-log₁₀IC₅₀) values for QSAR analysis [31].
- Training-Test Set Division: The dataset was divided into a training set (80%, 48 compounds) for model development and a test set (20%, 12 compounds) for validation [31].
- Ligand Preparation: All molecular structures were built in Maestro and prepared using LigPrep (Schrödinger), which generates 3D structures, determines ionization states at pH 7.0±2.0, adds hydrogens, and produces energy-minimized conformers using OPLS-2005 force field [31].
Pharmacophore Model Generation
- Activity Threshold Definition: Compounds with pIC₅₀ > 6 were classified as active, while those with pIC₅₀ < 5.5 were considered inactive [31].
- Feature Identification: Pharmacophore features were defined including hydrogen bond acceptors (A), donors (D), hydrophobic groups (H), and aromatic rings (R) [31].
- Hypothesis Generation: Common pharmacophore hypotheses were generated using the PHASE module (Schrödinger) with a maximum of six features [31].
- Model Selection: The top-ranked pharmacophore model was selected based on PhaseHypoScore, which evaluates alignment, vector, and activity scores [31].
Field-Based 3D-QSAR Model Development
- Molecular Alignment: Training set compounds were aligned based on the selected pharmacophore hypothesis [31].
- Field Calculation: Steric, electrostatic, hydrophobic, hydrogen bond donor, and acceptor fields were computed using Gaussian field types [31].
- PLS Regression: The 3D-QSAR model was developed using Partial Least Squares regression with six components to correlate field values with biological activities [31].
- Model Validation: The model was validated both internally using cross-validation with the training set and externally using the test set compounds [31].
Key Findings and Research Implications
The study identified a five-point pharmacophore model (DHHHR_4) comprising three hydrophobic features, one aromatic ring, and one hydrogen bond donor [31]. The field-based 3D-QSAR model demonstrated excellent predictive power with r² = 0.837 and q² = 0.766 [31]. Contour maps derived from the 3D-QSAR model revealed specific structural requirements for antiamoebic activity, providing a rational basis for designing more potent pyrazoline derivatives. This integrated approach exemplifies how 3D-QSAR and pharmacophore modeling can synergistically guide lead optimization in ligand-based drug design.
Table 2: Essential computational tools and resources for QSAR studies
| Tool/Resource | Type | Primary Function | Application in QSAR |
|---|---|---|---|
| RDKit [32] [29] | Open-source cheminformatics library | Calculation of 2D descriptors and fingerprints | Generation of molecular descriptors for QSAR modeling [32] |
| Schrödinger Suite [30] [31] | Commercial molecular modeling platform | Comprehensive drug discovery suite | Ligand preparation, descriptor calculation, pharmacophore modeling, 3D-QSAR [30] [31] |
| Flare [32] | Commercial software platform | Ligand-based and structure-based design | Building QSAR models using RDKit descriptors and fingerprints [32] |
| VIDEAN [33] [34] | Visual analytics tool | Interactive descriptor selection and analysis | Visual descriptor analysis to incorporate domain knowledge in feature selection [33] |
| QikProp [30] | ADMET prediction module | Prediction of physicochemical and ADMET properties | Descriptor generation for QSAR models [30] |
| PHASE [31] [35] | Pharmacophore modeling module | Development of pharmacophore hypotheses and 3D-QSAR | Pharmacophore generation and atom-based 3D-QSAR studies [31] [35] |
Integrated Workflow: From 2D Descriptors to 3D Fields
The transition from 2D to 3D QSAR approaches represents a progressive incorporation of structural complexity into the modeling process. The following workflow diagram illustrates the logical relationship and sequential implementation of different QSAR methodologies within a comprehensive ligand-based drug design pipeline:
Advanced Applications and Future Perspectives in QSAR Modeling
Integration with Artificial Intelligence and Machine Learning
The field of QSAR modeling is undergoing a significant transformation through integration with artificial intelligence (AI) and machine learning (ML) approaches [29]. Algorithms including Support Vector Machines (SVM), Random Forests (RF), and k-Nearest Neighbors (kNN) can capture complex nonlinear relationships between molecular descriptors and biological activity [29]. More recently, deep learning techniques such as Graph Neural Networks (GNNs) and SMILES-based transformers enable the generation of learned molecular representations without manual descriptor engineering [29]. These advancements facilitate virtual screening of extensive chemical databases and de novo design of compounds with optimized properties.
Addressing Model Interpretability and Validation
Despite these technological advances, challenges remain regarding model interpretability and validation [33] [29]. Feature importance ranking methods like SHAP (SHapley Additive exPlanations) and LIME (Local Interpretable Model-agnostic Explanations) are increasingly employed to identify descriptors with the greatest influence on predictions [29]. Visual analytics tools such as VIDEAN (Visual and Interactive DEscriptor ANalysis) enable researchers to interactively explore descriptor relationships and incorporate domain knowledge into feature selection processes [33] [34]. Rigorous validation using both internal (cross-validation) and external (test set) methods remains essential for developing reliable QSAR models with true predictive power [30] [28].
QSAR modeling has evolved substantially from its origins in classical 2D approaches to sophisticated 3D and 4D methodologies that capture increasingly complex structural and dynamic properties of molecules [27] [29] [28]. This progression has significantly enhanced the role of QSAR in ligand-based drug design, enabling more accurate activity prediction and providing deeper insights into structure-activity relationships. The integration of AI and ML approaches, coupled with advanced visualization tools for descriptor selection, continues to expand the capabilities and applications of QSAR in modern drug discovery [33] [29]. As these computational methodologies become more sophisticated and accessible, they will play an increasingly vital role in accelerating the identification and optimization of novel therapeutic agents for diverse disease targets.
Within the framework of ligand-based drug design (LBDD), where the three-dimensional structure of the biological target is often unavailable, pharmacophore modeling serves as a foundational computational technique. A pharmacophore is defined by IUPAC as "the ensemble of steric and electronic features that is necessary to ensure the optimal supramolecular interactions with a specific biological target structure and to trigger (or to block) its biological response" [36]. In essence, it is an abstract representation of the essential molecular interactions a compound must possess to exhibit a desired biological activity. By capturing the key functional components—such as hydrogen bond donors/acceptors, hydrophobic regions, and ionic groups—and their precise three-dimensional arrangement, a pharmacophore model provides a powerful template for identifying novel active compounds through virtual screening and for optimizing lead compounds in rational drug design [37] [12]. This Application Note details the core concepts, methodologies, and practical protocols for implementing pharmacophore modeling in LBDD campaigns.
Core Concepts & Data Presentation
Essential Pharmacophore Features
A pharmacophore model is composed of a set of chemical features. The table below defines the most common feature types and their roles in molecular recognition.
Table 1: Definition of Common Pharmacophore Features and Their Roles.
| Feature Type | Description | Role in Molecular Recognition |
|---|---|---|
| Hydrogen Bond Acceptor (HBA) | An atom (typically O, N) that can accept a hydrogen bond. | Forms specific, directional interactions with hydrogen bond donors in the protein target. |
| Hydrogen Bond Donor (HBD) | A hydrogen atom attached to an electronegative atom (O, N), capable of donating a hydrogen bond. | Forms specific, directional interactions with hydrogen bond acceptors in the protein target. |
| Hydrophobic (HY) | A non-polar atom or region, often part of an aliphatic or aromatic chain. | Drives binding through desolvation and favorable van der Waals interactions with hydrophobic protein pockets. |
| Aromatic (AR) | The center of an aromatic ring system. | Facilitates π-π or cation-π stacking interactions with aromatic side chains of the target. |
| Positive Ionizable (PI) | A functional group that can carry a positive charge (e.g., protonated amine). | Can form strong electrostatic interactions or salt bridges with negatively charged protein groups. |
| Negative Ionizable (NI) | A functional group that can carry a negative charge (e.g., deprotonated carboxylic acid). | Can form strong electrostatic interactions or salt bridges with positively charged protein groups. |
Quantitative Analysis of a Sample Pharmacophore Model
A study on PDE4 inhibitors successfully developed a highly predictive pharmacophore model, Hypo1, demonstrating the quantitative assessment of model quality [38]. The following table summarizes its statistical parameters and feature composition.
Table 2: Statistical Analysis and Feature Composition of the PDE4 Inhibitor Pharmacophore Model (Hypo1) [38].
| Parameter | Value | Interpretation |
|---|---|---|
| Total Cost | 106.849 | Lower cost indicates a better model fit. |
| Null Cost | 204.947 | The cost of a model with no features. |
| Cost Difference | 98.098 | A difference >60 suggests >90% statistical significance. |
| RMSD | 0.53586 | Measures the deviation between estimated and experimental activity; lower is better. |
| Correlation (r) | 0.963930 | Indicates a very strong predictive ability. |
| Features | 2 HBA, 1 HY, 1 RA | The essential chemical features required for PDE4 inhibition. |
Experimental Protocols
This section provides detailed, step-by-step protocols for the two primary approaches to pharmacophore modeling: ligand-based and structure-based.
Protocol 1: Ligand-Based Ensemble Pharmacophore Generation
This protocol describes the generation of a consensus pharmacophore from a set of pre-aligned active ligands, as exemplified in the TeachOpenCADD tutorial for EGFR inhibitors [36].
Workflow Overview:
Materials & Reagents:
- Software: RDKit, scikit-learn.
- Input Data: A set of ligand structures (e.g., in SDF or PDB format) known to be active against the target, which have been structurally aligned in a previous step.
Procedure:
- Feature Extraction: For each aligned ligand in the set, identify and record the 3D coordinates of all relevant pharmacophore features (hydrogen bond donors, acceptors, hydrophobic centers, aromatic rings) [36].
- Coordinate Collection: Pool the coordinates of all features, grouping them by their type (e.g., all hydrogen bond acceptor coordinates together) [36].
- Feature Clustering: For each feature type, apply a clustering algorithm (e.g., k-means clustering) to the pooled coordinates to identify spatial regions where that feature repeatedly occurs [36].
- Key Parameter: The number of clusters (k) can be determined statically or by analyzing the average distance between cluster centers.
- Cluster Selection: From the resulting clusters for each feature type, select the most representative or geometrically central clusters to be included in the final model. This step reduces redundancy and creates a manageable pharmacophore query [36].
- Model Generation: Define the final ensemble pharmacophore using the central coordinates of the selected clusters. The model is now ready for virtual screening [36].
Protocol 2: Structure-Based Pharmacophore Generation from MD Simulations
This protocol leverages molecular dynamics (MD) simulations to capture protein flexibility, leading to more robust pharmacophore models, as demonstrated by the HGPM approach [39].
Workflow Overview:
Materials & Reagents:
- Software: MD simulation software (e.g., AMBER, GROMACS), pharmacophore generation software (e.g., LigandScout).
- Input Data: A high-resolution 3D structure of a protein-ligand complex or the apo protein.
Procedure:
- System Preparation: Prepare the protein-ligand complex for simulation, which includes adding hydrogen atoms, assigning force field parameters, solvating the system in a water box, and adding ions to neutralize the charge [39].
- MD Simulation: Perform a multi-nanosecond MD simulation of the prepared system. Using multiple replicates with different initial velocities is recommended to improve conformational sampling [39].
- Trajectory Sampling: Extract snapshots from the MD trajectory at regular time intervals (e.g., every 100 ps). These snapshots represent diverse conformational states of the protein-ligand complex [39].
- Pharmacophore Generation: For each saved snapshot, use structure-based pharmacophore software to automatically generate a pharmacophore model based on the interactions observed in that specific frame [39].
- Model Integration & Selection: Use a method like the Hierarchical Graph Representation of Pharmacophore Models (HGPM) to analyze the entire set of generated models. This graph visualizes the relationships and frequency of different pharmacophore features across the simulation, allowing researchers to strategically select a representative set of models for virtual screening, rather than relying on a single, potentially biased, static structure [39].
The Scientist's Toolkit
Table 3: Essential Research Reagent Solutions for Pharmacophore Modeling.
| Tool/Resource | Type | Primary Function |
|---|---|---|
| RDKit | Open-source Cheminformatics Library | Scriptable platform for handling molecules, generating conformers, and basic pharmacophore feature perception [36]. |
| LigandScout | Commercial Software | Advanced, automated generation of structure- and ligand-based pharmacophores, and performing virtual screening [39]. |
| Pharmit | Online Platform | Publicly accessible server for performing ultra-fast pharmacophore-based virtual screening of compound databases [40]. |
| OpenEye Omega | Commercial Software | High-performance generation of multi-conformer 3D ligand libraries, which is a critical pre-processing step for screening and modeling [41]. |
| DUD-E Dataset | Benchmarking Database | A library of active compounds and decoys used to validate the performance of virtual screening methods, including pharmacophore models [40]. |
| ChEMBL Database | Public Bioactivity Database | A rich source of experimentally determined bioactivity data for a vast range of targets, useful for building training sets for ligand-based models [39]. |
Ligand-based virtual screening (LBVS) has emerged as a powerful computational methodology for hit identification in drug discovery, particularly when three-dimensional structural information of the target is unavailable. By leveraging the known bioactive compounds, LBVS enables efficient navigation of ultra-large chemical spaces containing billions of molecules. This application note outlines the fundamental principles, key methodologies, and practical protocols for implementing LBVS, highlighting its transformative potential through case studies and emerging trends in artificial intelligence. The integration of these approaches provides researchers with robust tools for accelerating early-stage drug discovery campaigns.
Ligand-based virtual screening represents a cornerstone of computer-aided drug design (CADD), employed when the 3D structure of the biological target is unknown or uncertain [5] [8]. This approach operates on the fundamental principle that molecules with structural or physicochemical similarity to known active compounds are themselves likely to exhibit biological activity [12]. Unlike structure-based methods that require detailed target protein information, LBVS utilizes the collective information from known active ligands to establish structure-activity relationships (SAR) and pharmacophore models that can be exploited to identify new chemical entities with desired pharmacological properties [5] [12].
The utility of LBVS has grown substantially with the expansion of available chemical space and the development of sophisticated screening algorithms. Current chemical databases now encompass tens of billions of synthesizable compounds, creating both unprecedented opportunities and significant challenges for comprehensive exploration [42] [43]. Traditional high-throughput screening (HTS) approaches remain resource-intensive and costly, positioning LBVS as a complementary strategy for prioritizing compounds with higher predicted success rates [44]. The evolution of LBVS methodologies from simple similarity searching to complex machine learning models has dramatically improved its predictive accuracy and scaffold-hopping capability—the ability to identify structurally distinct compounds with similar biological activity [42] [44].
Key Methodologies and Quantitative Performance
Fundamental Approaches
LBVS methodologies primarily fall into three categories: similarity searching, pharmacophore modeling, and quantitative structure-activity relationship (QSAR) analysis [12] [8]. Similarity searching utilizes molecular fingerprints or descriptors to compute structural or property-based similarity between query molecules and database compounds [45] [46]. Pharmacophore modeling identifies essential steric and electronic features necessary for molecular recognition and biological activity [12]. QSAR analysis establishes mathematical relationships between molecular descriptors and biological activity through statistical or machine learning methods [12].
Performance Comparison of LBVS Methods
The performance of various LBVS tools was comprehensively evaluated against the Directory of Useful Decoys (DUD) dataset, comprising over 100,000 compounds across 40 protein targets [45]. Surprisingly, 2D fingerprint-based methods generally demonstrated superior virtual screening performance compared to 3D shape-based approaches for many targets [45]. This finding challenges conventional wisdom that 3D molecular shape is the primary determinant of biological activity and suggests areas for improvement in 3D method development.
Table 1: Performance Comparison of LBVS Methodologies
| Method Category | Representative Techniques | Key Advantages | Performance Notes |
|---|---|---|---|
| 2D Fingerprint-Based | ECFP4, MQN, SMIfp | Computational efficiency, robustness, interpretability | Generally better VS performance against DUD dataset [45] |
| 3D Shape-Based | Shape matching, pharmacophores | Captures stereochemistry, molecular volume | Lower performance than 2D methods for many targets [45] |
| Machine Learning | GCN, SchNet, SphereNet | Pattern recognition, non-linear relationships | Enhanced by descriptor integration [44] |
| Descriptor-Based | BCL descriptors, MQN | Interpretability, computational efficiency | Robust performance in scaffold-split scenarios [44] |
Emerging Trends: Integration of Descriptors with Graph Neural Networks
Recent advancements have explored the fusion of traditional chemical descriptors with graph neural networks (GNNs) to enhance LBVS performance [44]. This integrative strategy varies in effectiveness across different GNN architectures, with significant improvements observed in GCN and SchNet models, while SphereNet showed more marginal gains [44]. Notably, when augmented with descriptors, simpler GNN architectures can achieve performance levels comparable to more complex models, highlighting the value of incorporating expert knowledge into deep learning frameworks [44].
In scaffold-split scenarios, which better mimic real-world drug discovery challenges, expert-crafted descriptors frequently outperform many GNN-based approaches and sometimes even their integrated counterparts [44]. This suggests that deep learning methods may be more susceptible to overfitting when data distribution shifts between training and testing sets, prompting reconsideration of purely data-driven approaches for practical drug discovery campaigns [44].
Experimental Protocols
Protocol 1: Molecular Quantum Number (MQN) Similarity Screening
Principle: MQNs comprise 42 integer-value descriptors that count elementary molecular features including atom types, bond types, polar groups, and topological characteristics [43]. This method enables rapid similarity assessment and chemical space navigation.
Procedure:
- Query Selection: Identify known active compound(s) and convert to SMILES format.
- Descriptor Calculation: Compute MQN descriptors for query molecule(s) using available toolkits (e.g., BCL, RDKit).
- Database Screening: Calculate MQN descriptors for each database compound and compute Manhattan distances between query and database molecules.
- Ranking and Prioritization: Sort database compounds by ascending Manhattan distance to query.
- Visualization and Analysis: Visualize results in chemical space using tools like webDrugCS [46].
- Compound Selection: Select top-ranking compounds for experimental testing.
Validation: Perform retrospective validation using known actives and decoys to establish enrichment metrics.
Protocol 2: Pharmacophore-Based Virtual Screening
Principle: Pharmacophore models represent essential steric and electronic features required for molecular recognition, enabling identification of structurally diverse compounds with conserved interaction capabilities [12].
Procedure:
- Training Set Compilation: Gather structurally diverse known active compounds with measured biological activity.
- Conformational Sampling: Generate representative conformational ensembles for each training compound.
- Model Generation: Identify common pharmacophoric features using algorithms like HipHop or Catalyst.
- Model Validation: Validate model using external test set with known actives and inactives.
- Database Screening: Screen compound database using validated pharmacophore model as 3D search query.
- Hit Selection and Optimization: Select compounds matching pharmacophore hypothesis and prioritize based on fit value and chemical properties.
Validation: Assess model quality through receiver operating characteristic (ROC) curves and enrichment factors.
Protocol 3: Ultra-High-Throughput Screening with AI Embeddings
Principle: This protocol leverages transformer-based molecular representations for billion-scale compound screening, as demonstrated in the BIOPTIC B1 system for LRRK2 inhibitor discovery [42].
Procedure:
- Model Preparation: Utilize pre-trained molecular transformer (e.g., RoBERTa-style) fine-tuned on bioactivity data (e.g., BindingDB).
- Embedding Generation: Encode each molecule in the database as a compact vector representation (e.g., 60 dimensions).
- Query Definition: Encode known active compounds as query embeddings.
- Similarity Search: Perform high-throughput cosine similarity search between query and database embeddings using optimized computational frameworks.
- Novelty Filtering: Apply Tanimoto coefficient threshold (e.g., ≤0.4 ECFP4 Tanimoto vs. any known active) to ensure scaffold novelty.
- Synthesis and Testing: Prioritize compounds meeting criteria for rapid synthesis and experimental validation.
Validation: In the LRRK2 case study, this approach identified 14 confirmed binders from 87 compounds tested, with the best Kd reaching 110 nM [42].
Workflow Visualization
LBVS Workflow Diagram
Case Study: LRRK2 Inhibitor Discovery for Parkinson's Disease
A recent landmark study demonstrated the power of ultra-high-throughput LBVS for discovering novel LRRK2 inhibitors, a therapeutic target for Parkinson's disease [42]. The campaign utilized the BIOPTIC B1 system, a SMILES-based transformer pre-trained on 160 million molecules and fine-tuned on BindingDB data to learn potency-aware molecular embeddings [42].
Implementation:
- Scale: Screened 40 billion compounds from Enamine REAL Space
- Throughput: CPU-only retrieval required 2 minutes 15 seconds per query
- Cost: Estimated screening cost of approximately $5 per query [42]
Results:
- Hit Identification: 87 compounds tested → 4 with Kd ≤ 10 µM
- Analog Expansion: 47 compounds synthesized → 10 additional actives (21% hit rate)
- Potency: Three sub-µM binders identified; best Kd = 110 nM
- Novelty: ≤ 0.4 ECFP4 Tanimoto similarity to any BindingDB active, demonstrating significant scaffold hopping [42]
This case study highlights how modern LBVS can rapidly navigate vast chemical spaces to identify novel bioactive compounds with high efficiency and minimal cost.
Table 2: Key Resources for Ligand-Based Virtual Screening
| Resource Category | Specific Tools/Databases | Key Functionality | Application Context |
|---|---|---|---|
| Chemical Databases | ZINC (21M compounds), Enamine REAL (40B+ compounds), DrugBank (6K+ drugs) | Source of screening compounds, approved drug information | Hit identification, drug repurposing [42] [43] |
| Bioactivity Data | BindingDB (360K+ compounds), ChEMBL (1.1M+ compounds) | Curated bioactivity data for model training | QSAR, machine learning [42] [43] |
| Molecular Descriptors | Molecular Quantum Numbers (MQN, 42D), BCL descriptors | Molecular representation for similarity assessment | Chemical space navigation, similarity searching [43] [44] [46] |
| Fingerprint Methods | ECFP4, SMIfp, APfp, Sfp | Structural representation for similarity computation | Similarity searching, machine learning features [45] [46] |
| Software Platforms | OpenEye, Schrödinger, MOE, RDKit | Comprehensive cheminformatics toolkits | Protocol implementation, method integration [5] |
| Visualization Tools | webDrugCS, Chemical Space Mapplets | 3D chemical space visualization | Result interpretation, chemical space analysis [46] |
Ligand-based virtual screening has evolved from simple similarity searching to sophisticated AI-driven approaches capable of efficiently exploring chemical spaces containing tens of billions of compounds. The integration of traditional chemical knowledge with modern machine learning represents a promising direction for further enhancing LBVS performance, particularly in challenging scaffold-hopping scenarios. As chemical spaces continue to expand and computational methods advance, LBVS will maintain its critical role in the drug discovery pipeline, enabling rapid identification of novel bioactive compounds with reduced time and cost compared to traditional experimental approaches.
Scaffold hopping, also termed lead hopping, is a cornerstone strategy in modern ligand-based drug design (LBDD) with the objective of discovering structurally novel compounds that retain the biological activity of a known lead [47] [48]. This technique is primarily employed to overcome critical limitations associated with an existing molecular scaffold, including poor pharmacokinetic properties, toxicity, promiscuity, or patent restrictions [49] [50]. At its core, scaffold hopping aims to identify or design isofunctional molecular structures that possess chemically distinct core motifs while maintaining the essential pharmacophore—the ensemble of steric and electronic features necessary for optimal supramolecular interactions with a biological target [49] [51].
The practice is fundamentally guided by the similarity property principle, which posits that structurally similar molecules are likely to exhibit similar properties [47]. Scaffold hopping strategically navigates this principle by making significant alterations to the core structure, thereby generating novel intellectual property (IP) and circumventing existing liabilities, while conserving the spatial arrangement of key interaction features necessary for bioactivity [48]. This article delineates a structured, computational protocol for executing successful scaffold hops, leveraging molecular superposition and other pivotal LBDD techniques.
Key Concepts and Classification of Scaffold Hopping
A firm grasp of the different categories of scaffold hops is essential for selecting the appropriate computational strategy. These approaches are systematically classified based on the degree and nature of the structural modification from the original lead compound [47] [48].
Table 1: Classification of Scaffold Hopping Approaches
| Hop Category | Degree of Structural Novelty | Description | Typical Objective | Example |
|---|---|---|---|---|
| 1° Hop: Heterocycle Replacement [47] [48] | Low | Swapping or replacing atoms (e.g., C, N, O, S) within a ring system. | Fine-tuning properties, circumventing patents. | Replacing a phenyl ring with a pyridine or thiophene ring [47]. |
| 2° Hop: Ring Opening or Closure [47] [48] | Medium | Breaking bonds to open fused rings or forming new bonds to rigidify a structure. | Modifying molecular flexibility, improving potency or absorption. | Transformation of morphine (fused rings) to tramadol (opened structure) [47] [48]. |
| 3° Hop: Peptidomimetics [47] [48] | Medium-High | Replacing peptide backbones with non-peptide moieties. | Improving metabolic stability and oral bioavailability of peptide leads. | Designing small molecules that mimic the spatial presentation of key amino acid side chains. |
| 4° Hop: Topology-Based Hopping [47] [48] | High | Identifying cores with different connectivity but similar shapes and feature orientations. | Discovering chemically novel scaffolds with high IP potential. | Identifying a new chemotype from virtual screening that shares a similar 3D shape and pharmacophore. |
The following workflow diagram illustrates the logical decision process for selecting and applying these different scaffold hopping methods within a drug discovery project.
The Scientist's Toolkit: Essential Research Reagents and Computational Solutions
Successful implementation of scaffold hopping protocols relies on a suite of specialized software tools and computational reagents. The following table details key solutions and their specific functions in the workflow.
Table 2: Key Research Reagent Solutions for Scaffold Hopping
| Tool/Solution Name | Type | Primary Function in Scaffold Hopping | Application Context |
|---|---|---|---|
| SeeSAR (BioSolveIT) [49] | Software | Interactive structure-based design; visual analysis of binding poses and scoring. | Virtual screening hit analysis, binding mode validation. |
| ROCS (OpenEye) [50] | Software | Rapid overlay of chemical structures based on 3D molecular shape and chemical features. | Topology-based hopping, shape similarity screening. |
| FTrees (in infiniSee) [49] | Algorithm/Software | Represents molecules as Feature Trees (FTree) to compare overall topology and pharmacophore patterns. | Fuzzy pharmacophore searches, identifying distant structural relatives. |
| Pharmit [52] | Online Server | Pharmacophore-based virtual screening of large compound libraries using a web interface. | Rapid hit identification based on user-defined or generated pharmacophore models. |
| GOLD [52] | Software | Docks flexible ligands into protein binding sites using a genetic algorithm. | Structure-based validation of proposed scaffolds, binding affinity prediction. |
| TransPharmer [53] | Generative Model | GPT-based model conditioned on pharmacophore fingerprints for de novo molecule generation. | AI-driven scaffold elaboration and hopping under pharmacophoric constraints. |
| ReCore (SeeSAR) [49] | Software Module | Identifies fragments from databases that match the 3D geometry of a defined core's connection vectors. | Topological replacement of a molecular core fragment. |
Application Notes & Experimental Protocols
Protocol 1: Pharmacophore-Based Scaffold Hopping via Virtual Screening
This protocol uses a ligand-based pharmacophore model to screen compound libraries for new chemotypes, ideal when the 3D structure of the target protein is unavailable [49] [51].
Step 1: Pharmacophore Model Generation
- Input: A set of 3-10 known active ligands with diverse structures but common activity against the target.
- Procedure:
- Use software like Catalyst (in Discovery Studio) or MOE to generate a common feature pharmacophore model.
- Conformationally expand each ligand to represent their accessible 3D space.
- The algorithm (e.g., HipHop) identifies steric and electronic features (HBA, HBD, hydrophobic, aromatic, ionizable) common across the active set [52].
- Select the best hypothesis based on its ability to discriminate known actives from inactives.
- Output: A 3D pharmacophore model comprising spatial features (e.g., points, spheres, vectors) critical for biological activity.
Step 2: Database Screening with the Pharmacophore Query
- Input: The validated pharmacophore model and a chemical database (e.g., ZINC, Enamine, corporate library).
- Procedure:
- Load the pharmacophore query into a screening tool like Pharmit [52] or the screening module of Discovery Studio.
- Screen the database. The tool performs a rigid or flexible search to find molecules that can adopt a conformation matching the query's features.
- Apply exclusion volumes if the binding site geometry is known, to penalize compounds with steric clashes [51].
- Output: A list of "hits"—compounds that fit the pharmacophore query.
Step 3: Post-Screening Analysis and Selection
- Procedure:
- Filter hits based on drug-likeness (e.g., Lipinski's Rule of Five), synthetic accessibility, and other desired properties.
- Perform molecular docking (if a protein structure is available) to validate the predicted binding mode and affinity of the scaffold hop candidates [54] [52].
- Cluster the final hits by novel scaffold and prioritize for purchase or synthesis.
- Validation: Experimental testing of acquired/synthesized compounds for target activity.
Protocol 2: Topological Replacement via Molecular Superposition
This protocol focuses on replacing a core scaffold while preserving the spatial orientation of substituents, using 3D molecular superposition [49] [50].
Step 1: Define the Core and its Vectors
- Input: The lead compound with an undesired scaffold.
- Procedure:
- Define the section of the molecule to be replaced as the "core".
- Identify the connection points (atoms where substituents are attached) on this core.
- Calculate the 3D vectors (direction and distance) between these connection points in the lead's bioactive conformation.
Step 2: Search for Replacement Scaffolds
- Input: The geometric constraints (vector distances and angles) from Step 1.
- Procedure:
- Use a tool like ReCore in SeeSAR or CAVEAT [49] [50].
- The tool screens a database of 3D fragments (e.g., from the PDB or ZINC) for those that match the geometric constraints of the original core's vectors.
- Apply optional pharmacophore constraints to ensure the new core can present key interactions with the target [49].
- Output: A list of candidate fragments that geometrically match the query.
Step 3: Superposition and Merging
- Procedure:
- Superimpose the candidate fragment onto the original core based on the optimal overlap of the connection vectors.
- Graft the original substituents onto the new core's connection points.
- Energy-minimize the newly constructed molecule to relieve any steric strain.
Step 4: Validation of the Hybrid Molecule
- Procedure:
- Perform molecular docking to ensure the new hybrid molecule maintains key interactions with the target.
- Use a tool like SeeSAR's Similarity Scanner to check the shape and feature similarity between the new molecule and the original lead [49].
- Use QSAR models or ADMET predictors to check if the liabilities of the original lead have been improved [52].
Protocol 3: AI-Driven Scaffold Generation with Pharmacophore Constraints
This modern protocol employs generative AI models to create novel scaffolds de novo, conditioned on specific pharmacophoric requirements [53].
Step 1: Define the Target Pharmacophore
- Input: Known active ligand(s) or a protein-ligand complex structure.
- Procedure:
- If a complex structure is available, extract key protein-ligand interaction points.
- Alternatively, generate a pharmacophore fingerprint from active ligands, as done with TransPharmer [53]. This fingerprint encodes the type and spatial relationship of key features.
Step 2: Configure and Run the Generative Model
- Input: The pharmacophore fingerprint or feature set from Step 1.
- Procedure:
- Employ a generative model like TransPharmer, which uses a Generative Pre-training Transformer (GPT) architecture conditioned on pharmacophore fingerprints [53].
- Set generation parameters to explore the local chemical space around the reference pharmacophore.
- Execute the model to generate a library of novel molecules (represented as SMILES strings) that satisfy the input pharmacophore constraints.
Step 3: Analyze and Validate Generated Molecules
- Procedure:
- Filter generated molecules for chemical validity and structural novelty compared to the training set.
- Assess the pharmacophoric similarity (e.g., using ErG fingerprints [53]) between generated molecules and the target to ensure fidelity.
- Perform in-silico validation via molecular docking and dynamics simulations (as in Protocol 1, Step 3) to predict binding affinity and complex stability.
- Output: A set of novel, AI-designed scaffold hop candidates ready for experimental validation.
Data Presentation and Analysis
The effectiveness of scaffold hopping methodologies is quantifiable through both computational metrics and experimental outcomes. The table below summarizes key performance data from published studies and software implementations.
Table 3: Quantitative Performance of Scaffold Hopping Methods
| Method / Tool | Key Metric | Reported Performance / Outcome | Context & Validation |
|---|---|---|---|
| Pharmacophore-Based Virtual Screening [52] | Enrichment Factor | 50.6 | Screening for α-glucosidase inhibitors using Pharmit. |
| TransPharmer (Generative AI) [53] | Experimental Hit Rate | 3 out of 4 synthesized compounds showed submicromolar activity. | Case study on PLK1 inhibitors; most potent compound (IIP0943) at 5.1 nM. |
| TransPharmer (Generative AI) [53] | Pharmacophoric Similarity (S_pharma) | Superior performance in de novo generation and scaffold elaboration tasks. | Benchmarking against models like LigDream and PGMG. |
| Shape Similarity (ROCS) [50] | Success in Identifying Novel Chemotypes | Numerous published successes in finding bioactive, novel chemical structures. | Considered a gold standard for lead hopping via 3D database searching. |
| FTrees [49] | Chemical Space Navigation | Swift identification of molecules with similar feature trees but different scaffolds. | Used for "fuzzy pharmacophore" searches and identifying distant structural relatives. |
Scaffold hopping, powered by robust computational techniques like molecular superposition, pharmacophore modeling, and modern AI, is an indispensable strategy in the LBDD arsenal. The structured protocols outlined—ranging from database screening to de novo generation—provide a clear roadmap for researchers to systematically generate novel intellectual property while mitigating the pharmacokinetic and toxicological liabilities of existing lead compounds. By adhering to these detailed application notes and leveraging the specified toolkit of software solutions, drug development professionals can effectively navigate the vast chemical space to discover breakthrough therapeutic candidates with improved profiles and strong patent positions. The continuous advancement of generative models and high-fidelity simulation tools promises to further accelerate and de-risk this critical endeavor.
5-Lipoxygenase (5-LOX) is a non-heme iron-containing dioxygenase enzyme that plays a pivotal role in the biosynthesis of leukotrienes (LTs) from arachidonic acid (AA) [20]. It catalyzes the addition of molecular oxygen into polyunsaturated fatty acids containing cis, cis 1-4 pentadiene structures to form 5-hydroperoxyeicosatetraenoic acid (5-HpETE), the precursor of both non-peptido (LTB4) and peptido (LTC4, LTD4, and LTE4) leukotrienes [20]. These lipid mediators are critically involved in the pathogenesis of inflammatory and allergic diseases such as asthma, ulcerative colitis, and rhinitis [20]. Emerging evidence also implicates 5-LOX and its metabolic products in various cancers, including colon, esophagus, prostate, and lung malignancies, primarily through stimulating cell proliferation, inhibiting apoptosis, and increasing metastasis and angiogenesis [20].
The therapeutic targeting of 5-LOX has been validated by the clinical approval of zileuton, an iron-chelating inhibitor, for the treatment of asthma [20]. However, zileuton suffers from limitations including liver toxicity and unfavorable pharmacokinetics, necessitating the development of improved therapeutic agents [55]. The recent resolution of the human 5-LOX crystal structure has advanced structure-based drug design approaches, but ligand-based drug design (LBDD) strategies remain particularly valuable for this target due to the historical scarcity of structural information and the enzyme's supposed flexibility [55].
Ligand-Based Drug Design Methodologies for 5-LOX Inhibition
Pharmacophore Modeling
Pharmacophore modeling represents a fundamental LBDD approach that identifies the essential structural features and their spatial arrangements necessary for molecular recognition and biological activity [13]. For 5-LOX inhibitor design, both ligand-based and structure-based pharmacophore models have been employed. Ligand-based models are derived from a set of known active compounds that share a common biological target, while structure-based models are generated from analysis of ligand-target interactions in available crystal structures [13].
In practice, 5-LOX pharmacophore models typically incorporate features such as hydrogen bond acceptors/donors, hydrophobic regions, and aromatic rings that correspond to critical interactions with the enzyme's active site [20]. Automated pharmacophore generation algorithms like HipHop and HypoGen have been utilized to align compounds and extract pharmacophoric features based on predefined rules and scoring functions [13]. These models subsequently serve as 3D queries for virtual screening of large compound libraries to identify potential hits with similar pharmacophoric features [13].
Quantitative Structure-Activity Relationship (QSAR) Modeling
QSAR modeling establishes mathematical relationships between structural features (descriptors) and the biological activity of a compound set [13]. Both 2D and 3D QSAR approaches have been extensively applied to 5-LOX inhibitor development:
2D QSAR methods, including Free-Wilson and Hansch analyses, rely on 2D structural features such as substituents and fragments to correlate with activity [13]. These linear models were initially derived using relatively small experimental datasets based on specific compound classes but showed limitations for complex biological systems [55].
3D QSAR approaches, such as Comparative Molecular Field Analysis (CoMFA) and Comparative Molecular Similarity Indices Analysis (CoMSIA), consider the 3D alignment of compounds and calculate steric, electrostatic, and other field-based descriptors [55]. These methods provide insights into the three-dimensional requirements for optimal ligand-target interactions and can guide structure-based design efforts [13].
Recent advances have incorporated machine learning techniques to develop more sophisticated QSAR models capable of handling larger and structurally diverse datasets. Studies have utilized algorithms including Support Vector Machines (SVM), k-Nearest Neighbors (k-NN), Logistic Regression, and Decision Trees to improve prediction accuracy [55] [56]. One comprehensive study developed QSAR classification models using a diverse dataset of 1,605 compounds (786 inhibitors and 819 non-inhibitors) retrieved from the ChEMBL database [55]. The best-performing model achieved 76.6% accuracy for the training set and 77.9% for the test set using the k-NN algorithm with PowerMV descriptors filtered by Information Gain feature selection [56].
Table 1: Performance of Machine Learning Algorithms for 5-LOX QSAR Modeling
| Algorithm | Descriptor Database | Feature Selection | Training Accuracy (%) | Test Accuracy (%) |
|---|---|---|---|---|
| k-NN (k=5) | PowerMV | Information Gain | 76.6 | 77.9 |
| SVM | Combined | CFS | 75.2 | 76.3 |
| Decision Trees | Ochem | CFS | 73.8 | 74.5 |
| Logistic Regression | e-Dragon | CFS | 72.1 | 73.8 |
Molecular Similarity and Scaffold Hopping
Molecular similarity analysis quantifies structural resemblance between compounds using 2D (fingerprint-based) or 3D (shape-based) approaches [13]. For 5-LOX inhibitor design, similarity searching has been employed to identify novel chemotypes that maintain the desired biological activity but possess distinct molecular scaffolds—a strategy known as "scaffold hopping" [13]. This approach is particularly valuable for circumventing patent restrictions or improving ADME (Absorption, Distribution, Metabolism, Excretion) properties while retaining efficacy.
Bioisosteric replacement strategies represent another powerful LBDD technique for 5-LOX inhibitor optimization, involving the substitution of functional groups or substructures with bioisosteres that have similar physicochemical properties but potentially improved selectivity or safety profiles [13]. Successful applications of these approaches have led to the discovery of novel 5-LOX inhibitors with enhanced therapeutic indices.
Experimental Protocols and Workflows
Comprehensive QSAR Model Development Protocol
Objective: To develop a robust QSAR classification model for predicting 5-LOX inhibition activity using machine learning algorithms.
Materials and Software:
- Chemical database (e.g., ChEMBL) with documented 5-LOX inhibition values
- Molecular descriptor calculation software (e.g., Dragon, PowerMV)
- Machine learning environment (e.g., Python with scikit-learn, WEKA)
- Validation metrics calculator
Procedure:
Dataset Curation:
- Retrieve 5-LOX inhibition data from reliable sources such as ChEMBL database
- Include structurally diverse compounds with documented IC50 values
- Preprocess structures: remove duplicates, standardize tautomers, neutralize charges
- Classify compounds as inhibitors (IC50 ≤ 10 μM) and non-inhibitors (IC50 > 10 μM) for classification models
Descriptor Calculation:
- Generate comprehensive molecular descriptors using multiple software packages:
- 2D descriptors (constitutional, topological, electronic)
- 3D descriptors (steric, electrostatic fields)
- Standardize descriptors: remove constant variables, handle missing values
- Generate comprehensive molecular descriptors using multiple software packages:
Feature Selection:
- Apply filter-based feature selection methods:
- Correlation-based Feature Selection (CFS)
- Information Gain (IG)
- Retain most informative descriptors for model building
- Apply filter-based feature selection methods:
Model Training:
- Split data into training (80%) and test sets (20%)
- Implement multiple machine learning algorithms:
- Support Vector Machines (SVM)
- k-Nearest Neighbors (k-NN)
- Decision Trees
- Random Forest
- Logistic Regression
- Optimize hyperparameters using cross-validation
Model Validation:
- Perform 5-fold cross-validation on training set
- Evaluate on external test set
- Apply Y-scrambling to assess chance correlation
- Determine applicability domain
Virtual Screening:
- Apply best-performing model to screen compound databases
- Prioritize potential hits for experimental validation
Pharmacophore-Based Virtual Screening Protocol
Objective: To identify novel 5-LOX inhibitors using pharmacophore-based virtual screening.
Materials and Software:
- Set of known active 5-LOX inhibitors
- Pharmacophore modeling software (e.g., Catalyst, Phase)
- Compound database for screening (e.g., ZINC, e-Drug3D)
- Molecular docking software (optional)
Procedure:
Pharmacophore Model Generation:
- Select training set of structurally diverse known 5-LOX inhibitors
- Conformational analysis to generate representative conformers
- Identify common pharmacophoric features:
- Hydrogen bond donors/acceptors
- Hydrophobic regions
- Aromatic rings
- Ionizable groups
- Generate hypothesis using automated algorithms (e.g., HipHop, HypoGen)
- Validate model using test set of active and inactive compounds
Database Screening:
- Prepare 3D database of screening compounds
- Generate multiple conformers for each compound
- Screen against pharmacophore model
- Rank hits by fit value
Post-Screening Filtering:
- Apply drug-likeness filters (Lipinski's Rule of Five)
- Remove compounds with structural alerts or potential toxicity
- Assess chemical diversity of hit list
Experimental Validation:
- Select top candidates for in vitro 5-LOX inhibition assays
- Determine IC50 values for confirmed hits
- Progress promising leads to further optimization
Case Study: Successful Application of LBDD for 5-LOX Inhibitor Discovery
A recent study demonstrated the powerful integration of multiple LBDD approaches for the identification of novel 5-LOX inhibitors [56]. Researchers developed QSAR classification models using machine learning algorithms applied to a structurally diverse dataset of 1,605 compounds. The best-performing model, utilizing k-NN algorithm with PowerMV descriptors, achieved 77.9% accuracy on an external test set [56].
This model was subsequently employed as a virtual screening tool to identify potential 5-LOX inhibitors from the e-Drug3D database. The screening yielded 43 potential hit candidates, including the known 5-LOX inhibitor zileuton as well as novel scaffolds [56]. Further refinement through molecular docking simulations identified four potential hits with comparable binding affinity to zileuton: Belinostat, Masoprocol, Mefloquine, and Sitagliptin [56].
This case study highlights the efficiency of LBDD approaches in rapidly identifying both known and novel chemotypes with potential 5-LOX inhibitory activity, significantly reducing the time and resources required for initial hit identification.
Table 2: Key Research Reagent Solutions for 5-LOX LBDD Studies
| Resource Category | Specific Tools/Databases | Function in 5-LOX Inhibitor Development |
|---|---|---|
| Chemical Databases | ChEMBL, PubChem, ZINC, e-Drug3D | Sources of chemical structures and bioactivity data for model building and virtual screening |
| Descriptor Calculation | Dragon, PowerMV, OCHEM | Generation of molecular descriptors for QSAR modeling |
| Pharmacophore Modeling | Catalyst, Phase, MOE | Creation of 3D pharmacophore models for virtual screening |
| Machine Learning | scikit-learn, WEKA, KNIME | Implementation of classification and regression algorithms for QSAR model development |
| Molecular Docking | AutoDock, GOLD, Glide | Validation of potential hits through binding mode analysis (used complementarily with LBDD) |
| Validation Assays | In vitro 5-LOX inhibition assays | Experimental confirmation of virtual screening hits |
Integrated LBDD and SBDD Approaches
While LBDD strategies have proven highly valuable for 5-LOX inhibitor development, the most successful recent approaches have integrated both ligand-based and structure-based methods [13]. The availability of the human 5-LOX crystal structure has enabled more precise structure-based optimization of hits initially identified through LBDD approaches [55].
This integrated strategy typically follows a workflow where:
- LBDD methods (QSAR, pharmacophore modeling) rapidly identify potential hit compounds from large chemical libraries
- Structure-based methods (molecular docking, structure-based pharmacophore modeling) refine and optimize the initial hits
- Iterative design cycles incorporate both ligand activity data and structural insights to improve potency, selectivity, and drug-like properties
Additionally, the development of dual COX-2/5-LOX inhibitors represents a promising approach to enhance anti-inflammatory efficacy while reducing side effects associated with selective COX-2 inhibition [57] [58]. Licofelone, a balanced inhibitor of both 5-LOX and cyclooxygenase pathways, has demonstrated comparable efficacy to naproxen with significantly improved gastrointestinal safety in clinical studies [58].
Ligand-based drug design strategies have played a crucial role in advancing the development of novel 5-LOX inhibitors, particularly during periods when structural information was limited. The integration of traditional LBDD approaches with modern machine learning techniques has significantly enhanced our ability to identify and optimize promising therapeutic candidates for inflammatory diseases, allergic conditions, and cancer.
Future directions in this field will likely focus on:
- Development of more sophisticated deep learning architectures for activity prediction
- Enhanced handling of activity cliffs through advanced molecular representations
- Increased integration of multi-target design strategies for balanced pathway inhibition
- Application of LBDD approaches to novel therapeutic indications for 5-LOX inhibitors
As chemical and biological data continue to expand, ligand-based methods will remain essential components of the drug discovery toolkit, providing valuable insights for target intervention even when structural information is incomplete or challenging to utilize effectively.
Overcoming Challenges and Optimizing LBDD Strategies
Navigating the Bias and Overfitting of Training Set Ligands
In ligand-based drug design (LBDD), the development of predictive models is fundamentally dependent on the chemical data used for training. Overfitting occurs when a model learns not only the underlying structure-activity relationship but also the noise and specific idiosyncrasies of the training data, resulting in poor performance when applied to new, unseen compounds [12]. Bias is often introduced through training sets that contain significant redundancies and insufficient chemical diversity, leading to models that "memorize" training examples rather than learning generalizable principles of molecular activity [59]. These interconnected challenges are particularly problematic in LBDD because the ultimate goal is to discover novel active compounds, not merely to recognize known ones.
The prevalence of these issues is substantial. Recent investigations have revealed that undetected overfitting is widespread in ligand-based classification, with significant redundancies between training and validation data in several widely used benchmarks [59]. The AVE (Bias) measure, which accounts for similarity among both active and inactive molecules, has demonstrated that the reported performance of many ligand-based methods can be explained primarily by overfitting to benchmarks rather than genuine predictive accuracy [59]. This fundamental challenge affects various LBDD approaches, including quantitative structure-activity relationship (QSAR) modeling, pharmacophore development, and machine learning-based virtual screening, potentially compromising their real-world utility in drug discovery campaigns.
Quantitative Assessment of Data Set Bias
The AVE Bias Metric
The AVE (Bias) measure provides a quantitative framework for evaluating training-validation redundancy in ligand-based classification problems. Unlike traditional validation approaches that may overlook molecular similarity between training and test sets, AVE specifically accounts for the similarity among both active and inactive molecules, offering a more comprehensive assessment of potential bias [59].
The AVE bias calculation incorporates two critical components: the maximum similarity of each validation molecule to any training molecule, and the average similarity between validation and training sets. This dual approach captures both extreme outliers (molecules nearly identical to training examples) and overall dataset redundancy. The mathematical relationship between AVE bias and model performance has been shown to be remarkably consistent across different properties, chemical fingerprints, and similarity measures [59].
Benchmark Analysis Findings
Recent comprehensive evaluations using the AVE metric have revealed systematic biases in several widely used benchmarks for virtual screening and classification. The correlation between AVE bias and reported performance measures suggests that many published results may reflect dataset-specific overfitting rather than true predictive capability [59].
Table 1: AVE Bias Analysis Across Ligand-Based Benchmarks
| Benchmark Category | AVE Bias Range | Correlation with Reported Performance | Impact on Generalization |
|---|---|---|---|
| Virtual Screening Sets | 0.15-0.45 | Strong positive (R² > 0.7) | High false positive rates for novel chemotypes |
| Classification Benchmarks | 0.25-0.52 | Strong positive (R² > 0.75) | Significant performance drop on unbiased sets |
| QSAR Data Sets | 0.18-0.41 | Moderate to strong positive | Poor extrapolation to structurally diverse compounds |
The practical implication of these findings is substantial: models developed on biased training sets will typically fail when applied to structurally novel compounds in prospective drug discovery campaigns. This underscores the critical need for rigorous bias assessment before deploying LBDD models in real-world applications.
Protocols for Bias Detection and Mitigation
Experimental Protocol: Bias Assessment in Training Data
Objective: To quantitatively evaluate and mitigate bias in ligand-based training sets for drug discovery applications.
Materials and Reagents:
- Compound data set with associated biological activity measurements
- Chemical structure standardization tools (e.g., RDKit, OpenBabel)
- Computing environment with sufficient RAM for similarity calculations
- Bias assessment software (e.g., custom Python scripts implementing AVE metric)
Procedure:
Data Preprocessing and Standardization
- Standardize molecular structures using consistent rules for tautomers, stereochemistry, and protonation states
- Remove duplicates and compounds with undesirable properties using filters (e.g., PAINS, reactivity filters)
- Annotate activity classes based on experimental thresholds (e.g., IC50 < 1μM = active)
Chemical Representation Generation
- Generate multiple molecular descriptors for each compound:
- Extended connectivity fingerprints (ECFP4, ECFP6)
- Molecular access system (MACCS) keys
- Topological torsional fingerprints
- Store descriptors in efficient data structures for rapid similarity calculation
- Generate multiple molecular descriptors for each compound:
Similarity Matrix Calculation
- Compute pairwise Tanimoto coefficients between all compounds in training and validation sets
- For large datasets (>50,000 compounds), employ efficient algorithms or sampling approaches
- Store similarity matrices for subsequent bias analysis
AVE Bias Quantification
- Calculate maximum similarity for each validation compound to any training set compound
- Compute average similarity between validation and training sets
- Derive composite AVE bias score using established formulas [59]
- Compare against benchmark values to assess bias severity
Bias Mitigation through Data Stratification
- Apply sphere exclusion algorithms to ensure chemical diversity
- Implement cluster-based splitting to separate structurally similar compounds
- Validate stratification effectiveness through independent bias assessment
Troubleshooting:
- High AVE scores (>0.3) indicate substantial bias requiring dataset refinement
- If chemical diversity cannot be achieved through stratification, consider data augmentation or transfer learning approaches
- For multi-target activity data, ensure target-specific bias assessment
The following workflow diagram illustrates the comprehensive protocol for bias assessment and mitigation in LBDD:
Advanced Model Validation Protocols
Objective: To implement validation strategies that accurately assess model generalization beyond training set biases.
Procedure:
Temporal Validation Splitting
- Split data based on publication date to simulate real-world prospective prediction
- Use older compounds for training and newer compounds for validation
- Assess performance degradation compared to random splits
Scaffold-Based Splitting
- Identify molecular scaffolds using standardized fragmentation algorithms
- Assign compounds to training and test sets based on scaffold identity
- Ensure no scaffold overlap between training and validation sets
Analog Series-Disjoint Splitting
- Identify analog series using structural similarity metrics
- Ensure complete analog series are contained within either training or test sets
- Evaluate performance on novel chemotypes
Progressive Compound Elimination
- Systematically remove structural analogs from training data
- Monitor performance as training set diversity increases
- Establish diversity-accuracy tradeoff curves for model selection
Integrated Strategies for Robust LBDD
Hybrid LB-SB Approaches to Mitigate Bias
Integrating ligand-based and structure-based methods provides a powerful strategy to overcome the limitations of either approach alone. The complementary nature of these methods allows researchers to leverage both chemical similarity and structural insights, reducing dependency on biased training sets [17].
Table 2: Hybrid LB-SB Strategies for Bias Reduction
| Strategy | Implementation | Bias Mitigation Mechanism | Application Context |
|---|---|---|---|
| Sequential Filtering | LB pre-screening followed by SB refinement | Reduces dependency on single method biases | Large library screening (>1M compounds) |
| Parallel Consensus | Independent LB and SB scoring with rank fusion | Counters method-specific limitations | Medium library screening (50K-1M compounds) |
| Pharmacophore-Docking Hybrid | LB-derived pharmacophores with SB docking constraints | Combines historical data with structural insights | Focused library design |
| Structure-Informed QSAR | SB-derived descriptors in QSAR models | Incorporates target-specific features | Lead optimization series |
The algebraic graph-based AGL-EAT-Score represents an advanced implementation of hybrid principles, integrating extended atom-type multiscale weighted colored subgraphs with algebraic graph theory to capture specific atom pairwise interactions while maintaining generalization capability [60]. This approach demonstrates how incorporating structural insights can enhance model robustness beyond pure ligand-based similarity.
Representation Learning for Generalized Models
Advanced molecular representation strategies can significantly reduce bias by capturing fundamental chemical principles rather than superficial similarities. The algebraic graph-based extended atom-type (AGL-EAT) approach constructs multiscale weighted colored subgraphs from 3D structures of protein-ligand complexes, using eigenvalues and eigenvectors of graph Laplacian and adjacency matrices to capture high-level details of specific atom pairwise interactions [60].
This representation methodology offers several bias-reduction advantages:
- Extended atom typing that captures nuanced chemical environments beyond elemental symbols
- Multi-scale weighted colored subgraphs that represent complex molecular interactions
- Algebraic graph theory that extracts fundamental topological features less prone to overfitting
- Similarity-controlled training that minimizes bias and over-representation in training sets
Experimental validation demonstrates that models built using these principles maintain predictive accuracy across diverse chemical scaffolds, addressing the fundamental generalization challenges in LBDD [60].
Research Reagent Solutions
Table 3: Essential Research Reagents and Computational Tools for Bias-Resistant LBDD
| Reagent/Tool | Function | Application in Bias Mitigation |
|---|---|---|
| AVE Bias Calculator | Quantifies training-validation set redundancy | Objective assessment of dataset quality and potential overfitting |
| Sphere Exclusion Algorithms | Maximizes chemical diversity in training sets | Creates structurally representative datasets reducing bias toward known chemotypes |
| Algebraic Graph Descriptors | Molecular representation using graph theory | Captures fundamental chemical features less prone to overfitting |
| Scaffold Network Tools | Identifies molecular scaffolds and analog series | Enables scaffold-disjoint splitting for rigorous validation |
| Multi-task Learning Frameworks | Simultaneous modeling of related targets | Leverages transfer learning to reduce dependency on single-target data |
| Similarity Fusion Algorithms | Integrates multiple molecular representations | Reduces bias inherent to single fingerprint methods |
The following diagram illustrates the relationship between different bias mitigation strategies and their application points in the LBDD workflow:
Addressing bias and overfitting in ligand-based drug design requires systematic approaches throughout the model development pipeline. The protocols and strategies outlined in this document provide a framework for creating more robust and generalizable predictive models. The integration of rigorous bias assessment using metrics like AVE, advanced molecular representations incorporating structural principles, and hybrid approaches that combine ligand-based and structure-based methods represents the current state of the art in overcoming these fundamental challenges.
Future directions point toward increased utilization of multi-task learning across related targets, transfer learning from data-rich to data-poor targets, and the development of foundation models for chemistry that capture fundamental chemical principles rather than dataset-specific patterns. As the field progresses, the emphasis must remain on developing models that genuinely understand structure-activity relationships rather than merely memorizing training examples, ultimately accelerating the discovery of novel therapeutic agents through more predictive computational guidance.
Advanced Statistical and Machine Learning Methods for Robust QSAR
In the absence of three-dimensional structural information for potential drug targets, ligand-based drug design (LBDD) serves as a fundamental approach for drug discovery and lead optimization [12]. Within this paradigm, Quantitative Structure-Activity Relationship (QSAR) modeling represents a powerful computational technique that quantifies the correlation between chemical structures and their biological activity [12] [61]. The foundational hypothesis of QSAR is that similar structural or physiochemical properties yield similar biological activity [12]. While traditional QSAR was limited to small congeneric series and simple regression methods, modern QSAR has evolved to model vast datasets containing thousands of diverse chemical structures using advanced statistical and machine learning algorithms [61]. This evolution has transformed QSAR into an indispensable tool for virtual screening, enabling researchers to prioritize compounds for synthesis and biological evaluation with significantly higher hit rates (typically 1-40%) compared to traditional high-throughput screening (0.01-0.1%) [61].
The integration of machine learning, particularly deep learning, has created a paradigm shift in QSAR methodology [62] [63]. Recent comparative studies demonstrate that deep neural networks (DNN) and random forest (RF) significantly outperform traditional methods like partial least squares (PLS) and multiple linear regression (MLR), especially when working with limited training data [62]. These advanced methods have proven capable of identifying potent inhibitors and agonists even from small training sets, showcasing their potential to accelerate early-stage drug discovery [62]. This document provides detailed application notes and protocols for implementing these advanced statistical and machine learning methods to develop robust QSAR models within ligand-based drug design workflows.
Key Statistical and Machine Learning Methods
Comparative Performance Analysis
Table 1: Performance Comparison of QSAR Modeling Methods Using Different Training Set Sizes [62]
| Method | Category | Training Set: 6069 Compounds (r²) | Training Set: 3035 Compounds (r²) | Training Set: 303 Compounds (r²) | Key Characteristics |
|---|---|---|---|---|---|
| DNN (Deep Neural Networks) | Machine Learning | ~0.90 | ~0.90 | ~0.94 | Self-learning property; automatically weights important features; handles complex nonlinear relationships |
| RF (Random Forest) | Machine Learning | ~0.90 | ~0.88 | ~0.84 | Ensemble method; uses bagging with multiple decision trees; robust to overfitting |
| PLS (Partial Least Squares) | Traditional QSAR | ~0.65 | ~0.45 | ~0.24 | Combination of MLR and PCA; optimal for multiple dependent variables |
| MLR (Multiple Linear Regression) | Traditional QSAR | ~0.65 | ~0.55 | ~0.93 (overfit) | Simple stepwise regression; limited with large descriptor sets; prone to overfitting with small datasets |
Methodological Protocols
Protocol 2.2.1: Deep Neural Network QSAR Implementation
Objective: To implement a DNN-based QSAR model for activity prediction using chemical structure data.
Materials:
- Chemical structures in SMILES or SDF format
- Experimental activity data (IC₅₀, KI, EC₅₀, or binary active/inactive)
- Computing resources (GPU recommended for large datasets)
- Python environment with TensorFlow/Keras or PyTorch
- Molecular descriptor calculation software (RDKit, PaDEL)
Procedure:
- Data Curation and Preparation:
- Collect and curate chemical structures and corresponding activity data following established guidelines [61].
- Remove organometallics, counterions, mixtures, and inorganics.
- Standardize tautomeric forms and perform ring aromatization.
- Address duplicates by averaging, aggregating, or removing them to produce single bioactivity results.
Descriptor Calculation:
- Calculate molecular descriptors (e.g., 613 descriptors from AlogP_count, ECFP, FCFP) [62].
- Implement extended connectivity fingerprints (ECFPs) which are circular topological depictions of molecules generated in a molecule-directed manner [62].
- Consider functional-class fingerprints (FCFPs) for pharmacophore identification of atoms [62].
- Normalize descriptors to zero mean and unit variance.
Data Splitting:
- Split data into training (80%), validation (10%), and test sets (10%) using stratified sampling to maintain activity distribution.
- For small datasets, implement k-fold cross-validation (k=5 or 10) [12].
DNN Architecture Optimization:
- Design network with input layer (nodes matching descriptor count), 2-5 hidden layers with decreasing nodes, and output layer (1 node for regression, 2 for classification).
- Implement Bayesian regularized artificial neural network (BRANN) with Laplacian prior to optimize descriptor number by pruning ineffective descriptors [12].
- Use ReLU activation for hidden layers, linear/sigmoid for output layer.
- Apply dropout regularization (0.2-0.5 rate) to prevent overfitting.
Model Training and Validation:
- Train using Adam optimizer with learning rate 0.001, batch size 32-128.
- Implement early stopping based on validation loss with patience of 50 epochs.
- Validate using external test set and calculate R²pred, Q², and other metrics [12].
- Define applicability domain using leverage approach or distance-based methods.
Troubleshooting:
- If model shows overfitting, increase dropout rate, add L2 regularization, or reduce network complexity.
- For poor convergence, adjust learning rate, try different optimizers, or check data normalization.
Protocol 2.2.2: Random Forest QSAR Implementation
Objective: To implement a Random Forest-based QSAR model for classification or regression tasks.
Procedure:
- Data Preparation:
- Follow same data curation and descriptor calculation as Protocol 2.2.1.
- For large descriptor sets, implement preliminary feature selection.
Model Training:
- Set number of trees in forest (100-500), optimizing through out-of-bag error.
- Determine optimal tree depth through cross-validation.
- Use bagging (bootstrap aggregating) to generate multiple trees with random sampling of training data [62].
Model Validation:
- Perform internal validation using out-of-bag samples.
- Conduct external validation with test set.
- Calculate variable importance scores for descriptor interpretation.
Troubleshooting:
- If model is computationally intensive, reduce tree count or implement feature selection.
- For noisy data, increase tree number to improve stability.
Advanced Integration with Traditional QSAR
3D-QSAR and Conformational Approaches
Modern QSAR extends beyond traditional 2D descriptors to incorporate three-dimensional structural information, even in the absence of target protein structures [12] [19]. The Conformationally Sampled Pharmacophore (CSP) approach (CSP-SAR) represents a significant advancement in 3D-QSAR methodology [12]. This method addresses the critical challenge of ligand flexibility by comprehensively sampling accessible conformations before identifying common pharmacophore features across active compounds.
Protocol 3.1.1: CSP-SAR Model Development
Objective: To develop a robust 3D-QSAR model using conformational sampling and pharmacophore alignment.
Materials:
- Set of active compounds with measured biological activity
- Molecular modeling software with conformational analysis capability (e.g., OMEGA, CONFLEX)
- Pharmacophore generation tools (LigandScout, Phase)
- Partial Least Squares (PLS) analysis software
Procedure:
- Conformational Sampling:
- For each ligand, generate multiple low-energy conformations using molecular dynamics or systematic search.
- For macrocyclic and flexible molecules, increase sampling density due to exponential growth of accessible conformers [19].
- Apply energy window (e.g., 10-20 kcal/mol above global minimum) to select biologically relevant conformers.
Pharmacophore Identification:
- Superimpose conformations of known active compounds.
- Identify common chemical features: hydrogen bond donors/acceptors, hydrophobic areas, aromatic rings, charged groups [12].
- Generate multiple pharmacophore hypotheses with associated alignment.
Field Calculation and Modeling:
- Calculate molecular interaction fields (steric, electrostatic) for aligned compounds.
- Use PLS regression to correlate field values with biological activity.
- Validate model using leave-one-out and k-fold cross-validation [12].
Model Application:
- Screen compound databases by generating conformers, aligning to pharmacophore, and predicting activity.
- Use for lead optimization by visualizing regions where specific structural modifications enhance activity.
Troubleshooting:
- If model lacks predictive power, increase conformational sampling or adjust pharmacophore feature definitions.
- For alignment challenges, include shape-based constraints or use multiple active compounds with diverse scaffolds.
Multi-Target QSAR Modeling
The development of classification-based QSAR models for multiple targets or tasks represents a significant advancement, particularly with software tools like QSAR-Co that enable robust multitasking or multitarget classification-based QSAR models [64]. These approaches are valuable for addressing selectivity challenges in kinase inhibitor design or predicting multi-target profiles for complex diseases.
Table 2: Research Reagent Solutions for Advanced QSAR Studies
| Reagent/Software | Type | Function | Application Notes |
|---|---|---|---|
| QSAR-Co | Open Source Software | Develop robust multitasking/multitarget classification-based QSAR models | Implements LDA and RF techniques; follows OECD validation principles [64] |
| ECFP/FCFP | Molecular Descriptors | Circular topological fingerprints capturing atom neighborhoods | ECFP: specific structural features; FCFP: pharmacophore abstraction [62] |
| AlogP_Count | Physicochemical Descriptor | Calculates lipophilicity and related substructure counts | Critical for ADMET property prediction [62] |
| CSP-SAR Tools | 3D-QSAR Methodology | Conformational sampling and pharmacophore-based alignment | Handles flexible molecules; superior to rigid alignment methods [12] |
| BRANN | Algorithm | Bayesian regularized artificial neural network | Prevents overfitting; automatically optimizes architecture [12] |
| DNN Frameworks | Algorithm | Deep neural networks for complex pattern recognition | TensorFlow, PyTorch; requires GPU for large datasets [62] |
Validation and Best Practices
Regulatory-Compliant QSAR Validation
Following OECD guidelines is essential for developing regulatory-acceptable QSAR models [64] [61]. These principles require that a QSAR model should have: (1) a defined endpoint, (2) an unambiguous algorithm, (3) a defined domain of applicability, (4) appropriate measures of goodness-of-fit, robustness, and predictivity, and (5) a mechanistic interpretation, when possible [61].
Protocol 4.1.1: Comprehensive QSAR Validation
Objective: To implement a thorough validation protocol adhering to OECD principles.
Procedure:
- Internal Validation:
- Perform leave-one-out (LOO) cross-validation: iteratively remove one compound, rebuild model, predict removed compound [12].
- Calculate cross-validated correlation coefficient Q² using formula: [Q^2 = 1 - \frac{\sum(y{pred} - y{obs})^2}{\sum(y{obs} - y{mean})^2}] [12]
- Implement k-fold cross-validation (typically 5-10 folds) for more robust estimate [12].
External Validation:
- Reserve sufficient portion of data (20-30%) before model development as external test set.
- Predict external set compounds without retraining model.
- Calculate predictive R² (R²pred) and other metrics like RMSEP, MAE.
Applicability Domain Definition:
- Implement leverage approach to identify structural extrapolations.
- Use distance-based methods (Euclidean, Mahalanobis) to define multivariate space.
- Flag predictions for compounds outside applicability domain as less reliable.
Y-Randomization Test:
- Randomize response variable multiple times and rebuild models.
- Confirm that randomized models show significantly worse performance than actual model.
- Ensure no chance correlation exists in the original model.
Data Curation Protocols
Protocol 4.2.1: Chemical Data Curation for QSAR
Objective: To implement comprehensive data curation procedures as mandatory preliminary step for QSAR modeling.
Procedure:
- Structure Standardization:
- Remove organometallics, counterions, mixtures, and inorganics.
- Normalize specific chemotypes and perform structural cleaning.
- Standardize tautomeric forms and implement ring aromatization.
- Detect and correct valence violations.
Bioactivity Data Curation:
- Identify and correct potential errors in experimental measurements.
- Address duplicates by averaging, aggregating, or removal to produce single bioactivity result.
- Apply consistent units and activity thresholds across datasets.
Descriptor Quality Control:
- Identify and remove constant or near-constant descriptors.
- Address highly correlated descriptors (collinearity).
- Apply appropriate scaling (autoscaling, range scaling) for multivariate methods.
Applications and Case Studies
Successful Implementations in Drug Discovery
Advanced QSAR methods have demonstrated significant success across various drug discovery applications. In kinase inhibitor development, ML-integrated QSAR has significantly improved selective inhibitor design for CDKs, JAKs, and PIM kinases [63]. The IDG-DREAM Drug-Kinase Binding Prediction Challenge exemplified machine learning's potential for accurate kinase-inhibitor interaction prediction, outperforming traditional methods and enabling inhibitors with enhanced selectivity, efficacy, and resistance mitigation [63].
In a notable case study, researchers employed both HTS and QSAR models to discover novel positive allosteric modulators for mGlu5, a GPCR involved in schizophrenia and Parkinson's disease [61]. The HTS of approximately 144,000 compounds yielded a hit rate of 0.94%. Subsequent QSAR modeling and virtual screening of 450,000 compounds achieved a dramatically higher hit rate of 28.2% [61]. This case demonstrates how QSAR-based virtual screening can significantly enrich hit rates compared to traditional HTS alone.
Another compelling application demonstrated the power of deep learning with limited data. Using a training set of just 63 mu-opioid receptor (MOR) agonists, a DNN model successfully identified a potent (~500 nM) MOR agonist from an in-house compound library [62]. This showcases the ability of advanced machine learning methods to extract meaningful patterns from small datasets, particularly valuable for novel targets with limited known actives.
Integration with Structure-Based Approaches
While this document focuses on ligand-based approaches, modern drug discovery increasingly leverages integrated workflows combining both ligand-based and structure-based methods [19]. In one common workflow, large compound libraries are rapidly filtered with ligand-based screening based on 2D/3D similarity to known actives or via QSAR models [19]. The most promising subset then undergoes structure-based techniques like molecular docking. This sequential integration improves overall efficiency by applying resource-intensive structure-based methods only to a narrowed set of candidates [19].
Advanced pipelines also employ parallel screening, running both structure-based and ligand-based methods independently on the same compound library [19]. Each method generates its own ranking, with results compared or combined in a consensus scoring framework. Hybrid approaches multiply compound ranks from each method to yield a unified rank order, favoring compounds ranked highly by both methods and thus increasing confidence in selecting true positives [19].
The strength of combining these approaches lies in their complementary views of drug-target interactions. Structure-based methods provide atomic-level information about specific protein-ligand interactions, while ligand-based methods infer critical binding features from known active molecules and excel at pattern recognition and generalization [19]. This integration helps prioritize compounds that are both structurally promising and chemically diverse.
In the discipline of ligand-based drug design (LBDD), predictive computational models are indispensable for accelerating the identification and optimization of novel drug candidates. These models, particularly Quantitative Structure-Activity Relationship (QSAR) models, establish a mathematical relationship between the chemical features of compounds (descriptors) and their biological activity [13] [12]. The ultimate value of these models is not their fit to existing data but their ability to make reliable and accurate predictions for new, unseen compounds. Therefore, rigorous model validation is not merely a final step but a fundamental component of the model development process, ensuring that predictions are trustworthy and can guide experimental efforts in drug discovery [12].
This protocol outlines comprehensive application notes for implementing internal and external cross-validation techniques, framed within the context of a broader thesis on LBDD. It is tailored for researchers, scientists, and drug development professionals who require robust, validated models to advance their drug discovery pipelines.
Theoretical Background
The Critical Role of Validation in QSAR Modeling
The development of a QSAR model follows a defined sequence: data collection and curation, descriptor calculation, model building, and, most critically, validation [13] [12]. A model that performs well on its training data may suffer from overfitting, where it learns noise and specificities of the training set rather than the underlying structure-activity relationship. This leads to poor predictive performance on new data [12]. Validation techniques are designed to assess the model's stability, robustness, and, most importantly, its predictive power, providing confidence in its application for virtual screening or lead optimization [13].
Defining Internal and External Validation
- Internal Validation: This process assesses the model's predictive performance using only the data available in the training set. It is primarily used to evaluate the model's robustness and stability—that is, how sensitive it is to small perturbations in the training data [12]. Internal validation is a crucial checkpoint during model development.
- External Validation: This is considered the gold standard for evaluating a model's predictive power. It involves testing the model on a completely separate set of compounds that were not used in any part of the model building process [12] [30]. A model that successfully passes external validation is considered to have high generalizability.
Experimental Protocols and Application Notes
Preliminary Data Curation and Preparation
The foundation of any reliable QSAR model is a high-quality, well-curated dataset.
- Procedure:
- Data Sourcing: Collect biological activity data (e.g., IC₅₀, Ki, pKi) and associated chemical structures for a congeneric series of compounds from reliable databases such as ChEMBL [13].
- Chemical Representation: Sketch or obtain the 2D or 3D structures of the compounds. Use software like LigPrep (Schrödinger) to generate realistic 3D structures, add hydrogen atoms, and perform energy minimization [30].
- Activity Data Conversion: Convert inhibitory concentrations (e.g., Ki) to a molar scale and then to a negative logarithmic scale (e.g., pKi = -log Ki) to linearize the relationship for modeling [30].
- Dataset Division: Split the full dataset into a training set (typically 75-80%) for model development and a test set (20-25%) for external validation. The division must ensure that both sets span the entire activity range and are structurally diverse. This can be done by sorting the compounds by activity and systematically assigning them to either set to achieve a representative distribution [30].
Protocol 1: Implementing Internal Cross-Validation
Internal validation is performed exclusively on the training set. The most common method is Leave-One-Out (LOO) cross-validation.
Procedure:
- Model Training: From a training set of
ncompounds, remove one compound to serve as a temporary test sample. - Model Reconstruction: Build the QSAR model using the remaining
n-1compounds. - Prediction: Use the newly built model to predict the activity of the omitted compound.
- Iteration: Repeat steps 1-3 until every compound in the training set has been left out once and predicted.
Calculation of Q²: Calculate the cross-validated correlation coefficient
Q²(also denoted asq2in some sources) using the formula below, whereY_obsandY_predare the observed and predicted activities of theith compound, andY_meanis the mean observed activity of the training set [12] [30].Q² = 1 - [ Σ(Y_obs - Y_pred)² / Σ(Y_obs - Y_mean)² ]
- Model Training: From a training set of
Interpretation: A
Q²value significantly greater than zero (e.g., >0.5) is generally indicative of a robust model. A highQ²suggests that the model is stable and not overly reliant on any single data point [12].
Protocol 2: Implementing External Validation
External validation provides the most credible assessment of a model's utility for prospective compound prediction.
- Procedure:
- Model Finalization: Using the entire training set, build the final QSAR model.
- Blind Prediction: Use this final model to predict the biological activities of the compounds in the separate, hitherto untouched test set.
- Performance Calculation: Calculate key statistical metrics by comparing the predicted activities against the experimentally observed activities for the test set compounds. Essential metrics include [65] [30]:
- R²_pred: The coefficient of determination for the test set predictions.
- RMSE (Root Mean Square Error): A measure of the average difference between predicted and observed values.
- MAE (Mean Absolute Error): The average absolute difference between prediction and observation.
Table 1: Key Statistical Parameters for Model Validation
| Parameter | Formula | Interpretation | Ideal Value |
|---|---|---|---|
| Q² (LOO) | 1 - [Σ(Y_obs - Y_pred)² / Σ(Y_obs - Y_mean)²] |
Internal robustness & stability [12] | > 0.5 |
| R² | 1 - [Σ(Y_obs - Y_pred)² / Σ(Y_obs - Y_mean)²] |
Goodness-of-fit of the model | Close to 1 |
| R²_pred | As for R², but for the external test set | True predictive power [30] | > 0.6 |
| RMSE | √[ Σ(Y_obs - Y_pred)² / n ] |
Average prediction error; lower is better [65] | As low as possible |
| MAE | Σ|Y_obs - Y_pred| / n |
Average absolute error; lower is better | As low as possible |
Advanced and Machine Learning Validation
With the adoption of complex machine learning (ML) algorithms like Support Vector Machines (SVR), Random Forests, and Neural Networks, validation strategies have evolved.
- k-Fold Cross-Validation: A more computationally efficient alternative to LOO, especially for large datasets. The training set is randomly partitioned into
kequal-sized subsets (folds). The model is trainedktimes, each time usingk-1folds for training and the remaining fold for validation. The results are averaged to produce a singleQ²estimate [12]. - Validation in Deep Learning: For deep learning models in de novo drug design, validation involves assessing not just predictive accuracy but also the novelty, synthesizability, and drug-likeness of the generated compounds using metrics like the retrosynthetic accessibility score (RAScore) [66].
- Algorithm Performance: Studies have shown that the choice of algorithm impacts predictive accuracy. For instance, a model for SARS-CoV-2 3CLpro inhibitors demonstrated that a Dragonfly Algorithm-Support Vector Regression (DA-SVR) model (
R² = 0.92,Q² = 0.92) outperformed both overly complex and overly simple models [65].
The following workflow diagram illustrates the integrated process of model building and validation.
The Scientist's Toolkit: Research Reagent Solutions
Table 2: Essential Software and Tools for QSAR Model Validation
| Tool/Software | Type | Primary Function in Validation |
|---|---|---|
| Schrödinger Suite (LigPrep, QikProp) [30] | Commercial Software | Compound structure preparation, energy minimization, and molecular descriptor calculation. |
| Strike [30] | Commercial Software | Performs Multiple Linear Regression (MLR) and other statistical analyses for QSAR model building. |
| MINITAB / R / Python | Statistical Software | Advanced statistical computation, PLS regression, and custom script-based validation (e.g., k-fold CV) [12] [30]. |
| MATLAB [12] | Numerical Computing | Automated MLR processes and implementation of advanced machine learning algorithms. |
| SwissADME [65] | Web Tool | Evaluation of drug-likeness and ADME properties to define the applicability domain. |
| ChEMBL / PubChem [13] | Public Database | Source of bioactivity data for training and test sets, crucial for external validation. |
Case Study: Validation in Practice
A study aimed at developing a 2D-QSAR model for angiogenin inhibitors provides a clear example of these protocols in action. The researchers:
- Curated a dataset of 30 compounds with known Ki values [30].
- Divided the data into a training set (23 compounds) and a test set (7 compounds), ensuring both sets covered the entire activity range [30].
- Developed a model using the Partial Least Squares (PLS) method to handle inter-correlated descriptors.
- Determined the optimal number of PLS components using the Leave-One-Out (LOO) method and the Predicted Residual Error Sum of Squares (PRESS) statistic for internal validation [30].
- The final model was validated externally by predicting the activities of the 7 test set compounds, demonstrating its predictive capability [30].
Concluding Remarks
The rigorous application of both internal and external cross-validation techniques is non-negotiable for the development of reliable and predictive QSAR models in ligand-based drug design. Internal validation checks the model's inherent robustness, while external validation is the ultimate test of its real-world applicability for predicting the activity of novel compounds. Adherence to the detailed protocols and methodologies outlined in this document will equip researchers with the necessary framework to build, validate, and deploy computational models that can significantly accelerate and de-risk the drug discovery process.
Addressing Molecular Flexibility and Conformational Sampling in 3D Methods
Molecular flexibility and conformational sampling represent fundamental challenges in computational drug design, particularly for ligand-based drug design (LBDD) approaches that rely on the analysis of active compounds to develop new therapeutic candidates [13]. The dynamic nature of both ligands and biological targets directly impacts binding affinity, selectivity, and ultimately, pharmacological efficacy. This application note examines current methodologies for addressing these challenges within the framework of 3D drug design techniques, providing detailed protocols and resources to enhance the accuracy of virtual screening and lead optimization campaigns.
The intrinsic flexibility of small molecules and their protein targets necessitates sophisticated computational approaches that extend beyond static structural representations. Conformational dynamics play a crucial role in molecular recognition, with proteins existing as ensembles of interconverting structures and ligands adopting multiple low-energy conformations [67] [68]. Ignoring this flexibility can lead to inaccurate binding mode predictions and failed optimization efforts, particularly for compounds with rotatable bonds or flexible macrocyclic structures [19].
Key Challenges in Molecular Flexibility
Ligand Flexibility
Small molecules, especially those with numerous rotatable bonds or cyclic systems, can access a wide range of thermodynamically accessible conformations. The challenge lies in sufficiently sampling this conformational space while maintaining computational efficiency.
Table 1: Challenges in Ligand Conformational Sampling
| Challenge | Impact on Drug Design | Common Affected Ligands |
|---|---|---|
| Multiple low-energy states | Difficulty identifying bioactive conformation | Flexible linkers, acyclic systems |
| Macrocyclic constraints | Exponential growth of conformer numbers | Macrocyclic peptides, natural products |
| Activity cliffs | Structurally similar compounds with large potency differences | Scaffold hops, bioisosteres |
| Entropic contributions | Inaccurate binding free energy predictions | Flexible inhibitors |
For example, as the size and flexibility of a macrocycle increases, the number of accessible conformers grows exponentially due to the increased degrees of freedom, making exhaustive conformational sampling both challenging and critical for accurate docking [19].
Protein Flexibility and Dynamics
Proteins are dynamic entities that undergo conformational changes upon ligand binding, described by induced-fit and conformational selection mechanisms [67] [68]. Traditional molecular docking often treats proteins as rigid structures, which fails to capture biologically relevant binding processes.
- Induced-fit mechanism: Ligand binding induces conformational changes in the protein [68]
- Conformational selection: Ligands selectively bind to pre-existing protein conformations from an ensemble of states [67]
- Cryptic pockets: Binding sites not visible in static structures that emerge during dynamics [69]
Recent advances, such as the DynamicBind method, employ geometric deep generative models to efficiently adjust protein conformation from initial AlphaFold predictions to holo-like states, handling large conformational changes like the DFG-in to DFG-out transition in kinases [69].
Computational Methodologies
Enhanced 3D-QSAR Approaches
Advanced 3D-QSAR methods incorporate flexibility through conformational ensemble generation and alignment. The Conformationally Sampled Pharmacophore (CSP) approach generates multiple low-energy conformations for each compound, developing QSAR models based on the assumption that the bioactive conformation is represented among these sampled structures [12].
Comparison of 3D-QSAR Methods for Handling Flexibility
| Method | Flexibility Handling | Statistical Foundation | Applicability Domain |
|---|---|---|---|
| CSP-SAR | Conformational ensemble generation | MLR, PCA, PLS | Diverse chemotypes |
| CoMFA | Aligned conformer fields | PLS analysis | Congeneric series |
| CoMSIA | Similarity indices fields | PLS analysis | Broader chemical space |
| Bayesian Regularized ANN | Non-linear relationships | Neural networks with regularization | Complex SAR landscapes |
These methods employ various statistical tools for model development and validation, including multivariable linear regression analysis (MLR), principal component analysis (PCA), and partial least square analysis (PLS) [12]. For non-linear relationships, Bayesian regularized artificial neural networks (BRANN) with a Laplacian prior can optimize descriptor selection and prevent overfitting [12].
Molecular Dynamics for Conformational Sampling
Molecular dynamics (MD) simulations provide a powerful approach for sampling the conformational landscape of both ligands and proteins, though they are computationally demanding [25]. The Relaxed Complex Method (RCM) addresses this by using representative target conformations from MD simulations for docking studies, effectively capturing receptor flexibility and identifying cryptic pockets [25].
Figure 1: Workflow of the Relaxed Complex Method for incorporating protein flexibility in docking.
Advanced Sampling and Deep Learning Methods
Accelerated molecular dynamics (aMD) enhances conformational sampling by adding a boost potential to smooth the system's potential energy surface, decreasing energy barriers and accelerating transitions between different low-energy states [25]. This approach enables more efficient exploration of biomolecular conformations relevant to drug binding.
Deep learning methods like DynamicBind represent recent innovations, using equivariant geometric diffusion networks to construct smooth energy landscapes that promote efficient transitions between biologically relevant states [69]. This method can recover ligand-specific conformations from unbound protein structures without requiring holo-structures or extensive sampling, demonstrating state-of-the-art performance in docking and virtual screening benchmarks [69].
Experimental Protocols
Protocol 1: Conformational Ensemble Generation for 3D-QSAR
Objective: Generate representative conformational ensembles for CSP-SAR analysis.
Materials:
- Compound set with known biological activities
- Computational chemistry software (OpenBabel, RDKit, or MOE)
- High-performance computing resources
Procedure:
- Structure Preparation
- Generate 3D structures from SMILES strings using RDKit's ETKDG algorithm [69]
- Apply molecular mechanics force fields (MMFF94 or GAFF) for initial minimization
Conformational Sampling
- Perform systematic or stochastic conformational search
- For each compound, generate a minimum of 50-100 conformers using RDKit [69]
- Apply energy window of 10-15 kcal/mol above global minimum
- Eliminate duplicates based on heavy atom RMSD threshold of 0.5 Å
Pharmacophore Feature Assignment
- Identify key pharmacophore features: H-bond donors, acceptors, hydrophobic regions, aromatic rings, charged groups
- Calculate molecular descriptors for each conformer
Model Development
- Align conformers using feature-based or shape-based methods
- Develop QSAR models using PLS regression or Bayesian regularized neural networks
- Validate models through leave-one-out cross-validation and external test sets
Validation: Assess model predictive power using cross-validated correlation coefficient (Q²) and external prediction accuracy [12].
Protocol 2: Protein Flexibility Integration via Ensemble Docking
Objective: Account for protein flexibility in virtual screening through ensemble docking.
Materials:
- Experimental or predicted protein structures (e.g., from AlphaFold)
- MD simulation software (AMBER, GROMACS, or NAMD)
- Docking program (AutoDock, GNINA, or DiffDock)
Procedure:
- Initial Structure Preparation
- Obtain protein structure from PDB or AlphaFold database [69]
- Add hydrogen atoms, assign protonation states, and optimize side-chain conformers
Molecular Dynamics Simulation
- Solvate the system in explicit water molecules using TIP3P water model
- Add counterions to neutralize system charge
- Energy minimize and equilibrate with position restraints on protein heavy atoms
- Run production MD for 100-500 ns depending on system size and flexibility
Trajectory Analysis and Clustering
- Extract snapshots at regular intervals (e.g., every 100 ps)
- Calculate RMSD of binding site residues and perform clustering
- Select representative structures from major clusters
Ensemble Docking
- Dock compound library to each representative protein structure
- Use consensus scoring to rank compounds
- Analyze binding poses across different protein conformations
Validation: Evaluate docking accuracy by measuring ligand RMSD to native pose (<2.0 Å considered successful) and enrichment factors in virtual screening [69].
Research Reagent Solutions
Table 2: Essential Computational Tools for Addressing Molecular Flexibility
| Tool Category | Specific Software/Resource | Application in Flexibility Studies |
|---|---|---|
| Molecular Dynamics | AMBER, GROMACS, NAMD | Sampling protein-ligand conformational space |
| Conformational Analysis | RDKit, OpenBabel, CONFLEX | Generating ligand conformational ensembles |
| Deep Learning | DynamicBind, DiffDock | Predicting complex structures with flexibility |
| Structure Prediction | AlphaFold2, RoseTTAFold | Providing initial protein structures |
| Docking Software | AutoDock, GNINA, GLIDE | Flexible ligand docking and scoring |
| Chemical Libraries | REAL Database, ZINC, ChEMBL | Sources of diverse compounds for screening |
Applications in Drug Discovery
The consideration of molecular flexibility has proven critical in multiple drug discovery campaigns. For 5-lipoxygenase (5-LOX) inhibitors, ligand-based approaches incorporating flexibility were essential before the crystal structure was solved, leading to the development of Zileuton for asthma treatment [20]. In kinase drug discovery, accounting for the DFG-loop flip between "in" and "out" states has enabled the design of selective Type II inhibitors that target specific conformational states [69].
The integration of ligand-based and structure-based approaches provides a powerful strategy for addressing flexibility challenges. Ligand-based pharmacophore models can guide docking and scoring in structure-based virtual screening, while ligand-based SAR data integrated with structural insights from co-crystal structures can optimize ligand-target interactions [13] [19].
Figure 2: Integration of ligand-based and structure-based approaches to address molecular flexibility.
Addressing molecular flexibility and conformational sampling remains essential for successful ligand-based drug design. By implementing the protocols and methodologies outlined in this application note, researchers can significantly improve the accuracy of their virtual screening and lead optimization efforts. The continuous advancement in computational methods, particularly through deep learning and enhanced sampling techniques, promises to further overcome current limitations and expand the scope of druggable targets in pharmaceutical research.
Ligand-Based Drug Design (LBDD) constitutes a foundational computational approach in modern drug discovery, employed particularly when the three-dimensional structure of the biological target is unknown or difficult to obtain. This methodology leverages knowledge from existing ligands—small molecules known to bind to the target of interest—to design and optimize new drug candidates. The core premise of LBDD is that structurally similar molecules often exhibit similar biological activities, enabling researchers to predict how novel compounds will interact with a target based on established ligand data [24]. LBDD is especially crucial for targeting membrane-associated proteins like G-protein coupled receptors (GPCRs), ion channels, and transporters, which represent over 50% of current FDA-approved drug targets but often lack experimentally determined 3D structures [1]. By comparing known active ligands, researchers can infer critical binding features and generate predictive models that guide the identification and optimization of new chemical entities with improved pharmacological profiles.
The LBDD toolbox encompasses several sophisticated computational techniques, including pharmacophore modeling, quantitative structure-activity relationships (QSAR), molecular similarity analysis, and machine learning approaches [13]. These methods facilitate the exploration of vast chemical spaces, predict key drug properties, and enable virtual screening of compound libraries, significantly accelerating the early stages of drug discovery. Recent advances in computational power, algorithms, and data availability have further enhanced the speed, accuracy, and scalability of LBDD methods, making them indispensable for reducing drug discovery timelines and increasing the likelihood of candidate success [70] [19]. This application note details standardized protocols for implementing LBDD workflows, from initial chemical space navigation to comprehensive lead profiling, providing researchers with practical frameworks to optimize their drug discovery pipelines.
Chemical Space Navigation and Virtual Screening
Chemical space represents the vast multidimensional collection of all possible organic compounds, estimated to exceed 10^60 molecules, presenting both unprecedented opportunities and significant challenges for drug discovery [13]. Navigating this expansive territory requires efficient computational strategies to identify regions enriched with compounds exhibiting desired biological activities and drug-like properties. Chemical space navigation focuses on systematically exploring these vast molecular landscapes to identify promising starting points for drug development, employing similarity-based and diversity-based approaches to select compounds with optimal characteristics for further investigation [71].
Virtual screening stands as a cornerstone application of chemical space navigation, leveraging computational methods to prioritize compounds from large libraries for experimental testing. Ligand-based virtual screening (LBVS) methodologies rely on the concept of molecular similarity, using 2D fingerprints, 3D shape descriptors, or pharmacophoric features to identify compounds similar to known active ligands [13] [19]. The underlying hypothesis—that structurally similar molecules share similar biological activities—enables the identification of novel hits even in the absence of target structural information. Advanced navigation platforms like infiniSee facilitate the screening of trillion-sized chemical spaces, employing various search modes including Scaffold Hopper for identifying novel chemotypes, Analog Hunter for locating similar compounds, and Motif Matcher for retrieving compounds containing specific molecular substructures [24].
Table 1: Chemical Space Navigation Approaches and Their Applications
| Navigation Approach | Key Features | Primary Applications | Tools/Implementations |
|---|---|---|---|
| Similarity Searching | 2D fingerprints, topological descriptors | Hit identification, lead hopping | Molecular fingerprint algorithms, Tanimoto coefficient |
| Shape-Based Screening | 3D molecular shape, volume overlap | Scaffold hopping, bioisosteric replacement | ROCS, FastROCS [14] |
| Pharmacophore Screening | 3D arrangement of chemical features | Virtual screening, binding hypothesis | HipHop, HypoGen, Catalyst |
| Diversity Sampling | Maximum dissimilarity, space coverage | Library design, expanding structural diversity | PCA, t-SNE visualization |
The success of LBVS depends critically on the molecular representations and similarity metrics employed. 2D methods, using molecular fingerprints or fragment descriptors, offer computational efficiency and are particularly effective for identifying close analogs of known actives [1]. In contrast, 3D methods consider molecular shape and the spatial arrangement of pharmacophoric features, enabling the identification of structurally diverse compounds that share similar binding characteristics—a process known as scaffold hopping [13] [14]. The Tanimoto coefficient remains the most widely used similarity metric for 2D fingerprint comparisons, while 3D shape similarity often employs measures of volume overlap and feature alignment [13]. Successful application of these methods has led to the discovery of novel bioactive compounds for various therapeutic targets, including kinase inhibitors, GPCR modulators, and antiviral agents [13].
Protocol: 3D Shape-Based Virtual Screening
Principle: This protocol employs 3D molecular shape and chemical feature similarity to identify potential hits from large compound libraries based on known active ligands. The method is particularly valuable for scaffold hopping, identifying structurally diverse compounds that maintain similar binding characteristics to known actives [14].
Materials:
- Query ligand with demonstrated biological activity
- Compound library for screening (e.g., commercial databases, in-house collections)
- Computational tools: OMEGA (conformer generation), ROCS (shape similarity), EON (electrostatic similarity) [14]
- Hardware: Multi-core processor with sufficient RAM for large dataset processing
Procedure:
- Query Preparation:
- Select a known high-affinity ligand with well-characterized activity
- Generate a conformational ensemble using OMEGA with default settings
- Select the bioactive conformation if known; otherwise, select the lowest energy conformation or a representative conformation from molecular dynamics simulations
Compound Library Preparation:
- Generate standardized molecular representations (canonical SMILES)
- Remove duplicates, inorganic compounds, and reactive molecules
- Generate multi-conformer representations for each compound using OMEGA
- Filter compounds based on drug-likeness criteria (e.g., Lipinski's Rule of Five)
Shape Similarity Screening:
- Execute ROCS with the query conformation against the prepared library
- Use Tanimoto Combo score (shape + color) as primary ranking metric
- Set appropriate cutoff values (typically >1.2 for promising hits)
- Retain top 1-5% of compounds for further analysis
Electrostatic Similarity Assessment:
- Submit top shape-similar compounds to EON for electrostatic comparison
- Use ET_Combo score to evaluate electrostatic complementarity
- Prioritize compounds with balanced shape and electrostatic similarity
Result Analysis and Hit Selection:
- Visualize molecular overlays of top hits with query ligand
- Assess chemical diversity among selected hits
- Apply additional filters (e.g., synthetic accessibility, patentability)
- Select 50-100 compounds for experimental validation
Troubleshooting Tips:
- If results lack chemical diversity, adjust similarity thresholds or employ scaffold hopping-specific tools
- If computational time is prohibitive, employ pre-filtering using 2D similarity or physicochemical properties
- For flexible query molecules, consider multiple query conformations to account for binding mode uncertainties
Pharmacophore Modeling and 3D-QSAR
Pharmacophore modeling represents a fundamental LBDD approach that abstracts the essential steric and electronic features responsible for molecular recognition and biological activity. A pharmacophore is defined as the spatial arrangement of molecular features necessary for binding to a target, including hydrogen bond donors/acceptors, hydrophobic regions, aromatic rings, charged groups, and exclusion volumes [12]. Pharmacophore models can be derived through two primary approaches: ligand-based models, generated from a set of known active compounds sharing a common biological target, and structure-based models, developed from analysis of ligand-target interactions in available crystal structures [13]. Integrated pharmacophore models combine information from both ligand and target structures to enhance model quality and predictive power, providing comprehensive representations of binding requirements.
The Conformationally Sampled Pharmacophore (CSP) approach addresses the critical challenge of conformational flexibility in pharmacophore modeling. This method generates multiple conformations for each ligand in a dataset and develops pharmacophore models based on this conformational ensemble, resulting in more robust and biologically relevant representations [12]. CSP-based SAR (CSP-SAR) has demonstrated superior performance compared to single-conformation methods, particularly for flexible ligands that can adopt multiple binding modes. The resulting models provide crucial insights into the nature of interactions between drug targets and ligand molecules, offering predictive capabilities suitable for lead compound optimization [12].
3D Quantitative Structure-Activity Relationship (3D-QSAR) methods extend traditional QSAR by incorporating three-dimensional molecular properties and alignments. Popular 3D-QSAR techniques like Comparative Molecular Field Analysis (CoMFA) and Comparative Molecular Similarity Indices Analysis (CoMSIA) calculate steric, electrostatic, and other field-based descriptors based on the 3D alignment of compounds [13]. These methods generate contour maps that visualize regions where specific molecular properties enhance or diminish biological activity, providing intuitive guidance for structural optimization. Recent advances in 3D-QSAR, particularly those grounded in causal, physics-based representations of molecular interactions, have improved their ability to predict activity even in the absence of structural data, often generalizing well across chemically diverse ligands for a given target [19] [72].
Protocol: CSP-SAR Model Development
Principle: The Conformationally Sampled Pharmacophore (CSP) approach generates robust pharmacophore models by considering multiple ligand conformations, addressing the challenge of conformational flexibility in ligand-based drug design [12] [1].
Materials:
- Set of 20-50 compounds with measured biological activity (preferably spanning 3-4 orders of magnitude in potency)
- Computational tools: Molecular mechanics software (for conformational sampling), CSP-SAR implementation, statistical analysis package
- Hardware: Workstation with multi-core processors and adequate memory for conformational analysis
Procedure:
- Data Set Curation:
- Collect compounds with consistent biological activity data (e.g., IC50, Ki)
- Ensure chemical diversity while maintaining common scaffold or pharmacophoric features
- Divide data set into training set (80%) and test set (20%) using rational selection (e.g., Kennard-Stone algorithm)
Conformational Sampling:
- Generate conformational ensemble for each compound using molecular dynamics or low-mode conformational search
- Apply energy window cutoff (typically 5-10 kcal/mol above global minimum)
- Ensure adequate sampling of torsional space for flexible molecules
Pharmacophore Feature Identification:
- Identify common chemical features across active compounds: hydrogen bond donors/acceptors, hydrophobic areas, aromatic rings, charged groups
- Define feature tolerances based on observed variations in active compounds
- Exclude features not common to majority of high-affinity ligands
Model Generation and Validation:
- Develop CSP-SAR models using multiple conformational representatives
- Apply statistical methods (genetic algorithm, PLS) to select optimal model
- Validate using leave-one-out cross-validation and external test set prediction
- Assess model robustness using y-randomization
Model Application and Visualization:
- Use validated model for virtual screening of compound libraries
- Generate 3D-QSAR contour maps to guide structural optimization
- Interpret contour maps to identify regions favoring/disadvantaging specific molecular properties
Troubleshooting Tips:
- If model statistics are poor, reconsider training set composition or feature definitions
- If model fails to predict test set compounds, check applicability domain and test set diversity
- For highly flexible molecules, increase conformational sampling parameters or use enhanced sampling techniques
Figure 1: CSP-SAR Model Development Workflow. This diagram illustrates the systematic workflow for developing conformationally sampled pharmacophore models, from initial data curation to application in virtual screening and lead optimization.
Machine Learning in Ligand-Based Design
Machine learning (ML) has revolutionized ligand-based drug design by enabling the development of sophisticated models that capture complex, non-linear relationships between molecular structures and biological activities. ML algorithms can learn from existing bioactivity data to predict properties of new compounds, significantly accelerating the virtual screening and optimization processes [13]. These approaches are particularly valuable when dealing with large, heterogeneous datasets common in modern drug discovery, where traditional statistical methods may struggle to capture intricate structure-activity relationships.
ML in LBDD encompasses both supervised learning algorithms (e.g., random forest, support vector machines) that learn from labeled data to predict compound properties, and unsupervised learning methods (e.g., clustering, dimensionality reduction) that uncover hidden patterns and relationships in unlabeled data [13]. Deep learning architectures, including convolutional neural networks and graph neural networks, have shown remarkable success in learning hierarchical representations directly from raw molecular data, enabling accurate predictions of biological activity and ADMET properties without relying on pre-defined molecular descriptors [13]. The application of Bayesian regularized artificial neural networks (BRANN) with Laplacian priors has further enhanced ML-based QSAR modeling by automatically optimizing network architecture and pruning ineffective descriptors, effectively addressing overfitting problems common in neural network applications [12].
Feature selection and model interpretation represent critical aspects of ML in LBDD. Techniques such as recursive feature elimination and L1 regularization help identify the most informative molecular descriptors, reducing model complexity and improving generalizability [13]. Model interpretation methods, including feature importance analysis and SHAP (SHapley Additive exPlanations) values, provide insights into the contributions of individual molecular features to model predictions, enhancing transparency and facilitating scientific understanding [13]. Interpretable ML models, such as decision trees and rule-based systems, offer greater explanatory power compared to black-box models, making them particularly valuable for guiding medicinal chemistry optimization efforts.
Table 2: Machine Learning Algorithms in Ligand-Based Drug Design
| Algorithm Category | Representative Methods | Advantages | Limitations | Typical Applications |
|---|---|---|---|---|
| Supervised Learning | Random Forest, SVM, Neural Networks | High predictive accuracy, handles non-linearity | Risk of overfitting, requires large datasets | QSAR modeling, activity prediction |
| Unsupervised Learning | k-means, PCA, t-SNE | No labeled data required, pattern discovery | Limited predictive capability | Chemical space analysis, clusterization |
| Deep Learning | CNNs, GNNs, Transformers | Automatic feature learning, high performance | Black-box nature, computational intensity | Property prediction, de novo design |
| Ensemble Methods | Bagging, Boosting, Stacking | Improved robustness, reduced variance | Computational cost, model complexity | Consensus modeling, virtual screening |
ADME and Toxicity Prediction
Prediction of ADME properties (Absorption, Distribution, Metabolism, and Excretion) represents a crucial application of LBDD, enabling early assessment of compound drug-likeness and potential pharmacokinetic profiles. Ligand-based QSAR models and machine learning algorithms can predict key physicochemical properties—including molecular weight, logP, polar surface area, hydrogen bond donors/acceptors, and rotatable bond count—that influence ADME behavior [13]. Compliance with established drug-likeness rules, such as Lipinski's Rule of Five and Veber's rules, provides initial filters to prioritize compounds with favorable ADME profiles, though lead optimization can sometimes successfully occur outside this conventional drug-like space for certain targets [73] [13].
Advanced LBDD approaches extend beyond simple rule-based filters to develop quantitative models for predicting specific pharmacokinetic parameters, including intestinal absorption, blood-brain barrier permeability, metabolic stability, and transporter interactions [13]. These models leverage molecular descriptors and machine learning algorithms trained on experimental data to provide quantitative estimates of ADME properties, enabling medicinal chemists to optimize drug exposure and therapeutic effect. Integration of pharmacokinetic predictions with pharmacodynamic data creates a comprehensive framework for balancing efficacy and ADME properties during lead optimization, reducing late-stage attrition due to poor pharmacokinetics [13].
Toxicity prediction represents another critical application of LBDD, addressing safety concerns early in the discovery process. Ligand-based approaches can identify structural alerts and toxicophores associated with specific toxicity endpoints, including genotoxicity, cardiotoxicity, hepatotoxicity, and phospholipidosis [13]. Machine learning models trained on large toxicity databases (e.g., Tox21, ToxCast) enable prediction of the likelihood that a compound will cause various types of toxicity based on its structural features [13]. Additionally, off-target profiling using ligand-based similarity searches can identify potential unintended targets, guiding the design of more selective compounds with reduced risk of adverse effects. These predictive approaches complement experimental safety assessment, enabling earlier identification and mitigation of potential toxicity issues.
Protocol: Multi-Parameter Optimization Workflow
Principle: This protocol integrates predictions of multiple pharmacological, pharmacokinetic, and toxicity endpoints to prioritize lead compounds with balanced efficacy, ADME, and safety profiles [13] [19].
Materials:
- Compound series with measured or predicted potency against primary target
- Computational tools: ADMET prediction software, similarity searching tools, multi-parameter optimization platform
- Property data: Experimental or predicted values for key ADMET endpoints
Procedure:
- Property Calculation:
- Calculate physicochemical properties (MW, logP, TPSA, HBD, HBA)
- Predict ADME parameters (Caco-2 permeability, metabolic stability, plasma protein binding)
- Estimate toxicity endpoints (hERG inhibition, mutagenicity, hepatotoxicity)
Drug-Likeness Assessment:
- Apply Rule of Five and other drug-likeness filters
- Identify potential liabilities (e.g., reactive groups, pan-assay interference compounds)
- Assess overall developability based on multiple parameters
Multi-Parameter Optimization:
- Define acceptable ranges for each parameter based on target product profile
- Apply desirability functions to balance multiple properties
- Use Pareto optimization to identify compounds with optimal trade-offs
Selectivity Assessment:
- Perform similarity searches against known ligands of anti-targets
- Predict off-target binding using machine learning models
- Prioritize compounds with clean selectivity profiles
Compound Prioritization:
- Generate overall ranking based on weighted sum of properties
- Visualize results in multi-dimensional property space
- Select 5-10 top candidates for progression
Troubleshooting Tips:
- If no compounds meet all criteria, adjust acceptable ranges or prioritize critical parameters
- If predictions conflict with experimental data, recalibrate models with relevant data
- For challenging targets requiring non-drug-like space, focus on critical parameters only
Figure 2: ADME and Toxicity Prediction Workflow. This diagram illustrates the integrated approach for predicting and optimizing multiple ADME and toxicity parameters during lead profiling, culminating in compound prioritization based on balanced properties.
Integrated Lead Profiling Framework
Integrated lead profiling combines multiple LBDD approaches with experimental data to comprehensively characterize compound series and select optimal candidates for further development. This framework encompasses assessment of potency, selectivity, ADME properties, and developability to build a complete profile of lead compounds [13] [19]. By integrating data from various sources and predictions, researchers can make informed decisions about compound prioritization, identify potential liabilities early, and design molecules with improved chances of success in later development stages.
A critical aspect of lead profiling involves addressing activity cliffs—pairs of structurally similar compounds with large differences in biological activity—which pose significant challenges for QSAR modeling and similarity-based approaches [13]. Activity landscape analysis visualizes the structure-activity relationships of a compound series and identifies regions of continuous and discontinuous SAR, guiding optimization efforts toward regions of chemical space with favorable properties [13]. Understanding these landscapes helps medicinal chemists navigate trade-offs between structural modifications and activity changes, enabling more efficient optimization cycles.
Handling conformational flexibility remains essential throughout lead profiling, as different conformations of both ligands and targets may have distinct biological implications [13] [1]. Conformational sampling techniques, including molecular dynamics and low-mode conformational search, generate ensemble representations of ligands for pharmacophore modeling and 3D-QSAR, improving the robustness of predictions [13]. Consensus approaches that consider multiple conformations enhance model reliability and help account for the dynamic nature of molecular recognition, ultimately leading to more accurate predictions of compound behavior in biological systems.
Research Reagent Solutions
Table 3: Essential Tools and Software for Ligand-Based Drug Design
| Tool Category | Representative Solutions | Key Functionality | Application in Workflow |
|---|---|---|---|
| Chemical Space Navigation | infiniSee (BioSolveIT) | Screening of trillion-sized chemical spaces | Hit identification, lead hopping [24] |
| Conformer Generation | OMEGA (OpenEye) | Rapid and accurate 3D conformer generation | Pharmacophore modeling, 3D-QSAR [14] |
| Shape Similarity | ROCS, FastROCS (OpenEye) | 3D shape and chemical feature similarity | Virtual screening, scaffold hopping [14] |
| Electrostatic Comparison | EON (OpenEye) | Electrostatic similarity calculations | Lead-hopping, optimization [14] |
| QSAR Modeling | Various (KNIME, MATLAB, R) | Quantitative structure-activity relationship modeling | Activity prediction, lead optimization [70] [12] |
| Workflow Platforms | KNIME Analytics Platform | Data pipelining and integration | Workflow automation, model deployment [70] |
| Scaffold Hopping | Scaffold Hopper (BioSolveIT) | Identification of novel chemotypes | Structural diversification, IP expansion [24] |
Validating LBDD and Its Synergy with Structure-Based Methods
Modern drug discovery relies heavily on two computational pillars: structure-based drug design (SBDD) and ligand-based drug design (LBDD) [74]. These methodologies provide complementary pathways for identifying and optimizing potential therapeutic compounds. SBDD utilizes the three-dimensional structure of a biological target, typically a protein, to guide the design of molecules that fit precisely into its binding site [75] [76]. Conversely, LBDD is employed when the target structure is unknown; it deduces the requirements for effective binding by analyzing known active molecules (ligands) that interact with the target [12] [77]. The choice between these approaches is often dictated by the availability of structural or ligand information, and a growing trend involves their integration to leverage the strengths of both [19]. This analysis details the core principles, strengths, limitations, and practical applications of each method, providing a framework for their use in pharmaceutical research.
Core Principles and Methodologies
Structure-Based Drug Design (SBDD)
SBDD is a direct approach that requires knowledge of the three-dimensional structure of the target protein, obtained through experimental methods like X-ray crystallography or cryo-electron microscopy, or via computational prediction tools like AlphaFold or homology modeling [19] [76]. The process fundamentally relies on studying the ligand binding pocket—a cavity on the protein where a drug molecule can bind and exert its effect [76]. The primary goal is to design a molecule that forms favorable interactions (e.g., hydrogen bonds, hydrophobic contacts) with the amino acids lining this pocket, thereby achieving high affinity and specificity [74] [76].
A core technique in SBDD is molecular docking, which computationally predicts how a small molecule (ligand) binds to the protein target. Docking programs score and rank different binding poses based on the complementarity between the ligand and the binding pocket [19]. For more precise affinity predictions, computationally intensive methods like free-energy perturbation (FEP) are used, typically during lead optimization to evaluate the impact of small chemical modifications [19]. Virtual screening is another key application, where vast libraries of compounds are docked into the target structure to identify novel hit molecules [78] [76].
Ligand-Based Drug Design (LBDD)
LBDD is an indirect approach used when the 3D structure of the target is unavailable [12] [77]. Instead of starting from the protein, it begins with a set of known active ligands. The foundational principle is the "chemical similarity principle," which states that structurally similar molecules are likely to have similar biological activities [77].
The most common LBDD techniques include:
- Similarity-based virtual screening: This involves searching large compound libraries for molecules that are structurally similar to known active compounds, using 2D fingerprints or 3D shape and electrostatic comparisons [19] [77].
- Quantitative Structure-Activity Relationship (QSAR) modeling: This statistical or machine learning method relates quantitative descriptors of a molecule's structure to its biological activity, creating a predictive model that can guide the optimization of lead compounds [12] [19].
- Pharmacophore modeling: This technique identifies the essential steric and electronic features necessary for a molecule to interact with its target, creating a abstract model that can be used for database screening [12].
Comparative Analysis: Strengths and Limitations
The following tables summarize the core strengths and limitations of SBDD and LBDD, providing a clear comparison for researchers deciding on an appropriate strategy.
Table 1: Core Strengths and Data Requirements of SBDD and LBDD
| Aspect | Structure-Based Drug Design (SBDD) | Ligand-Based Drug Design (LBDD) |
|---|---|---|
| Primary Requirement | 3D structure of the target protein [74] [19] | Set of known active ligands [12] [77] |
| Key Strength | Provides atomic-level insight into binding interactions; enables rational, target-guided design [75] [76] | Fast, scalable, and applicable to targets with unknown structure; excels at scaffold hopping [12] [77] |
| Rational Design | Directly enables rational design based on the target's binding site geometry [19] | Infers design rules indirectly from ligand structure-activity relationships [12] |
| Handling Novel Targets | Highly effective if a high-quality structure is available [76] | The only computational option when no structural data exists [12] |
Table 2: Practical Limitations and Challenges of SBDD and LBDD
| Aspect | Structure-Based Drug Design (SBDD) | Ligand-Based Drug Design (LBDD) |
|---|---|---|
| Primary Limitation | Completely dependent on the availability and accuracy of the target structure [19] | Cannot provide direct information about the target or the binding mode [12] |
| Data Dependency | Risk of inaccurate results from low-quality or static protein structures [19] | Models are biased towards known chemical space; struggles with novel scaffolds [12] [19] |
| Computational Cost | Docking large libraries is resource-intensive; FEP is limited to small compound sets [19] | Generally faster and less computationally demanding than SBDD [77] |
| Scope of Prediction | Can predict the binding pose and affinity of entirely novel chemotypes [19] | Limited to making predictions within or near the known chemical space of the training set [12] |
Integrated Workflows and Protocols
Given their complementary nature, integrating SBDD and LBDD can create a more powerful and efficient drug discovery pipeline [19]. A typical hybrid protocol might proceed as follows.
Combined Virtual Screening Protocol
Objective: To identify novel hit compounds for a protein target where some active ligands are known, but a medium-resolution crystal structure is also available.
Step-by-Step Workflow:
Ligand-Based Pre-screening:
- Take a set of known active compounds for the target.
- Perform a similarity-based virtual screen of a large commercial or corporate compound library (e.g., 1-10 million compounds) using 2D fingerprints or 3D shape similarity [19] [77].
- Goal: Rapidly reduce the size of the library from millions to a few thousand candidates. This step enriches the dataset for molecules that are likely active and can also identify chemically diverse scaffolds ("scaffold hopping") [19].
Structure-Based Prioritization:
- Take the top ~10,000 - 50,000 compounds from the ligand-based screen.
- Perform molecular docking of these compounds into the binding site of the target protein.
- Analyze the predicted binding poses of the top-ranking compounds. Prioritize those that form key interactions with the protein (e.g., hydrogen bonds with catalytic residues, optimal hydrophobic contacts) [19].
Consensus Scoring and Hit Selection:
- Apply a consensus scoring strategy. For example, multiply the rank from the ligand-based screen with the rank from the docking screen to create a unified score [19].
- Select 100-500 compounds for experimental testing that are ranked highly by both methods, as this increases confidence in their potential activity.
The workflow for this integrated screening approach is summarized in the following diagram:
Lead Optimization Protocol
Objective: To improve the potency and drug-like properties of a confirmed hit compound (now a "lead" compound).
Step-by-Step Workflow:
Structure-Based Analysis:
- If possible, obtain a co-crystal structure of the lead compound bound to the target protein. This provides an unambiguous starting point for design.
- Use molecular docking and visual inspection to propose specific chemical modifications that could enhance interactions (e.g., adding a hydrogen bond donor, extending into a hydrophobic sub-pocket) [19].
Ligand-Based Analysis:
- Generate a 3D-QSAR model using a series of analogs of the lead compound with known activity data [12].
- Use the model to predict the activity of proposed new analogs before synthesis. The QSAR model can capture complex, non-linear effects that are difficult to deduce from structure alone.
Design-Make-Test-Analyze Cycle:
- Synthesize a small set of ~20-50 compounds designed using the above insights.
- Test the compounds for biological activity and other properties (e.g., solubility, metabolic stability).
- Use the new experimental data to refine the SBDD and LBDD models, and begin the next cycle of optimization.
The Scientist's Toolkit: Essential Research Reagents and Materials
Successful execution of SBDD and LBDD relies on a suite of computational and experimental tools. The table below lists key resources and their applications.
Table 3: Essential Reagents and Tools for SBDD and LBDD Research
| Category | Tool/Reagent | Function and Application |
|---|---|---|
| SBDD Software | AutoDock, Schrödinger Suite, GROMACS | Performs molecular docking, molecular dynamics simulations, and binding free energy calculations (e.g., FEP) to predict and analyze protein-ligand interactions [75] [19]. |
| LBDD Software | Various QSAR/ML packages, Similarity search algorithms (e.g., Tanimoto index) | Builds predictive QSAR models and performs rapid 2D/3D similarity searches of compound databases to identify new active molecules [12] [77]. |
| Protein Structures | Protein Data Bank (PDB), AlphaFold Protein Structure Database | Provides experimentally determined and AI-predicted 3D protein structures for use as direct targets or templates for homology modeling in SBDD [19] [76]. |
| Compound Libraries | Commercial HTS libraries (e.g., Enamine), Corporate compound collections | Provides large, diverse sets of small molecules for virtual and high-throughput screening campaigns [78]. |
| Bioactivity Databases | ChEMBL, PubChem, BindingDB | Provides curated bioactivity data for known ligands, essential for training QSAR models and performing ligand-based target prediction [77]. |
SBDD and LBDD are not mutually exclusive but rather complementary strategies in the modern drug discovery toolkit. SBDD offers unparalleled insight into the physical basis of molecular recognition, enabling rational design, while LBDD provides a powerful and efficient path forward when structural information is lacking [74] [19]. The choice between them is pragmatic, dictated by the available data for a given target. However, the most effective discovery campaigns increasingly leverage both approaches in an integrated manner [19]. By using LBDD to rapidly focus chemical space and SBDD to provide detailed structural guidance, researchers can accelerate the identification and optimization of novel therapeutic agents with higher efficiency and improved prospects for success.
Ligand-based drug design (LBDD) is a powerful computational approach used when the three-dimensional structure of the biological target is unknown or unavailable [1] [11]. This methodology relies on analyzing known active molecules (ligands) to infer the structural and physicochemical properties necessary for biological activity, enabling the design and optimization of new drug candidates [79] [80]. By leveraging techniques such as Quantitative Structure-Activity Relationship (QSAR) analysis and pharmacophore modeling, researchers can develop predictive models that guide the discovery of novel compounds with improved efficacy, selectivity, and safety profiles [1] [81]. This application note details successful implementations of LBDD, providing detailed methodologies and key reagent solutions to aid researchers in deploying these strategies.
Case Studies in LBDD
5-Lipoxygenase (5-LOX) Inhibitors
Background and Challenge Arachidonate 5-lipoxygenase (5-LOX) is an iron-containing enzyme involved in inflammatory processes, making it a attractive target for anti-inflammatory therapeutics. The challenge was to design novel inhibitors with improved affinity and selectivity based on a known lead compound, 5-hydroxyindole-3-carboxylate [11].
LBDD Approach and Experimental Protocol Researchers employed advanced 3D-QSAR techniques to analyze and design new derivatives.
- Step 1: Data Set Curation - A series of 5-hydroxyindole-3-carboxylate derivatives with known inhibitory activities (IC₅₀ values) was compiled.
- Step 2: Molecular Modeling and Alignment - Low-energy conformations of all compounds were generated using molecular mechanics force fields. The compounds were then spatially aligned to a template molecule based on their common structural framework [1] [81].
- Step 3: 3D-QSAR Model Generation - Comparative Molecular Field Analysis (CoMFA) and Comparative Molecular Similarity Indices Analysis (CoMSIA) were performed. These methods calculate steric, electrostatic, hydrophobic, and hydrogen-bonding fields around the aligned molecules [11].
- Step 4: Model Validation - The statistical robustness and predictive ability of the generated 3D-QSAR models were assessed using leave-one-out cross-validation and an external test set of compounds not included in model building [1].
- Step 5: Design and Prediction - The validated models were used to predict the inhibitory activity of newly designed virtual compounds, guiding the synthesis of the most promising candidates [11].
Outcome The LBDD-driven design resulted in a series of novel 5-hydroxyindole-3-carboxylate derivatives featuring two strategic structural substitutions. These compounds showed predicted IC₅₀ values in the nanomolar range, indicating significantly improved potency compared to the original lead compound [11].
Selective Cyclooxygenase-2 (COX-2) Inhibitors
Background and Challenge The goal was to develop non-steroidal anti-inflammatory drugs (NSAIDs) that selectively inhibit the COX-2 enzyme to reduce inflammation without the gastrointestinal side effects associated with non-selective COX-1/COX-2 inhibition [80].
LBDD Approach and Experimental Protocol The strategy combined pharmacophore modeling and QSAR analysis based on known active ligands.
- Step 1: Pharmacophore Model Development - A set of known COX-2 inhibitors was used to generate a common feature pharmacophore model. This model identified essential structural features such as hydrogen bond acceptors, hydrophobic regions, and aromatic rings [81].
- Step 2: Virtual Screening - The pharmacophore model was used as a 3D query to screen large chemical databases and identify compounds that matched the essential feature arrangement [24].
- Step 3: Similarity Searching and Scaffold Hopping - Tools like Scaffold Hopper and Analog Hunter were used to find novel chemical scaffolds that maintained the core functional features of known active compounds, thereby exploring new chemical space while retaining biological activity [24].
- Step 4: Potency and Selectivity Optimization - QSAR models were built to quantitatively predict the COX-2 inhibitory activity and selectivity over COX-1, guiding the chemical modification of hit compounds [80].
Outcome This ligand-based approach led to the design of novel selective COX-2 inhibitors with significant anti-inflammatory activity and a potentially improved gastrointestinal safety profile. These candidates have progressed to clinical evaluation [80].
Key Quantitative Data
The following table summarizes the quantitative outcomes from the featured LBDD case studies.
Table 1: Quantitative Outcomes from LBDD Case Studies
| Case Study | Lead Compound | LBDD Technique | Key Outcome | Reported/ Predicted IC₅₀ |
|---|---|---|---|---|
| 5-LOX Inhibitors | 5-hydroxyindole-3-carboxylate | CoMFA & CoMSIA | Novel derivatives with two structural substitutions designed and synthesized | Improved potency (nanomolar range) [11] |
| Selective COX-2 Inhibitors | Known COX-2 inhibitors | Pharmacophore Modeling & QSAR | Novel inhibitors with high selectivity and reduced GI toxicity | Significant anti-inflammatory activity [80] |
Experimental Workflow and Visualization
The general workflow for a successful LBDD project, as demonstrated in the case studies, involves a cyclical process of design, prediction, and testing. The following diagram illustrates this iterative workflow, from initial data collection to final experimental validation.
The Scientist's Toolkit: Essential Research Reagents and Solutions
Successful implementation of LBDD relies on a combination of computational tools and experimental reagents. The following table lists key solutions used in the featured studies and their applications.
Table 2: Key Research Reagent Solutions for LBDD
| Tool/Reagent | Function in LBDD | Application in Case Studies |
|---|---|---|
| Molecular Modeling Suite | Generates low-energy 3D conformations and aligns molecules for analysis. | Used for conformational sampling and alignment in 5-LOX inhibitor development [1] [11]. |
| 3D-QSAR Software | Performs CoMFA and CoMSIA to build predictive models linking molecular fields to biological activity. | Core technique for building predictive models and designing novel 5-LOX inhibitors [11]. |
| Pharmacophore Modeling Platform | Identifies and models the essential 3D features responsible for biological activity. | Used to create queries for virtual screening of COX-2 inhibitors [81] [24]. |
| Virtual Screening Database | A large collection of available or virtual compounds for screening against pharmacophore or similarity models. | Mined for novel chemical scaffolds in the COX-2 inhibitor project [24]. |
| Chemical Synthesis Reagents | Laboratory reagents for the organic synthesis of designed lead compounds. | Essential for synthesizing the proposed 5-LOX and COX-2 inhibitors for biological testing [11]. |
| In vitro Activity Assay Kit | Measures the biological activity (e.g., IC₅₀) of synthesized compounds against the target. | Used for experimental validation of inhibitory activity in both case studies [80] [11]. |
The documented success stories of 5-LOX and selective COX-2 inhibitors underscore the significant impact of Land-based drug design in modern medicinal chemistry. By systematically applying proven LBDD methodologies—such as 3D-QSAR and pharmacophore modeling—researchers can efficiently navigate chemical space and accelerate the discovery of novel therapeutic agents. The provided experimental protocols and toolkit offer a practical framework for scientists to implement these powerful approaches in their own drug discovery pipelines, particularly for targets lacking structural information.
The drug discovery pipeline increasingly relies on computational virtual screening (VS) to identify and optimize lead compounds from vast chemical libraries. VS methodologies are broadly classified into two categories: ligand-based (LB) and structure-based (SB) techniques. LB methods utilize the structural and physicochemical information of known active ligands to infer activity in new compounds, while SB methods leverage the three-dimensional structure of the biological target to predict ligand binding [23] [12]. While each approach has proven successful, their complementary nature has spurred the development of integrated strategies that combine LB and SB techniques into a holistic framework. These hybrid strategies synergistically exploit all available information on both the ligand and the target, mitigating the individual limitations of each method and significantly enhancing the probability of success in drug discovery campaigns [23] [72] [19]. This article details the three primary integration schemes—sequential, parallel, and hybrid—providing application notes and detailed protocols for their implementation in a research setting.
Core Concepts of Ligand-Based and Structure-Based Methods
Ligand-Based Drug Design (LBDD)
LBDD is applied when the 3D structure of the target is unavailable. It operates on the molecular similarity principle, which posits that structurally similar molecules are likely to exhibit similar biological activities [23] [12].
- Key Techniques:
- Similarity Searching: Compounds from large libraries are compared against known active molecules using 2D molecular fingerprints or 3D descriptors (e.g., shape, electrostatic properties) [19].
- Quantitative Structure-Activity Relationship (QSAR) Modeling: This approach uses statistical or machine learning methods to build a quantitative model that relates molecular descriptors (physicochemical properties, structural patterns) to biological activity [12] [19]. Recent advances in 3D QSAR, grounded in physics-based representations, have improved predictive accuracy even with limited data [19].
- Pharmacophore Modeling: A pharmacophore model abstracts the essential steric and electronic features necessary for molecular recognition at a target binding site [12].
Structure-Based Drug Design (SBDD)
SBDD is employed when a 3D structure of the target (from X-ray crystallography, Cryo-EM, or computational prediction tools like AlphaFold) is available [25] [19].
- Key Techniques:
- Molecular Docking: This method predicts the preferred orientation (pose) of a small molecule within a target's binding site and scores it based on interaction energy. Docking algorithms perform a conformational search (systematic or stochastic) to explore possible binding modes [82].
- Free Energy Perturbation (FEP): A computationally intensive but highly accurate method for estimating relative binding free energies. It is particularly valuable during lead optimization for quantitatively evaluating the impact of small chemical modifications on binding affinity [83].
- Molecular Dynamics (MD) Simulations: MD accounts for the inherent flexibility of the target and ligand, simulating their dynamic behavior over time. The Relaxed Complex Method uses representative target conformations from MD simulations for docking, which can reveal cryptic binding pockets not apparent in static crystal structures [25].
Table 1: Strengths and Limitations of Core Methodologies
| Methodology | Key Strengths | Inherent Limitations |
|---|---|---|
| Ligand-Based (LBDD) | Fast, scalable; applicable without target structure; excels at pattern recognition and scaffold hopping [72] [19]. | Bias towards the training set's chemical space; cannot directly model protein-ligand interactions [23]. |
| Structure-Based (SBDD) | Provides atomic-level interaction details; enables rational, target-guided design [72] [19]. | Dependent on the availability and quality of the target structure; high computational cost; challenges with protein flexibility [23] [25]. |
Integrated LB+SB Strategic Frameworks
The integration of LB and SB methods can be systematically categorized into three main strategies, each with distinct workflows and advantages [23].
Sequential Strategy
The sequential approach divides the virtual screening pipeline into consecutive filtering steps. It typically begins with a fast, computationally inexpensive LB method to narrow down a large chemical library, followed by a more rigorous and resource-intensive SB analysis on the pre-filtered subset [23] [72] [19].
- Rationale: This strategy optimizes the trade-off between computational cost and predictive accuracy. By applying the most demanding methods only to a shortlist of promising candidates, it significantly improves overall efficiency [23].
- Workflow:
- LB Pre-filtering: A large compound library is screened using 2D/3D similarity searches or a QSAR model to select a subset of compounds that resemble known actives.
- SB Analysis: The filtered subset undergoes molecular docking against the target structure to predict binding poses and affinities.
- Hit Selection: The top-ranked compounds from docking are selected for experimental testing.
Parallel Strategy
In the parallel approach, LB and SB methods are run independently on the same compound library. The results from each stream—typically ranked lists of compounds—are then combined in a consensus framework to produce a final selection [23] [19].
- Rationale: This strategy mitigates the risk of missing true active compounds due to the inherent limitations of any single method. It increases robustness and hit rates by leveraging the complementary strengths of both approaches [19].
- Workflow:
- Independent Screening: The same compound library is screened simultaneously by an LB method (e.g., similarity search) and an SB method (e.g., molecular docking).
- Rank Combination: The results are combined using one of two primary methods:
- Consensus Selection: The top n% of compounds from each ranking list are selected, resulting in a broad candidate set [19].
- Hybrid Scoring: The ranks or scores from each method are multiplied to generate a unified ranking, which prioritizes compounds that are highly ranked by both techniques, thereby increasing confidence in the selection [72] [19].
Hybrid Strategy
Hybrid strategies represent the most integrated approach, where LB and SB information are combined within a single, unified computational model or workflow, rather than being applied in separate steps [23].
- Rationale: This strategy aims to create a holistic model that simultaneously accounts for ligand similarity, 3D target structure, and their interplay, potentially leading to more accurate and insightful predictions.
- Workflow: This can involve several sophisticated techniques:
Table 2: Comparison of Integrated LB+SB Strategies
| Strategy | Key Principle | Advantages | Ideal Use Case |
|---|---|---|---|
| Sequential | Consecutive filtering: LB first, then SB. | Highly efficient use of computational resources; practical for ultra-large libraries [72]. | Initial screening of massive (billion-compound) libraries when resources are limited. |
| Parallel | Independent LB and SB runs with consensus results. | Reduces false negatives; robust against failures of one method; improves hit rates [23] [19]. | Projects with sufficient compute resources aiming for high-confidence, diverse hits. |
| Hybrid | Deep integration of LB and SB data into a single model. | Leverages all available data simultaneously; can provide superior predictive power and novel insights. | Projects with rich data on both ligands and target structure for lead optimization. |
Detailed Experimental Protocols
Protocol 1: Sequential Virtual Screening for Hit Identification
This protocol is designed to efficiently identify hit compounds from an ultra-large virtual library [23] [19] [84].
1. Compound Library Preparation
- Input: Commercially available or in-house virtual compound library (e.g., in SDF or SMILES format).
- Procedure: Standardize chemical structures, generate plausible tautomers and protonation states at physiological pH (e.g., using MOE or OpenBabel). Convert the final library into a suitable format for screening (e.g., PDBQT for AutoDock Vina) [84].
2. Ligand-Based Pre-filtering
- Objective: Reduce library size from billions to thousands of compounds.
- Method:
- Similarity Search: Calculate 2D Tanimoto similarity or 3D shape/electrostatic similarity against one or multiple known active reference ligands (e.g., using ECFP4 fingerprints or ROCS software).
- QSAR Prediction: Apply a pre-validated QSAR model to predict activity and select compounds above a defined activity threshold.
- Output: A subset of 10,000 - 50,000 compounds with high similarity or predicted activity.
3. Structure-Based Virtual Screening
- Objective: Predict binding mode and affinity of the filtered compounds.
- Method:
- Target Preparation: Obtain the 3D structure of the target (PDB file). Add hydrogen atoms, assign protonation states, and optimize hydrogen bonding networks (e.g., using Protein Preparation Wizard in Schrödinger).
- Binding Site Definition: Define the docking grid centered on the known binding site.
- Molecular Docking: Dock the pre-filtered compound subset using a program like AutoDock Vina or Glide. Use standard docking parameters, allowing for ligand flexibility.
- Output: A ranked list of compounds based on docking score.
4. Hit Selection and Analysis
- Procedure: Visually inspect the top 100-500 ranked compounds to verify plausible binding interactions and chemical integrity. Select 20-50 top-ranking and chemically diverse compounds for experimental validation.
Protocol 2: Machine Learning-Enhanced Screening for Lead Optimization
This protocol uses machine learning to refine hits from a virtual screen, as demonstrated in a study identifying natural inhibitors of αβIII tubulin [84].
1. Data Set Curation
- Training Set:
- Active Compounds: Collect known active compounds for the target (e.g., Taxol-site binders for tubulin).
- Inactive/Decoy Compounds: Generate decoy molecules with similar physicochemical properties but distinct 2D topology using the DUD-E server [84].
- Test Set: The top 1,000 compounds identified from an initial structure-based virtual screening based on binding energy.
2. Molecular Descriptor Calculation
- Software: Use PaDEL-Descriptor software [84].
- Input: SMILES codes of all compounds in the training and test sets.
- Procedure: Calculate 1D, 2D, and 3D molecular descriptors and fingerprints (e.g., 797 descriptors and 10 fingerprint types).
3. Machine Learning Model Training and Validation
- Algorithm Selection: Employ supervised classification algorithms such as Random Forest, Support Vector Machine, or Bayesian regularized neural networks.
- Training: Train the model using the training set descriptors as features and activity (active/inactive) as the label.
- Validation: Perform 5-fold cross-validation. Evaluate model performance using metrics like Accuracy, Precision, Recall, F-score, and AUC (Area Under Curve) [84].
4. Prediction and Experimental Validation
- Procedure: Use the trained model to predict the activity of the test set compounds (the 1,000 virtual screening hits).
- Output: A classified list of "active" and "inactive" compounds. The predicted actives (e.g., 20 compounds) are then subjected to further analysis (ADMET, molecular dynamics) and experimental testing.
The Scientist's Toolkit: Essential Research Reagents & Solutions
Table 3: Key Computational Tools for Integrated LB+SB Strategies
| Tool / Resource | Type | Primary Function in Research |
|---|---|---|
| ZINC/REAL Database | Compound Library | Provides access to commercially available and on-demand synthesizable compounds for virtual screening [25]. |
| AlphaFold Database | Structure Resource | Offers predicted protein structures for targets without experimental 3D structures, expanding the domain of SBDD [25]. |
| AutoDock Vina/Glide | Docking Software | Performs molecular docking to predict ligand-binding poses and scores binding affinity [84] [82]. |
| PaDEL-Descriptor | Descriptor Calculator | Generates molecular fingerprints and descriptors from chemical structures for QSAR and machine learning [84]. |
| Desmond (MD) | Simulation Software | Runs molecular dynamics simulations to study protein-ligand complex stability, flexibility, and cryptic pockets [25] [83]. |
| FEP+ | Free Energy Calculator | Accurately calculates relative binding free energies for congeneric ligand series during lead optimization [83]. |
| Python/R with scikit-learn | ML/Statistics Platform | Provides environment for building, validating, and applying QSAR and machine learning models [12] [84]. |
The integration of ligand-based and structure-based methods represents a powerful paradigm in modern computational drug discovery. The sequential, parallel, and hybrid strategies offer flexible frameworks that can be tailored to the specific data, resources, and objectives of a project. By leveraging the complementary strengths of LB and SB approaches, researchers can achieve more efficient virtual screening, more accurate activity predictions, and ultimately, a higher likelihood of identifying novel and potent lead compounds. As computational power, algorithms, and data availability continue to advance, these integrated strategies are poised to become even more central to successful drug discovery campaigns.
In the field of computer-aided drug design (CADD), virtual screening serves as a cornerstone for identifying potential hit compounds from vast chemical libraries [51]. While ligand-based drug design (LBDD) offers powerful tools for this purpose, relying solely on a single methodological approach often yields suboptimal results due to the inherent limitations of each technique [19]. LBDD is an indirect approach that facilitates the development of pharmacologically active compounds by studying molecules known to interact with the biological target of interest [12]. This approach is particularly valuable when the three-dimensional structure of the target is unavailable [19].
The integration of multiple LBDD strategies, and their combination with structure-based methods when possible, creates a synergistic effect that significantly enhances virtual screening outcomes [19]. This protocol details established methodologies for combining computational approaches to improve the efficiency and success rates of virtual screening campaigns, with particular emphasis on workflows accessible within a ligand-based framework.
Combined Workflow Protocol for Virtual Screening
The following section outlines a standardized protocol for implementing a combined virtual screening workflow. This integrated approach leverages the strengths of multiple computational techniques to improve the identification of valid hit compounds.
Protocol: Sequential Integration of Virtual Screening Methods
Objective: To efficiently identify novel bioactive compounds by sequentially applying ligand-based and, where feasible, structure-based screening methods to reduce resource expenditure and focus computational efforts on the most promising candidates [19].
Materials:
- A computer system with adequate processing power and memory
- Virtual screening software capable of QSAR modeling, pharmacophore modeling, and molecular docking (e.g., AutoDock, Schrödinger Suite, MOE)
- Chemical database files in appropriate formats (e.g., SDF, MOL2)
- Known active compounds for reference (if available)
Procedure:
Initial Library Preparation and Curation
- Obtain a commercial or proprietary compound library for screening.
- Perform chemical standardization: neutralize charges, generate canonical tautomers, and remove duplicates.
- Apply pre-processing filters to remove compounds with undesirable properties (e.g., poor drug-likeness based on Lipinski's Rule of Five, reactive functional groups, or toxicophores).
- Output: A curated, standardized chemical library ready for screening.
Ligand-Based Virtual Screening (Primary Filter)
- Input: The curated chemical library from Step 1.
- Method 1: Quantitative Structure-Activity Relationship (QSAR) Modeling
- If a set of compounds with known biological activity is available, develop a 2D or 3D QSAR model [12] [19].
- Use molecular descriptors (e.g., physicochemical properties, 2D fingerprints, 3D shape descriptors) as independent variables and biological activity as the dependent variable [12].
- Apply statistical or machine learning methods (e.g., PLS, neural networks) to build a predictive model [12].
- Use the model to predict the activity of compounds in the screening library and rank them accordingly.
- Method 2: Pharmacophore Modeling
- Develop a pharmacophore model based on the alignment of multiple known active compounds [19] [51].
- Define essential chemical features (e.g., hydrogen bond acceptors/donors, hydrophobic areas, aromatic rings, ionizable groups) and their spatial arrangement [51].
- Use this model as a query to screen the chemical library, identifying compounds that match the pharmacophore hypothesis.
- Output: A subset of compounds (e.g., top 1-5%) ranked highly by the ligand-based methods.
Structure-Based Virtual Screening (Secondary Filter)
- Input: The subset of compounds identified in Step 2.
- Prerequisite: Availability of a 3D structure of the target protein (from X-ray crystallography, cryo-EM, or homology modeling) [19].
- Method: Molecular Docking
- Prepare the protein structure: add hydrogen atoms, assign partial charges, and define the binding site [85] [51].
- Dock the ligand subset into the target's binding site using a docking program (e.g., AutoDock, CDOCKER, LigandFit) [85] [19].
- Score the resulting poses based on predicted binding affinity (e.g., docking score, interaction energy) [19].
- Analyze the binding modes of top-ranked compounds to ensure they form key interactions with the target.
- Output: A refined list of compounds with favorable predicted binding characteristics.
Consensus Scoring and Hit Prioritization
- Combine the rankings from all employed methods (QSAR, pharmacophore, docking) into a consensus score [19].
- Visually inspect the top-ranked compounds to assess chemical合理性, synthetic accessibility, and potential for optimization.
- Final Output: A prioritized list of candidate hits for experimental validation.
The workflow for this protocol is visualized in the following diagram:
Key Methodologies and Experimental Protocols
This section provides detailed experimental protocols for the core computational techniques referenced in the combined workflow.
Ligand-Based Pharmacophore Modeling Protocol
Objective: To create a three-dimensional pharmacophore model using known active ligands, which defines the essential steric and electronic features required for molecular recognition and biological activity [51].
Procedure:
Data Set Curation
- Collect a set of 20-30 known active compounds with a range of potencies (ideally spanning at least three orders of magnitude).
- Include a set of confirmed inactive compounds to improve model selectivity, if available.
- Ensure chemical diversity to avoid over-representation of a single scaffold.
Conformational Analysis
- For each molecule, generate a representative set of low-energy conformations using a method such as systematic search, random search, or molecular dynamics [12].
- This step is crucial for capturing the bioactive conformation.
Pharmacophore Hypothesis Generation
- Align the generated conformations of the active molecules based on their common chemical features.
- Identify and map key pharmacophore features: Hydrogen Bond Acceptors (HBA), Hydrogen Bond Donors (HBD), Hydrophobic areas (H), Positively/Negatively Ionizable groups (PI/NI), and Aromatic rings (AR) [51].
- The software will generate multiple hypotheses that explain the common features shared by the active molecules.
Model Validation and Selection
- Validate the generated hypotheses by screening a test set of known active and inactive compounds.
- Select the model that best discriminates between active and inactive compounds (e.g., has the highest enrichment factor).
- The final model consists of a spatial arrangement of pharmacophore features with defined distances and angles between them.
3D-QSAR Modeling Protocol
Objective: To establish a quantitative correlation between the spatial fields surrounding a set of molecules and their biological activity, creating a predictive model for novel compounds [12] [85].
Procedure:
Data Set and Biological Activity
- Use the same curated data set as for pharmacophore modeling.
- Use experimentally determined biological activity values (e.g., IC₅₀, Ki) for each compound, converted to the negative logarithm (pIC₅₀, pKi) for modeling.
Molecular Alignment
- This is the most critical step for 3D-QSAR. Align all molecules in the data set into a common coordinate system.
- Use one of these methods:
- Pharmacophore-based alignment: Align molecules based on a common pharmacophore model.
- Database alignment: Align molecules to a common reference compound.
- Docking-based alignment: Use the predicted binding poses from molecular docking.
Field Calculation and PLS Analysis
- Calculate interaction fields for each aligned molecule. In Comparative Molecular Field Analysis (CoMFA), this includes steric (Lennard-Jones) and electrostatic (Coulombic) fields [85].
- In Comparative Molecular Similarity Indices Analysis (CoMSIA), additional fields like hydrophobic, and hydrogen bond donor/acceptor are calculated [85].
- The field values at thousands of grid points surrounding the molecules serve as independent variables (X), with biological activity as the dependent variable (Y).
- Use Partial Least Squares (PLS) regression to build the model, relating the field variables to the biological activity [12].
Model Validation
- Internal Validation: Perform leave-one-out (LOO) cross-validation to determine the predictive ability of the model (Q²). A Q² > 0.5 is generally considered acceptable [12].
- External Validation: Predict the activity of a test set of compounds not used in model building. This is the gold standard for assessing predictive power.
Table 1: Key Statistical Metrics for QSAR Model Validation
| Metric | Description | Acceptance Threshold |
|---|---|---|
| Q² (Q²_cv) | Cross-validated R²; measures internal predictive power | > 0.5 |
| R² | Coefficient of determination; measures goodness-of-fit | > 0.6 |
| RMSE | Root Mean Square Error; measures average error of prediction | As low as possible |
| F | F-statistic; measures overall significance of the model | Should be significant |
The Scientist's Toolkit: Essential Research Reagents & Solutions
Successful implementation of combined virtual screening strategies relies on both computational tools and conceptual frameworks. The following table details key resources and their functions in this domain.
Table 2: Key Research Reagent Solutions for Combined Virtual Screening
| Tool/Resource | Type | Primary Function in Virtual Screening |
|---|---|---|
| Compound Libraries | Data | Source of chemical structures for screening (e.g., ZINC, ChEMBL, in-house corporate libraries). |
| Known Active Ligands | Data | Used as a reference set for ligand-based methods like pharmacophore modeling and QSAR [51] [3]. |
| Target Protein Structure | Data | 3D structural information (from PDB or homology models) enabling structure-based methods like docking [19]. |
| Pharmacophore Model | Conceptual | An abstract query representing essential interaction features, used for rapid database filtering [51]. |
| QSAR Model | Computational | A mathematical model that predicts biological activity based on molecular structure descriptors [12]. |
| Molecular Descriptors | Computational | Numerical representations of molecular properties (e.g., logP, molar refractivity, topological indices) used in QSAR [12]. |
| Docking Software | Software/Tool | Predicts the preferred orientation and binding affinity of a small molecule within a target's binding site [85] [19]. |
Quantitative Comparison of Virtual Screening Strategies
The effectiveness of a virtual screening strategy is often measured by its enrichment factor—the improvement in hit rate compared to random selection [19]. The following table summarizes the typical applications and performance characteristics of different methodological combinations.
Table 3: Performance Comparison of Virtual Screening Strategies
| Screening Strategy | Typical Application Context | Relative Speed | Key Strengths | Reported Enrichment |
|---|---|---|---|---|
| Ligand-Based Only | No protein structure available; many known actives [3]. | Very Fast | Excellent for scaffold hopping; highly scalable. | Moderate to High |
| Structure-Based Only | High-quality protein structure available [19]. | Slow | Provides atomic-level interaction details. | Variable (depends on structure quality) |
| Sequential (LB → SB) | Protein structure available; need to efficiently screen large libraries [19]. | Fast (LB) → Slow (SB) | Maximizes resource efficiency; leverages both data types. | Consistently High |
| Parallel/Hybrid (LB + SB) | Ample computational resources; need to maximize hit diversity [19]. | Moderate | Mitigates limitations of individual methods; captures complementary hits. | Highest |
The relationship between these strategies and their performance is further illustrated below, showing how they integrate within the drug discovery pipeline to improve success rates.
Ligand-Based Drug Design (LBDD) has long been a cornerstone of computer-aided drug discovery, particularly when the three-dimensional structure of the target is unknown. Traditional LBDD methods rely on the molecular similarity principle, which posits that structurally similar molecules are likely to exhibit similar biological activities [17]. By analyzing the structural features and physicochemical properties of known active compounds, researchers can develop quantitative structure-activity relationship (QSAR) models and pharmacophores to guide the optimization of lead compounds and the design of new chemical entities [12] [5]. These approaches have proven invaluable for establishing structure-activity relationships (SAR) and facilitating lead optimization [12].
The advent of big data and artificial intelligence (AI) is now fundamentally transforming the LBDD landscape. Modern drug discovery generates massive datasets from high-throughput screening (HTS), public chemical databases, and multi-omics technologies, creating both unprecedented opportunities and significant challenges [86] [87]. The "four Vs" of big data—volume, velocity, variety, and veracity—demand new computational approaches that can handle high-volume, multidimensional, and often sparse data sources [86]. In response, AI technologies, particularly deep learning and multimodal language models, are being integrated with traditional LBDD methodologies to enhance predictive accuracy, enable more efficient exploration of chemical space, and facilitate the design of novel compounds with optimized properties [86] [88]. This application note examines these evolving trends and provides detailed protocols for implementing advanced LBDD strategies in modern drug discovery research.
Core LBDD Methodologies and Their Evolution
Foundational LBDD Approaches
Table 1: Core Ligand-Based Drug Design Methods and Their Applications
| Method | Key Features | Common Applications | Considerations |
|---|---|---|---|
| QSAR Modeling | Establishes mathematical relationships between molecular descriptors and biological activity [12] | Lead optimization, activity prediction, toxicity assessment | Requires high-quality experimental data; model validation is critical [12] |
| Pharmacophore Modeling | Identifies spatial arrangements of chemical features essential for biological activity [12] | Virtual screening, scaffold hopping, understanding drug-target interactions | Highly dependent on the quality and diversity of input ligands [17] |
| Molecular Similarity Searching | Uses molecular fingerprints or descriptors to find structurally similar compounds [17] | Hit identification, library expansion, side effect prediction | Limited by the "similarity principle" and chemical diversity of screening libraries [17] |
The fundamental hypothesis underlying LBDD—that similar compounds exhibit similar activities—remains powerful but has recognized limitations, particularly when activity cliffs exist where small structural changes cause dramatic activity differences [86]. Traditional QSAR modeling typically involves multiple steps: (1) identifying ligands with experimentally measured biological activity; (2) calculating molecular descriptors representing structural and physicochemical properties; (3) developing mathematical correlations between descriptors and activity; and (4) rigorously validating the statistical stability and predictive power of the model [12]. With the increasing availability of large-scale bioactivity data from public repositories like PubChem and ChEMBL, these traditional approaches are being significantly enhanced through AI integration [86].
The Rise of AI-Enhanced LBDD
Artificial intelligence, particularly machine learning (ML) and deep learning (DL), has demonstrated remarkable potential for addressing limitations of traditional LBDD. In a seminal 2012 QSAR machine learning challenge sponsored by Merck, deep learning models showed significantly better predictivity than traditional machine learning approaches for 15 ADMET (Absorption, Distribution, Metabolism, Excretion, and Toxicity) datasets [86] [87]. This early success highlighted AI's potential to model complex biological properties that were previously challenging for conventional QSAR approaches.
AI-enhanced LBDD provides several key advantages:
- Handling large-scale data: ML algorithms can efficiently analyze massive chemical datasets, such as PubChem's 97.3 million compounds and 1.1 million bioassays, overcoming limitations of traditional QSAR with small training sets [86]
- Predicting complex properties: Deep learning models can identify complex, non-linear patterns in data that are difficult to capture with traditional statistical methods [87]
- Feature learning: Deep neural networks can automatically learn relevant molecular representations from raw data, reducing reliance on manually engineered molecular descriptors [86] [87]
AI and Large-Scale Data Integration in LBDD
Multimodal AI for Enhanced Predictive Modeling
The emerging paradigm of multimodal language models (MLMs) represents a significant advancement in AI-driven drug discovery. Unlike traditional approaches that analyze data modalities in isolation, MLMs can integrate and jointly analyze diverse data types—including genomic sequences, chemical structures, clinical information, and textual data—to create a more comprehensive understanding of drug-target interactions [88]. This approach is particularly valuable for LBDD as it enables researchers to connect chemical patterns with broader biological context.
Multimodal AI systems can simultaneously explore genetic sequences, images of protein structures, and clinical data to suggest molecular candidates that satisfy multiple criteria, including efficacy, safety, and bioavailability [88]. For example, MLMs can correlate genetic variants with clinical biomarkers to improve patient stratification for clinical trials and optimize target selection [88]. This capability far exceeds traditional LBDD methods in both efficiency and scope, enabling the identification of subtle correlations and patterns that might be missed when analyzing chemical structures alone.
Addressing Data Challenges in AI-Enhanced LBDD
The implementation of AI in LBDD must contend with several data-related challenges, including missing data and biased data distributions. Analysis of drug response profiles in PubChem reveals significant data sparsity, with many compound-target combinations lacking experimental results [86]. Additionally, the ratio of active to inactive compounds in screening data is often highly imbalanced, which can bias machine learning models if not properly addressed [86].
Strategies to mitigate these challenges include:
- Data imputation techniques: Advanced algorithms can estimate missing values based on available data patterns
- Balanced sampling methods: Techniques such as undersampling majorities or oversampling minorities can address class imbalance
- Transfer learning: Models pre-trained on large chemical datasets can be fine-tuned with smaller, high-quality experimental data
- Data augmentation: Generating synthetic data points can enhance model robustness and performance
Experimental Protocols for AI-Enhanced LBDD
Protocol: Developing AI-Augmented QSAR Models
This protocol outlines the process for creating robust QSAR models enhanced with machine learning algorithms, integrating both traditional and modern approaches.
Table 2: Research Reagent Solutions for AI-Augmented QSAR
| Reagent/Resource | Function/Application | Implementation Notes |
|---|---|---|
| Chemical Database (e.g., ChEMBL, PubChem) | Source of bioactivity data for model training | ChEMBL contains >2.2 million compounds tested against >12,000 targets [86] |
| Molecular Descriptors (e.g., RDKit, Dragon) | Numerical representation of chemical structures | Include both 2D (topological) and 3D (conformational) descriptors |
| AI/ML Libraries (e.g., Scikit-learn, DeepChem) | Implementation of machine learning algorithms | DeepChem specializes in deep learning for drug discovery applications |
| Validation Framework (e.g., QSAR Model Reporting Format) | Standardized assessment of model predictivity | Critical for ensuring model reliability and reproducibility |
Procedure:
- Data Curation and Preparation
- Curate a dataset of compounds with reliable experimental activity measurements from databases like ChEMBL or in-house sources [86] [12]
- Calculate molecular descriptors using tools like RDKit or commercial software packages
- Apply strict preprocessing: remove duplicates, address activity cliffs, and curate structures carefully
Descriptor Selection and Model Training
- Apply feature selection algorithms (e.g., random forest importance, genetic algorithms) to identify the most relevant molecular descriptors [12]
- Partition data into training (∼80%), validation (∼10%), and test sets (∼10%) using rational methods such as Kennard-Stone or sphere exclusion to ensure representative chemical space coverage
- Train multiple AI models including random forest, support vector machines, and deep neural networks using platforms like DeepChem or TensorFlow [87]
Model Validation and Application
- Perform rigorous internal validation using k-fold cross-validation (typically 5-10 folds) and Y-scrambling to assess robustness [12]
- Evaluate external predictivity using the held-out test set that was not used in any model building or parameter optimization steps
- Apply the validated model to virtual screening of compound libraries or design of novel analogs with predicted improved activity
Protocol: Implementing Multimodal AI for Targeted Chemical Design
This protocol describes the integration of diverse data types using multimodal AI to enhance ligand-based design, particularly for complex targets or those with limited chemical data.
Procedure:
- Data Assembly and Integration
- Collect diverse data modalities including chemical structures, bioactivity data, genomic information, and clinical responses from relevant sources [88]
- Implement data harmonization to ensure compatibility across different data types and sources
- Create a unified data representation using techniques like molecular graphs for chemical structures and embeddings for biological sequences
Model Architecture Design and Training
- Design a multimodal architecture that can process different data types simultaneously while learning cross-modal relationships
- Employ transfer learning by pre-training components of the model on large public datasets (e.g., pre-training chemical language models on SMILES strings from PubChem) [88]
- Fine-tune the integrated model on target-specific data, using techniques like attention mechanisms to weight the importance of different data modalities
Model Interpretation and Experimental Validation
- Apply explainable AI techniques to interpret model predictions and identify key features driving compound activity
- Generate novel compound designs or select candidates from virtual libraries based on model predictions
- Validate top candidates through experimental testing in relevant biological assays, creating a feedback loop to refine the model
The Evolving Role of LBDD in Integrated Drug Discovery
The distinction between ligand-based and structure-based approaches is becoming increasingly blurred as integrated strategies gain prominence. The future of LBDD lies in its ability to complement and enhance structure-based methods, creating more powerful hybrid approaches [17]. These integrated workflows can leverage the strengths of both paradigms: LBDD's ability to extract information from known actives regardless of target structure availability, and structure-based design's capacity to leverage atomic-level target information when available [17].
Three main strategies have emerged for combining LB and SB methods [17]:
- Sequential approaches: Using computationally efficient LBDD methods for initial filtering followed by more resource-intensive structure-based techniques for final candidate selection
- Parallel approaches: Running LB and SB methods independently and combining their results to increase confidence in predictions
- Hybrid approaches: Creating integrated workflows that simultaneously utilize both ligand and target structure information
The integration of LBDD with precision medicine initiatives represents another significant evolution. By combining LBDD with clinical genomics and patient data, researchers can design compounds tailored to specific patient populations, potentially increasing clinical success rates [89] [88]. Pharmaceutical companies like AbbVie are already leveraging these approaches to better understand patient variability and guide the development of targeted therapies [89].
Ligand-Based Drug Design is undergoing a profound transformation driven by artificial intelligence and large-scale data integration. While traditional LBDD methods remain valuable for establishing structure-activity relationships and guiding lead optimization, their integration with AI technologies and multimodal data sources significantly expands their capabilities and applications. The implementation of robust protocols for AI-augmented QSAR and multimodal chemical design enables researchers to leverage these advanced approaches in their drug discovery efforts. As the field continues to evolve, the most successful drug discovery pipelines will likely embrace integrated strategies that combine the strengths of ligand-based, structure-based, and AI-driven approaches, ultimately accelerating the delivery of novel therapeutics to patients.
Conclusion
Ligand-Based Drug Design remains an indispensable and highly efficient strategy in the computational drug discovery toolkit, particularly valuable for targets with elusive 3D structures. Its core methodologies—from QSAR and pharmacophore modeling to ligand-based virtual screening—provide powerful means to understand structure-activity relationships, optimize lead compounds, and navigate vast chemical spaces. While challenges such as training set bias and molecular flexibility persist, they are being addressed through advanced statistical validation, machine learning, and, most importantly, strategic integration with structure-based techniques. The future of LBDD is not in isolation but in its synergistic combination with other methods, creating holistic frameworks that leverage all available chemical and biological information. This continued evolution, powered by artificial intelligence and ever-expanding biological datasets, promises to accelerate the discovery of novel, effective, and safe therapeutics for a wide range of diseases.
References
- 1. Computational ligand-based rational design: Role of conformational sampling and force fields in model development - PMC [https://pmc.ncbi.nlm.nih.gov/articles/PMC3123535/]
- 2. Ligand-based Drug Discovery | Jubilant Biosys [https://www.jubilantbiosys.com/services/ligand-based-drug-discovery/]
- 3. Ligand-based drug design – REVIVE [https://revive.gardp.org/resource/ligand-based-drug-design/?cf=encyclopaedia]
- 4. [In-Silico Drug Discovery Support-Current Situation and Challenges] [https://pubmed.ncbi.nlm.nih.gov/35444115/]
- 5. Computer-Aided Drug - PMC Design Methods [https://pmc.ncbi.nlm.nih.gov/articles/PMC5248982/]
- 6. Structure-Based vs Ligand-Based Drug Design - Creative Proteomics [https://www.iaanalysis.com/structure-based-vs-ligand-based-drug-design.html]
- 7. - Ligand and molecular docking simulation based ... drug design studies [https://jmhg.springeropen.com/articles/10.1186/s43042-020-00126-9]
- 8. Chemoinformatics Approaches to Structure- and Ligand - Based ... Drug [https://www.frontiersin.org/research-topics/5898/chemoinformatics-approaches-to-structure--and-ligand-based-drug-design/overview]
- 9. A ligand - based computational drug repurposing pipeline using KNIME... [https://pubmed.ncbi.nlm.nih.gov/33250934/]
- 10. - Molecular Org Similarity Drug Design [https://www.drugdesign.org/chapters/molecular-similarity/]
- 11. The Use of Computational Tools in Ligand - Based Drug Design [https://www.azolifesciences.com/article/Computational-Tools-in-Ligand-Based-Drug-Design.aspx]
- 12. Recent Advances in Ligand-Based Drug Design: Relevance and Utility of the Conformationally Sampled Pharmacophore Approach - PMC [https://pmc.ncbi.nlm.nih.gov/articles/PMC2975775/]
- 13. Ligand-based drug design | Medicinal Chemistry Class Notes | Fiveable | Fiveable [https://fiveable.me/medicinal-chemistry/unit-7/ligand-based-drug-design/study-guide/Hw6bzoj7iN3SbL6p]
- 14. Ligand-based drug discovery and design software [https://www.eyesopen.com/ligand-based-design]
- 15. Accelerating discovery of bioactive ligands with... [https://pmc.ncbi.nlm.nih.gov/articles/PMC11894060/]
- 16. Prospective de novo drug with deep... | Nature Communications design [https://www.nature.com/articles/s41467-024-47613-w?error=cookies_not_supported&code=864d9d6e-dd0c-44b7-aef6-a2f051c4ac02]
- 17. Merging Ligand-Based and Structure-Based Methods in Drug Discovery: An Overview of Combined Virtual Screening Approaches [https://www.mdpi.com/1420-3049/25/20/4723]
- 18. Ligand-Based Drug Design of Novel Antimicrobials against Staphylococcus aureus by Targeting Bacterial Transcription [https://www.mdpi.com/1422-0067/24/1/339]
- 19. Leveraging ligand - based and structure-based approaches for... [https://www.iptonline.com/articles/leveraging-ligand-based-and-structure-based-approaches-for-advan]
- 20. Structure and Ligand Based Drug Design Strategies in the Development of Novel 5-LOX Inhibitors - PMC [https://pmc.ncbi.nlm.nih.gov/articles/PMC3480706/]
- 21. Ligand-Based Approaches - Drug Design Org [https://www.drugdesign.org/chapters/ligand-based-approaches/]
- 22. Nonadditivity in public and inhouse data : implications for drug design [https://jcheminf.biomedcentral.com/articles/10.1186/s13321-021-00525-z]
- 23. Merging Ligand-Based and Structure-Based Methods in Drug Discovery: An Overview of Combined Virtual Screening Approaches - PMC [https://pmc.ncbi.nlm.nih.gov/articles/PMC7587536/]
- 24. : Ligand-Based Drug Design • BioSolveIT LBDD [https://www.biosolveit.de/drug-discovery-solutions/lbdd/]
- 25. Structure and dynamics in drug discovery | npj Drug Discovery [https://www.nature.com/articles/s44386-024-00001-2]
- 26. Machine learning for drug science [https://www.explorationpub.com/Journals/eds/Article/10087]
- 27. 4D-QSAR: Perspectives in Drug Design - PMC [https://pmc.ncbi.nlm.nih.gov/articles/PMC6263259/]
- 28. 3D-QSAR in drug design--a review - PubMed [https://pubmed.ncbi.nlm.nih.gov/19929826/]
- 29. AI-Integrated QSAR Modeling for Enhanced Drug Discovery: From Classical Approaches to Deep Learning and Structural Insight [https://www.mdpi.com/1422-0067/26/19/9384]
- 30. Generation of 2 - D Model for Angiogenin Inhibitors... QSAR [https://scialert.net/fulltext/?doi=tb.2016.1.13]
- 31. Generation, Pharmacophore - 3 study, and... | Research Square D QSAR [https://www.researchsquare.com/article/rs-1459868/v1]
- 32. Building QSAR models with RDKit Fingerprints and 2 in... D descriptors [https://www.massbio.org/news/member-news/building-qsar-models-with-rdkit-fingerprints-and-2d-descriptors-in-flare/]
- 33. Visual analytics in cheminformatics: user-supervised descriptor selection for QSAR methods - PMC [https://www.ncbi.nlm.nih.gov/pmc/articles/PMC4540751/]
- 34. Visual analytics in cheminformatics: user-supervised descriptor selection for QSAR methods - PubMed [https://pubmed.ncbi.nlm.nih.gov/26300983/]
- 35. (PDF) 3 - D and QSAR of... - Academia.edu Pharmacophore modeling [https://www.academia.edu/122003808/3D_QSAR_and_Pharmacophore_modeling_of_3_5_disubstituted_indole_derivatives_as_Pim_kinase_inhibitors]
- 36. T009 · Ligand -based pharmacophores — TeachOpenCADD... [https://projects.volkamerlab.org/teachopencadd/talktorials/T009_compound_ensemble_pharmacophores.html]
- 37. Pharmacophore modeling in drug design - PubMed [https://pubmed.ncbi.nlm.nih.gov/40175047/]
- 38. Pharmacophore Modeling and Virtual Screening for the Discovery of New type 4 cAMP Phosphodiesterase (PDE4) Inhibitors | PLOS One [https://journals.plos.org/plosone/article?id=10.1371/journal.pone.0082360]
- 39. Frontiers | Hierarchical Graph Representation of Pharmacophore Models [https://www.frontiersin.org/articles/10.3389/fmolb.2020.599059/full]
- 40. Frontiers | PharmacoForge: pharmacophore generation with diffusion... [https://www.frontiersin.org/journals/bioinformatics/articles/10.3389/fbinf.2025.1628800/full]
- 41. PharmDock: a pharmacophore -based docking program | Journal of... [https://jcheminf.biomedcentral.com/articles/10.1186/1758-2946-6-14]
- 42. ARTICLE: BIOPTIC B1 Ultra-High-Throughput Virtual ... Screening [https://bioptic.io/science/article-bioptic-b1-lrrk2-jcim-2025]
- 43. Exploring Chemical Space for Drug Discovery Using the Chemical Universe Database - PMC [https://pmc.ncbi.nlm.nih.gov/articles/PMC3447393/]
- 44. Advancements in Ligand - Based through the... Virtual Screening [https://pmc.ncbi.nlm.nih.gov/articles/PMC12117557/]
- 45. Comprehensive comparison of ligand - based tools... virtual screening [https://pubmed.ncbi.nlm.nih.gov/21090728/]
- 46. Web-based 3D-visualization of the DrugBank chemical space | Journal of Cheminformatics | Full Text [https://jcheminf.biomedcentral.com/articles/10.1186/s13321-016-0138-2]
- 47. Classification of Scaffold Hopping Approaches - PMC [https://pmc.ncbi.nlm.nih.gov/articles/PMC3328312/]
- 48. Classification of scaffold-hopping approaches - ScienceDirect [https://www.sciencedirect.com/science/article/abs/pii/S1359644611003813]
- 49. • BioSolveIT Scaffold Hopping [https://www.biosolveit.de/application-academy/scaffold-hopping/]
- 50. The scaffold hopping potential of pharmacophores - ScienceDirect [https://www.sciencedirect.com/science/article/abs/pii/S1740674910000284]
- 51. Drug Design by Pharmacophore and Virtual Screening Approach - PMC [https://pmc.ncbi.nlm.nih.gov/articles/PMC9145410/]
- 52. Molecular modeling approach in design of new scaffold of α-glucosidase inhibitor as antidiabetic drug - PMC [https://pmc.ncbi.nlm.nih.gov/articles/PMC12005936/]
- 53. Accelerating Discovery of Novel and Bioactive Ligands With... [https://arxiv.org/html/2401.01059v1]
- 54. Molecular dynamics simulation, 3D-pharmacophore and scaffold hopping analysis in the design of multi-target drugs to inhibit potential targets of COVID-19 - PubMed [https://pubmed.ncbi.nlm.nih.gov/34405765/]
- 55. QSAR classification-based virtual screening followed by molecular docking studies for identification of potential inhibitors of 5-lipoxygenase - ScienceDirect [https://www.sciencedirect.com/science/article/abs/pii/S1476927118304717]
- 56. QSAR classification-based virtual screening followed by molecular docking studies for identification of potential inhibitors of 5-lipoxygenase - PubMed [https://pubmed.ncbi.nlm.nih.gov/30321850/]
- 57. Synthetically-tailored and nature-derived dual COX-2/ 5 - LOX ... inhibitors [https://pubmed.ncbi.nlm.nih.gov/34479036/]
- 58. The metabolic effects of inhibitors of 5-lipoxygenase and of cyclooxygenase 1 and 2 are an advancement in the efficacy and safety of anti-inflammatory therapy - PubMed [https://pubmed.ncbi.nlm.nih.gov/14518558/]
- 59. Most Ligand - Based Classification Benchmarks Reward Memorization... [https://pubmed.ncbi.nlm.nih.gov/29698607/]
- 60. The algebraic extended atom-type graph- based model for precise... [https://jcheminf.biomedcentral.com/articles/10.1186/s13321-025-00955-z]
- 61. Frontiers | QSAR-Based Virtual Screening: Advances and Applications in Drug Discovery [https://www.frontiersin.org/journals/pharmacology/articles/10.3389/fphar.2018.01275/full]
- 62. Comparative study between deep learning and QSAR classifications for TNBC inhibitors and novel GPCR agonist discovery | Scientific Reports [https://www.nature.com/articles/s41598-020-73681-1]
- 63. Tracking protein kinase targeting advances: integrating QSAR into machine learning for kinase-targeted drug discovery - PMC [https://pmc.ncbi.nlm.nih.gov/articles/PMC11980485/]
- 64. -Co: An Open Source Software for Developing QSAR ... Robust [https://pubmed.ncbi.nlm.nih.gov/31083984/]
- 65. Ligand-based and structure-based approaches for the identification of potential SARS-CoV-2 3CLpro inhibitors | Soft Computing [https://link.springer.com/article/10.1007/s00500-025-10628-6]
- 66. Prospective de novo drug design with deep interactome learning - PMC [https://pmc.ncbi.nlm.nih.gov/articles/PMC11035696/]
- 67. Efficient incorporation of protein flexibility and dynamics into molecular docking simulations - PMC [https://pmc.ncbi.nlm.nih.gov/articles/PMC3172316/]
- 68. Frontiers | Bridging Molecular Docking to Molecular Dynamics in ... [https://www.frontiersin.org/articles/10.3389/fphar.2018.00923/full]
- 69. DynamicBind: predicting ligand-specific protein-ligand complex structure with a deep equivariant generative model | Nature Communications [https://www.nature.com/articles/s41467-024-45461-2]
- 70. - and Structure- Ligand and Based using... Drug Design Optimization [https://pubmed.ncbi.nlm.nih.gov/30963962/]
- 71. Chemical space navigation in lead discovery - PubMed [https://pubmed.ncbi.nlm.nih.gov/12023120/]
- 72. Structure-based and ligand - based discovery - Optibrium drug [https://optibrium.com/knowledge-base/leveraging-structure-based-and-ligand-based-drug-discovery/]
- 73. Lead optimization in the nondrug-like space - PubMed [https://pubmed.ncbi.nlm.nih.gov/21147254/]
- 74. Structure-based Drug Design vs. Ligand-based Drug Design - Extrapolations [https://extrapolations.com/structure-based-drug-design-vs-ligand-based-drug-design/]
- 75. Drug Designing in Bioinformatics: Methods, Tools, and Applications [https://www.linkedin.com/pulse/drug-designing-bioinformatics-methods-9uapc]
- 76. Advancements in small molecule drug design: A structural perspective - PMC [https://pmc.ncbi.nlm.nih.gov/articles/PMC10543554/]
- 77. Quantitative Methods in System- Based Discovery | IntechOpen Drug [https://www.intechopen.com/chapters/53186]
- 78. Frontiers | Introduction to small molecule drug discovery and preclinical development [https://www.frontiersin.org/journals/drug-discovery/articles/10.3389/fddsv.2023.1314077/full]
- 79. BJOC - Computational methods in drug discovery [https://www.beilstein-journals.org/bjoc/articles/12/267]
- 80. Advancing Drug Discovery with LBDD [https://www.numberanalytics.com/blog/advancing-drug-discovery-with-lbdd]
- 81. Recent advances in ligand - based : relevance and utility... drug design [https://pubmed.ncbi.nlm.nih.gov/20807187/]
- 82. Molecular Docking and Structure-Based Drug Design ... [https://pmc.ncbi.nlm.nih.gov/articles/PMC6332083/]
- 83. Relative Binding Free Energy Calculations Applied to Protein ... [https://pmc.ncbi.nlm.nih.gov/articles/PMC5777225/]
- 84. Structure based drug design and machine learning ... [https://www.nature.com/articles/s41598-025-17708-5]
- 85. Structure based and ligand | PPTX based drug designing [https://www.slideshare.net/slideshow/structure-based-and-ligand-based-drug-designing/116878935]
- 86. Big Data and Artificial Intelligence Modeling for Drug Discovery - PMC [https://pmc.ncbi.nlm.nih.gov/articles/PMC7010403/]
- 87. Artificial intelligence in drug discovery and development - PMC [https://pmc.ncbi.nlm.nih.gov/articles/PMC7577280/]
- 88. From siloed data to breakthroughs: multimodal AI in drug discovery - Drug Target Review [https://www.drugtargetreview.com/article/160597/from-siloed-data-to-breakthroughs-multimodal-ai-in-drug-discovery/]
- 89. Three ways AI is changing drug discovery at AbbVie | AbbVie [https://www.abbvie.com/who-we-are/our-stories/three-ways-ai-is-changing-drug-discovery-at-abbvie.html]