Isotropic vs Anisotropic Lipophilicity: A Comprehensive Guide for Drug Development
This article provides a thorough comparison of isotropic and anisotropic lipophilicity, two critical concepts in medicinal chemistry and drug design.
Isotropic vs Anisotropic Lipophilicity: A Comprehensive Guide for Drug Development
Abstract
This article provides a thorough comparison of isotropic and anisotropic lipophilicity, two critical concepts in medicinal chemistry and drug design. Tailored for researchers and drug development professionals, it explores the fundamental principles defining each system, detailing standard and high-throughput methodologies for their measurement. The content addresses common challenges in lipophilicity determination and offers optimization strategies, supported by a validation framework that compares predictive power for key pharmacokinetic behaviors. By synthesizing foundational knowledge with practical application, this guide aims to enhance drug candidate selection and optimize physicochemical property profiling.
Defining the Lipophilicity Landscape: From Isotropic Solvents to Anisotropic Biomimetic Systems
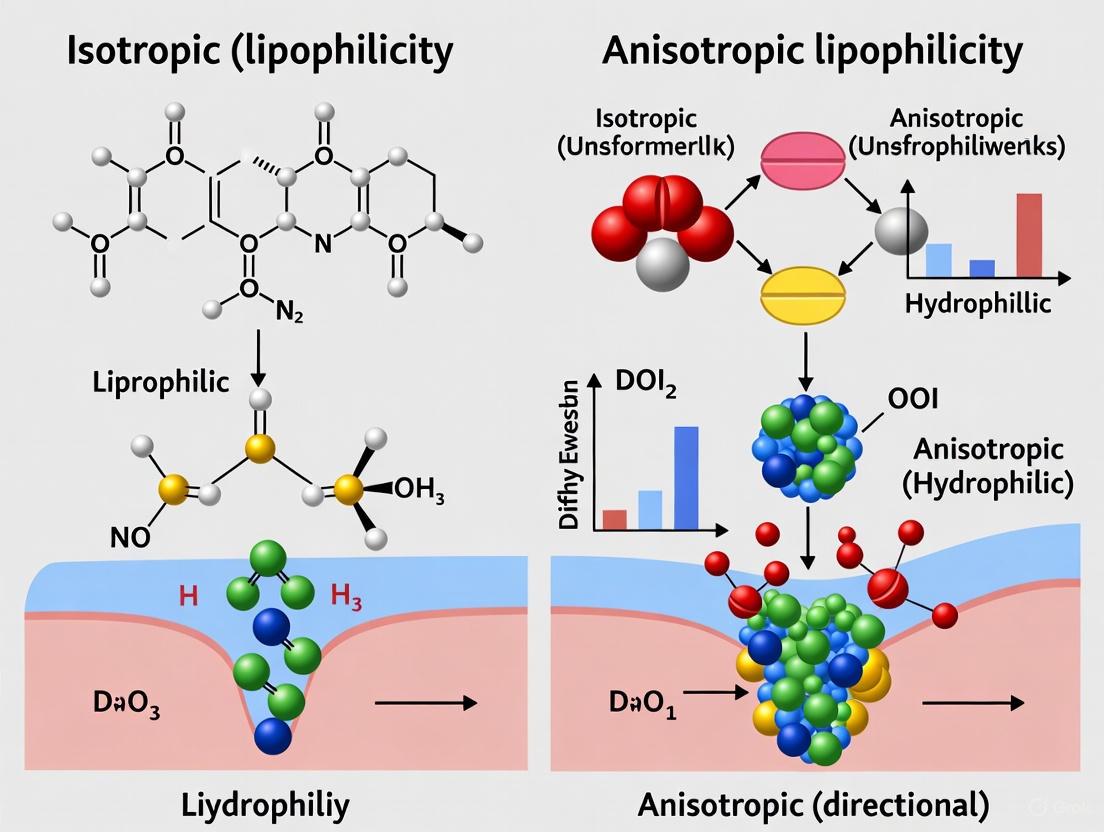
Lipophilicity, a fundamental physicochemical property, is defined as the affinity of a molecule for a lipophilic environment relative to an aqueous one [1]. It is a critical parameter in drug discovery and development, influencing a compound's absorption, distribution, metabolism, excretion, and toxicity (ADMET) profile [1] [2]. Traditionally, lipophilicity has been assessed through an isotropic model, which assumes a uniform, homogenous partitioning environment. However, the recognition that biological membranes are highly organized and structurally complex has led to the emergence of anisotropic lipophilicity models, which account for directionally dependent, heterogeneous interactions [1] [3]. This guide provides a comparative analysis of these two paradigms, detailing their core definitions, experimental determination methods, and relevance for modern pharmaceutical research.
Core Concepts and Fundamental Differences
The distinction between isotropic and anisotropic lipophilicity lies in the nature of the partitioning environment and the intermolecular forces involved.
Isotropic Lipophilicity describes the partitioning of a solute between two isotropic, or uniform, bulk phases—typically n-octanol (nonpolar) and water (polar) [1]. The resulting partition coefficient (log P) represents the net sum of a molecule's hydrophobicity minus its polarity. It is a direction-independent property, where the measured value is identical regardless of orientation, much like the physical properties of glass or cubic crystals [4] [5] [6]. This model provides a single, averaged measure of lipophilicity.
Anisotropic Lipophilicity, in contrast, describes partitioning into anisotropic, non-uniform phases such as artificial membranes, liposomes, or micelles [1]. These environments possess distinct topological regions and can form different types of interactions with a solute. Unlike the isotropic model, anisotropic lipophilicity encodes not only hydrophobicity and polarity but also considers directional interactions like ionic bonds and specific π–π interactions [1]. The property is direction-dependent, akin to the varying strength of wood along versus across its grain [4] [5].
The table below summarizes the key differences between these two concepts.
Table 1: Fundamental comparison of isotropic and anisotropic lipophilicity.
| Characteristic | Isotropic Lipophilicity | Anisotropic Lipophilicity |
|---|---|---|
| Definition | Partitioning into uniform, bulk phases [1] | Partitioning into ordered, non-uniform phases [1] |
| Direction Dependence | Direction-independent [4] | Direction-dependent [4] |
| Representative System | n-Octanol/Water [1] [7] | Liposomes/Buffer; Chromatographic Systems [1] |
| Intermolecular Forces Encoded | Hydrophobicity, Polarity [1] | Hydrophobicity, Polarity, Ionic bonds, Specific interactions (e.g., π–π) [1] |
| Primary Measured Output | log P (for unionized species) or log D (at a specific pH) [1] [8] | Chromatographic retention parameters (e.g., log k, Rₘ) [9] [1] [2] |
| Physiological Relevance | Simpler model; a good initial approximation | Higher; better mimics complex biological barriers like cell membranes [1] [3] |
Experimental Determination: Methods and Protocols
The philosophical difference between isotropic and anisotropic lipophilicity is reflected in the experimental techniques used for their determination.
Determining Isotropic Lipophilicity
The "gold standard" for isotropic lipophilicity is the shake-flask method [1] [7]. This direct method involves partitioning the solute between n-octanol and water (or a buffer) phases.
- Detailed Protocol: Shake-Flask Method
- Preparation: Pre-saturate n-octanol and water with each other to prevent phase changes during the experiment.
- Partitioning: Dissolve a known amount of the test compound in either the aqueous or organic phase. Combine the two phases in a flask, typically at a 1:1 ratio.
- Equilibration: Shake the mixture vigorously for a predetermined period (which can range from 1 hour to 24 hours) to allow the solute to distribute between the phases [7].
- Separation: After shaking, allow the phases to separate completely. Centrifugation may be used to aid separation.
- Quantification: Carefully sample each phase and quantify the solute concentration in both using a suitable analytical method, most often Liquid Chromatography (LC) due to its wide applicability and low detection limit [1] [7].
- Calculation: The partition coefficient, log P, is calculated as the logarithm (base 10) of the ratio of the solute's concentration in the n-octanol phase to its concentration in the aqueous phase.
While accurate, the shake-flask method is labor-intensive, consumes significant amounts of solvent and compound, and is not well-suited for compounds with very high or low log P values [1] [7]. Several modifications have been developed to address these limitations, such as the slow-stirring method to prevent emulsions and the vortex-assisted liquid–liquid microextraction (VALLME) to drastically reduce equilibration time and solvent volumes [7].
Determining Anisotropic Lipophilicity
Chromatographic techniques are the primary tool for assessing anisotropic lipophilicity. These are indirect methods where the retention behavior of a compound on a chromatographic system correlates with its lipophilicity.
- Detailed Protocol: Reversed-Phase Liquid Chromatography (RP-LC)
- System Setup: A reversed-phase chromatographic system is used, typically with a non-polar stationary phase (e.g., C18-silanized silica) and a polar mobile phase (e.g., mixtures of methanol or acetonitrile with water or buffer) [9] [2] [8].
- Column Selection: The choice of stationary phase is crucial. While octadecyl (C18) columns are common, phenyl columns are particularly interesting for anisotropic studies as they can engage in specific π–π interactions with analytes, mimicking specific biological interactions [9].
- Analysis: The test compound is injected into the mobile phase stream. As it passes through the column, it partitions between the mobile phase and the stationary phase.
- Data Collection: The retention time (tᵣ) of the compound is recorded. The retention time of an unretained marker (t₀) is also determined.
- Calculation: The capacity factor (k) is calculated as 𝑘 = (tᵣ − t₀)/t₀ [9]. This log k value, often determined at several mobile phase compositions, serves as a chromatographic descriptor of anisotropic lipophilicity. The specific interactions with the stationary phase (e.g., hydrophobic, π–π, hydrogen-bonding) make this a direction-dependent, anisotropic measure.
This approach is high-throughput, requires minimal amounts of compound, and can tolerate impurities [2] [8]. The retention data can be analyzed using chemometric tools like Principal Component Analysis (PCA) to reveal similarities and dissimilarities between compounds and chromatographic systems [9].
Graphviz diagram illustrating the core workflow for determining lipophilicity, highlighting the parallel paths for isotropic and anisotropic methods.
The Scientist's Toolkit: Essential Research Reagents and Materials
Successful experimental determination of lipophilicity relies on key reagents and materials. The following table details essential items for both isotropic and anisotropic methods.
Table 2: Key research reagents and materials for lipophilicity studies.
| Reagent/Material | Function in Research | Common Examples / Specifications |
|---|---|---|
| n-Octanol | The standard nonpolar phase in isotropic (shake-flask) partition systems [1] [7]. | HPLC or ACS grade, pre-saturated with water or buffer. |
| Aqueous Buffer | The polar phase in partition systems; controls pH for log D measurements [1]. | Phosphate buffer (e.g., pH 7.4); water (HPLC grade). |
| Reversed-Phase LC Columns | The stationary phase for anisotropic lipophilicity measurement; mimics a structured environment [9] [8]. | C18 (Octadecyl), C8 (Octyl), Phenyl columns. |
| Organic Modifiers | Component of the mobile phase in RP-LC; controls elution strength and selectivity [9] [2]. | Methanol (protic), Acetonitrile (aprotic); HPLC grade. |
| Human Serum Albumin (HSA) | Immobilized on stationary phases to study drug-plasma protein binding via High Performance Affinity Chromatography (HPAC), an anisotropic parameter [2]. | Commercial HSA-based HPLC columns. |
| Liposomes | Anisotropic vesicles used as a non-aqueous phase to better model biological membrane partitioning [1]. | Prepared from phospholipids like phosphatidylcholine. |
Isotropic and anisotropic lipophilicity represent complementary paradigms in physicochemical profiling. The isotropic model, exemplified by the n-octanol/water shake-flask method, provides a simple, standardized, and invaluable measure of a compound's general lipophilicity (log P). In contrast, anisotropic lipophilicity, determined primarily via chromatographic techniques, offers a more nuanced and physiologically relevant perspective by accounting for the directional and specific interactions a compound may encounter with complex biological structures like cell membranes and proteins. For researchers in drug development, a strategic combination of both approaches is ideal: using isotropic log P for initial screening and compound design, and leveraging anisotropic data to refine predictions of in vivo behavior, particularly for understanding permeability, distribution, and protein binding, thereby de-risking the candidate selection process.
In medicinal chemistry and drug design, the behavior of a molecule in a biological system is profoundly influenced by a trio of fundamental molecular forces: hydrophobicity, polarity, and ionic bonds. These forces collectively govern how substances interact with aqueous environments, cross biological barriers, and bind to their targets. Hydrophobicity describes the tendency of nonpolar molecules or molecular regions to associate in an aqueous environment, a phenomenon famously characterized by the clathrate "cage" structure water molecules form around hydrophobes [10] [11]. Polarity arises from the unequal sharing of electrons in covalent bonds between atoms of different electronegativities, creating molecular dipoles that can interact favorably with water molecules [12] [13]. Ionic bonds represent the electrostatic attraction between fully charged, oppositely charged species, such as those found in salts and many biological macromolecules [12].
The interplay of these forces is encapsulated in the concept of lipophilicity, a key physicochemical property that can be assessed through two distinct lenses: isotropic and anisotropic systems. Isotropic lipophilicity, typically measured in a homogeneous solvent system like n-octanol/water, reflects the compound's partition coefficient (log P) resulting from the net sum of hydrophobicity minus polarity [1]. In contrast, anisotropic lipophilicity is determined using structurally ordered systems such as chromatographic stationary phases or artificial membranes, where ionic charges have fixed locations and the resulting distribution coefficient encodes not only hydrophobicity and polarity but also ionic interactions [1] [14]. This comparison guide objectively examines the experimental approaches, data, and implications of research in both isotropic and anisotropic lipophilicity, providing scientists with a framework for selecting appropriate methodologies in drug development.
Theoretical Foundations and Key Concepts
The Hydrophobic Effect and Its Thermodynamic Basis
The hydrophobic effect is primarily an entropically driven phenomenon. When a hydrophobe is introduced into water, hydrogen bonds between water molecules break to accommodate the solute. The surrounding water molecules reorganize to form a more ordered, ice-like "clathrate cage" structure around the hydrophobe, resulting in a decrease in system entropy (ΔS < 0) [10]. The enthalpy change (ΔH) during this process can be negative, zero, or positive, but it is the large negative entropy change that makes the overall Gibbs free energy change (ΔG = ΔH - TΔS) positive, rendering the mixing of hydrophobes and water non-spontaneous [10]. However, when hydrophobic molecules come together, the structured water molecules are released back into the bulk, increasing entropy and making hydrophobic interactions spontaneous with a negative ΔG [10] [11].
Polarity and Dipolar Interactions
Polarity stems from the unequal sharing of electrons in covalent bonds between atoms with different electronegativities. In water molecules, oxygen is more electronegative than hydrogen, resulting in a partial negative charge (δ-) on the oxygen and partial positive charges (δ+) on the hydrogens [12] [13]. This creates a molecular dipole. Polar molecules interact through dipole-dipole interactions, where the partially positive end of one molecule attracts the partially negative end of another [12]. These interactions are stronger than London dispersion forces but weaker than hydrogen bonds or ionic bonds. The polarity of a molecule significantly influences its solubility, with polar compounds generally dissolving readily in polar solvents like water.
Ionic Bonds and Ion-Dipole Forces
Ionic bonds represent the strongest type of intermolecular force covered here, formed by the complete transfer of electrons from one atom to another, resulting in positively and negatively charged ions that electrostatically attract each other [12]. In aqueous solutions, ionic compounds interact with water molecules through ion-dipole interactions, where the charged ions are surrounded by the oppositely charged ends of water molecules, facilitating dissolution through a process called hydration [13]. These interactions are crucial for the solubility of salts and for the behavior of charged molecules in biological systems.
Table 1: Comparative Overview of Key Molecular Forces
| Force Type | Origin | Relative Strength | Role in Lipophilicity |
|---|---|---|---|
| Hydrophobic Interactions | Entropic drive from water reorganization | Relatively stronger than other weak intermolecular forces [10] | Increases lipophilicity; promotes association of nonpolar groups |
| Polarity / Dipole-Dipole | Unequal electron sharing in covalent bonds | Moderate [12] | Decreases lipophilicity; enhances aqueous solubility |
| Ionic Bonds / Ion-Dipole | Electrostatic attraction between full charges | Strong [12] | Significantly decreases lipophilicity; dominant in anisotropic systems |
Methodological Comparison: Isotropic vs. Anisotropic Lipophilicity Assessment
Isotropic Lipophilicity Determination
The gold standard for experimental determination of isotropic lipophilicity is the shake-flask method, which uses n-octanol and water as the biphasic system [1] [7]. This method, recommended by the Organization for Economic Co-operation and Development (OECD), involves dissolving the sample in the system, shaking until equilibrium is reached, and measuring the compound concentration in each phase [7]. The partition coefficient, P, is calculated as the ratio of the equilibrium concentration in n-octanol to that in water, and lipophilicity is expressed as log P [1].
While direct, this method has limitations: it is time-consuming (1-24 hours to reach equilibrium), requires relatively large amounts of pure compounds, and is not suitable for compounds with log P > 4 due to detection limit issues in the aqueous phase [1] [7]. Several modifications have been developed to address these drawbacks:
- Slow-Stirring Method: Prevents emulsion formation by slow stirring instead of shaking, requiring 2-3 days to reach equilibrium but providing more accurate values for highly lipophilic compounds (log P > 4.5) [7].
- Vortex Liquid-Liquid Microextraction (VALLME): Uses vortex agitation to disperse n-octanol into microdroplets in the aqueous phase, dramatically increasing the interfacial contact area and reducing equilibrium time to just 2 minutes [7].
- Flow-Based Methods: Utilize flow injection analysis to standardize measurements, with the large surface area enabling rapid equilibrium attainment [7].
Anisotropic Lipophilicity Determination
Chromatographic methods are primarily used for determining anisotropic lipophilicity, where the stationary phase mimics the ordered environment of biological membranes [1] [14]. Both High-Performance Liquid Chromatography (HPLC) and Thin-Layer Chromatography (TLC) are employed, with the latter offering advantages of reduced cost, time, and solvent consumption while allowing multiple samples to be handled simultaneously [14].
In these systems, the retention factor correlates with the compound's distribution behavior between the mobile phase and the stationary phase. The spatial distribution of ionic charges in the non-aqueous phase represents the key difference from isotropic systems - in anisotropic media, ionic charges have fixed locations on the chromatography plates or columns, more closely resembling the fixed charge distribution in phospholipid membranes [14].
Table 2: Comparison of Key Methods for Lipophilicity Determination
| Method | System Type | Key Principle | Advantages | Limitations |
|---|---|---|---|---|
| Shake-Flask | Isotropic | Partition between n-octanol and water | Gold standard, direct measurement [7] | Time-consuming, not for log P > 4, emulsion issues [1] [7] |
| Slow-Stirring | Isotropic | Prevents emulsions by slow stirring | Accurate for high log P [7] | Very long equilibrium time (2-3 days) [7] |
| VALLME | Isotropic | Vortex creates microdroplets for fast equilibrium | Rapid (2 min), high throughput [7] | Requires centrifugation for phase separation [7] |
| RP-HPTLC/HPLC | Anisotropic | Retention on structured stationary phase | Mimics biomembranes, high throughput [14] | No standardized system, correlation-dependent [14] |
Experimental Data and Comparative Analysis
Quantitative Comparison in Model Systems
Research on anisotropic and isotropic gelatin hydrogels provides compelling experimental data on how structural differences affect molecular permeability based on lipophilicity. In a study investigating permeability with model molecules of different log P values, anisotropic networks formed with polypropylene (PP) templates demonstrated preferential permeability for hydrophobic molecules, while isotropic networks favored hydrophilic compounds [15].
Table 3: Permeability Behavior in Anisotropic vs. Isotropic Hydrogel Systems
| Model Molecule | log P Value | Hydrophobic/Hydrophilic Character | Anisotropic Network (PP system) | Isotropic Network (Glass system) |
|---|---|---|---|---|
| L-phenylalanine (Phe) | -1.5 [15] | Hydrophilic (log P < 0) | Unique permeability with two induction and two permeation phases [15] | Typical diffusion behavior after initial induction phase [15] |
| Methylene Blue (MB) | -0.1 [15] | Hydrophilic (log P < 0) | Typical diffusion behavior [15] | Unique permeability with induction phase and two permeation phases [15] |
| Rhodamine B (RhB) | 2.3 [15] | Hydrophobic (log P > 0) | Typical diffusion behavior [15] | Unique permeability with induction phase and two permeation phases [15] |
This study demonstrated that anisotropic networks create hydrophobic regions that favor the transport of hydrophobic molecules like RhB, while isotropic networks, composed of water-soluble gelatin, show higher affinity for hydrophilic molecules like Phe [15]. The only differing factor was the anisotropy of the gelatin network structure, highlighting how molecular organization alone can dictate functional properties in otherwise identical compositions [15].
Case Study: 1-Arylsuccinimide Derivatives Analysis
A comprehensive study of 59 1-arylsuccinimide derivatives compared chromatographic lipophilicity across five structural series using Reverse-Phase High-Performance Thin-Layer Chromatography (RP-HPTLC) with aprotic solvents [14]. The retention parameters (R₍M⁰) ranged from 0.678 to 3.674 in acetone and 0.280 to 3.154 in acetonitrile systems, showing significant variation based on substituents [14].
Series B (1-aryl-3,3-diphenylsuccinimide derivatives) exhibited the highest chromatographic lipophilicity, attributed to the presence of two phenyl rings, while Series C (1-aryl-3-methylsuccinimide derivatives) showed the lowest lipophilicity [14]. The study established high-quality Quantitative Structure-Retention Relationship (QSRR) models, revealing that anisotropic lipophilicity is influenced by different molecular descriptors in different solvent systems - primarily size-related descriptors in acetone and electronic features in acetonitrile [14].
The Scientist's Toolkit: Essential Research Reagents and Materials
Table 4: Key Reagents and Materials for Lipophilicity Research
| Reagent/Material | Function in Research | Application Context |
|---|---|---|
| n-Octanol | Standard nonpolar phase in isotropic systems [1] [7] | Shake-flask method; reference solvent for log P determination |
| Water/Buffer Solutions | Polar phase in partitioning systems [1] | Aqueous phase in both isotropic and anisotropic systems |
| Chromatographic Plates/Columns | Structured stationary phases [14] | RP-HPTLC/HPLC for anisotropic lipophilicity determination |
| Aprotic Solvents (Acetone, Acetonitrile) | Organic modifiers in mobile phases [14] | RP-HPTLC systems for maintaining anisotropic conditions |
| Polymer Templates (PP, PVC) | Induce anisotropic network formation [15] | Creating structurally controlled hydrogels for permeability studies |
| Liposomes/Artificial Membranes | Biomimetic anisotropic phases [1] | Alternative to chromatographic systems for anisotropic lipophilicity |
The comparison between isotropic and anisotropic lipophilicity assessment reveals a critical dichotomy in how molecular forces are encoded and measured in different systems. Isotropic systems like n-octanol/water provide a fundamental measure of a compound's inherent partition behavior, reflecting the net balance between hydrophobicity and polarity [1]. In contrast, anisotropic systems, particularly chromatographic methods, incorporate additional factors including ionic interactions with fixed charges, more closely mimicking the structured environment of biological membranes [1] [14].
For researchers and drug development professionals, this distinction has profound practical implications. Isotropic log P values remain valuable for initial compound characterization and in silico modeling. However, anisotropic lipophilicity data often provides better correlation with biological membrane permeation and pharmacokinetic behavior, including absorption, distribution, and blood-brain barrier penetration [1] [14]. The case study of 1-arylsuccinimide derivatives demonstrates how anisotropic measurements can reveal structure-property relationships that might be obscured in isotropic systems [14].
Modern drug discovery would benefit from a tiered approach: employing rapid isotropic measurements for early-stage compound screening, followed by anisotropic characterization for lead compounds with proven biological activity. This strategy balances throughput with biological relevance, ultimately enabling more informed decisions in compound selection and optimization. As research continues to elucidate the complex interplay of hydrophobicity, polarity, and ionic forces in biological systems, the integration of both isotropic and anisotropic perspectives will remain essential for rational drug design.
Experimental Protocols and Workflows
Standard Shake-Flask Method for Isotropic Lipophilicity
RP-HPTLC Protocol for Anisotropic Lipophilicity
Lipophilicity is a fundamental physicochemical property that significantly influences the absorption, distribution, metabolism, excretion, and toxicity (ADMET) of drug candidates [1]. It is most frequently expressed as the logarithm of the partition coefficient (Log P), which describes the distribution of a compound between a nonpolar organic solvent and an aqueous phase [16] [1]. Among various solvent systems, the n-octanol/water system has emerged as the gold standard for isotropic lipophilicity measurement. Isotropic lipophilicity refers to partitioning between two bulk, immiscible solvents where ionic charges have no defined spatial location [14]. This system serves as a critical experimental benchmark for validating computational models and chromatographic methods, providing an essential parameter for the drug discovery process [17] [18].
Experimental Methodologies for Log P Determination
The Shake-Flask Method: The Recognized Gold Standard
The shake-flask method, officially endorsed by the Organization for Economic Co-operation and Development (OECD Test No. 107), is the definitive experimental technique for Log P determination [19]. This direct method measures the equilibrium concentrations of a compound in both phases of a biphasic n-octanol/water system [7] [1].
Detailed Experimental Protocol (OECD Guidelines):
- System Preparation: A two-phase system is prepared using n-octanol saturated with water and water saturated with n-octanol to prevent phase volume changes during the experiment [19].
- Temperature Control: The test is conducted at a constant temperature between 20°C and 25°C (±1°C) to ensure reproducibility [19].
- Partitioning: The compound is dissolved in one phase, and the system is agitated vigorously to facilitate partitioning between the two immiscible solvents. This is typically performed in duplicate vessels with different volume ratios of n-octanol to water across three separate runs [19].
- Phase Separation: After agitation reaches equilibrium (which can take 1-24 hours), the phases are separated, typically by centrifugation [7] [19].
- Concentration Analysis: The concentration of the test substance in both phases is quantified using appropriate analytical methods such as high-performance liquid chromatography (HPLC), gas chromatography, or photometry [7] [19].
- Validation & Calculation: The total quantity of substance recovered from both phases is compared with the amount originally introduced to validate the experiment. The partition coefficient (Pow) is then calculated for each run, with the final Log Pow values expected to fall within a range of ±0.3 units [19].
Comparison of Key Experimental Methods
While the shake-flask method remains the benchmark, several modifications and alternative approaches have been developed to address its limitations, such as being labor-intensive, time-consuming, and requiring relatively large amounts of pure compounds [7] [1].
Table 1: Comparison of Direct Experimental Methods for Log P Determination
| Method | Key Principle | Log P Range | Throughput | Key Advantages | Main Limitations |
|---|---|---|---|---|---|
| Shake-Flask [7] [19] | Direct partitioning between n-octanol and water with agitation | -2 to 4 (up to 5) | Low | OECD standardized; Direct measurement | Time-consuming; Prone to emulsions; Requires pure compounds |
| Slow-Stirring [7] | Slow mixing to prevent emulsion formation | Up to 4.5+ | Very Low | More reliable for high Log P compounds; Prevents emulsions | Very long equilibration (2-3 days) |
| Vortex-Assisted Liquid-Liquid Microextraction (VALLME) [7] | Vortex agitation to create microdroplets increasing interfacial area | N/A | Medium | Rapid equilibrium (2 minutes); Reduced solvent consumption | Requires optimization of vortex conditions |
| Water-Plug Aspiration/Injection [7] | Specialized sampling technique to prevent phase contamination | N/A | Medium | Improved accuracy for highly lipophilic compounds | Requires specialized technique |
| Flow-Based Methods [7] | Continuous flow with in-line mixing and detection | N/A | Medium | Automated; Standardized measurement | Requires specialized equipment |
Computational and Indirect Methods for Log P Prediction
In Silico Prediction Approaches
Computational methods for Log P prediction have gained significant traction, particularly in early drug discovery where rapid property estimation is essential for virtual screening [1] [18]. These methods can be categorized into four main families:
Table 2: Computational Approaches for Log P Prediction
| Method Family | Key Principle | Representative Methods | Strengths | Weaknesses |
|---|---|---|---|---|
| Atom-Based [18] | Summation of atomic contributions | ALOGP | Fast calculation; Simple implementation | Less accurate for complex molecules |
| Fragment-Based [20] [18] | Summation of hydrophobic fragment constants with correction factors | CLOGP, KLOGP | Better for large molecules; Accounts for interactions | Training-set dependent; Fragment library dependent |
| Topology/Graph-Based [18] | Uses topological descriptors or molecular graphs | MLOGP, Deep Neural Networks (DNN) | Can capture complex patterns; No 3D structure needed | Black-box nature; Training-set dependent |
| Structural Property-Based [18] | Based on physical-chemical principles and transfer free energy | FElogP, QM/MM methods | Physically rigorous; Potentially more transferable | Computationally intensive; Requires 3D structures |
The FElogP method represents a recent advance in structural property-based approaches, utilizing molecular mechanics Poisson-Boltzmann surface area (MM-PBSA) to calculate transfer free energy from water to n-octanol [18]. This method is based on the fundamental thermodynamic principle:
-RT ln(10) × logP = ΔGtransfer [18]
where ΔGtransfer represents the free energy change of transferring a molecule from water to n-octanol. In validation studies on 707 structurally diverse molecules, FElogP achieved a root mean square error of 0.91 log units, outperforming several popular QSPR and machine learning-based models [18].
Chromatographic Methods for Lipophilicity Assessment
Chromatographic techniques, particularly reversed-phase high-performance liquid chromatography (RP-HPLC) and thin-layer chromatography (RP-TLC/HPTLC), provide indirect measures of lipophilicity by correlating retention factors with Log P values [17] [1]. These methods are valuable for high-throughput screening and require minimal compound quantities [17] [14].
In RP-TLC, the chromatographic lipophilicity parameter (RMW) is determined by extrapolating retention data to zero concentration of organic modifier in the mobile phase [17]. This approach has been successfully applied to diverse compound classes, including anti-androgen drugs and uric acid-lowering agents, showing good correlation with computational Log P values [17].
Comparative Analysis: Isotropic vs. Anisotropic Lipophilicity
While the n-octanol/water system represents the gold standard for isotropic lipophilicity, anisotropic systems using artificial or natural membranes (e.g., liposomes, chromatographic stationary phases) provide complementary information that may better mimic biological barriers [1] [14].
Key Differences:
- Intermolecular Forces: Isotropic systems encode hydrophobicity and polarity, while anisotropic systems additionally account for ionic bonds due to the fixed location of charges in membranes or stationary phases [1].
- Biological Relevance: Anisotropic systems may better mimic partitioning into biological membranes, as the distribution between phospholipid membranes and extracellular fluids represents an anisotropic environment [14].
- Measurement Output: Isotropic lipophilicity provides a well-standardized physicochemical parameter (Log P), while anisotropic measurements offer insights into membrane interactions potentially more predictive of cellular permeability [1] [14].
Essential Research Reagents and Materials
Successful determination of n-octanol/water partition coefficients requires specific reagents and analytical tools. The following table outlines essential materials for conducting these experiments:
Table 3: Essential Research Reagents for n-Octanol/Water Partitioning Studies
| Reagent/Material | Specification/Purity | Critical Function | Application Notes |
|---|---|---|---|
| n-Octanol | HPLC grade or higher; Pre-saturated with water | Organic phase mimicking biological membranes | Must be mutually saturated with water to prevent volume shifts during partitioning [19] |
| Water | Ultra-pure grade (e.g., Milli-Q); Pre-saturated with n-octanol | Aqueous phase representing biological fluids | Saturating with n-octanol ensures stable phase volumes [19] |
| Buffer Solutions | pH-specific buffers (e.g., phosphate buffer) | For Log D determination of ionizable compounds | Enables measurement at physiologically relevant pH values [16] |
| Analytical Instruments | HPLC, GC, or UV-Vis spectrophotometer | Quantification of compound concentrations in both phases | HPLC provides wide applicability and low detection limits [7] |
| Centrifugation System | Capable of precise phase separation | Separates n-octanol and water phases after equilibration | Critical for obtaining pure phase samples for analysis [19] |
| Temperature Control | Thermostatic chamber or water bath (±1°C) | Maintains constant temperature during experiment | Essential for reproducible results [19] |
The n-octanol/water partition coefficient remains the gold standard isotropic system for lipophilicity assessment, providing a fundamental physicochemical parameter that profoundly influences drug discovery and development. While the shake-flask method offers the most direct and standardized measurement, various modifications and alternative approaches address specific limitations. Computational predictions provide valuable estimates, particularly in early discovery, but should be supplemented with experimental validation as compounds advance. The complementary relationship between isotropic systems like n-octanol/water and anisotropic membrane-based systems offers a more comprehensive understanding of compound behavior, enabling more effective optimization of drug candidates for desirable ADMET properties. As drug discovery continues to evolve with increasingly complex targets, the nuanced application of both isotropic and anisotropic lipophilicity measurements will remain essential for developing successful therapeutic agents.
Lipophilicity is a fundamental physicochemical property that profoundly influences the absorption, distribution, metabolism, excretion, and toxicity (ADMET) of drug-like compounds [2]. Traditionally, lipophilicity is assessed as an isotropic property through the partition coefficient (Log P) in the n-octanol/water system, known as the "shake-flask" method. This system represents a homogeneous, isotropic environment where ionic charges have no defined spatial arrangement [14]. In contrast, anisotropic lipophilicity is determined using systems where the non-aqueous phase has a structured, organized environment with fixed spatial arrangements of ionic charges, such as chromatographic stationary phases or liposome membranes [14]. These anisotropic systems more closely mimic the biological environment where drugs must interact with organized phospholipid bilayers in cell membranes [14] [21].
This guide provides a comparative analysis of two primary anisotropic systems used in pharmaceutical research: chromatographic phases (particularly reversed-phase TLC and HPLC) and biomimetic liposomes. We examine their experimental protocols, applications, advantages, and limitations to inform method selection for drug discovery and development.
Comparative Analysis of Anisotropic Systems
Table 1: System Comparison for Lipophilicity Assessment
| Feature | Chromatographic Systems | Liposome Systems |
|---|---|---|
| Principle | Retention based on analyte interaction with stationary phase | Partition coefficient between aqueous phase and lipid bilayer |
| Key Parameters | Capacity factor (logk), RM0, C0 [9] [2] | Partition coefficient (log Kp) [22] |
| Throughput | High (multiple samples simultaneously) [2] | Moderate to low |
| Biomimetic Relevance | Moderate (structured interface) [14] | High (phospholipid bilayer similar to cell membranes) [22] [21] |
| Sample Purity | Tolerates impurities (separation occurs during analysis) [2] | Requires pure compounds |
| Consumables Cost | Low to moderate [2] | Higher (specialized lipids) |
| Technical Expertise | Moderate | High |
Table 2: Quantitative Data from Experimental Studies
| Study Context | Chromatographic Lipophilicity Parameters | Liposome System Results |
|---|---|---|
| Triazine Derivatives [9] | logk values determined with C18 and phenyl columns with binary/ternary mobile phases | Not applicable |
| Tacrine Derivatives [2] | RM0 values: MeOH system: 1.36-2.79; ACN system: 0.93-2.31 | Not applicable |
| OECD Reference Compounds [22] | Not applicable | Log Kp values: Liposomes suitable for broad range; Micelles only for log Kp > 3 |
| Gelatin Hydrogels [15] | Not applicable | Permeability varied with logP: Phe (-1.5) vs. RhB (2.3) showed opposite permeability in anisotropic vs. isotropic networks |
The following diagram illustrates the key decision points when selecting an appropriate anisotropic system for lipophilicity assessment:
System Selection Decision Tree
Experimental Protocols for Anisotropic Lipophilicity Assessment
Chromatographic Systems (RP-TLC and RP-HPLC/UHPLC)
RP-TLC Methodology [2]:
- Stationary Phase: RP-18W F254s plates
- Sample Preparation: Dissolve compounds in MeOH (~0.5 mg/mL), apply 1.0 μL spots
- Mobile Phase: Binary mixtures of organic modifier (MeOH, ACN, dioxane, acetone) with water acidified with formic acid
- Modifier Concentration: Varying concentrations (e.g., MeOH: 0.5-0.9 v/v)
- Development: Vertical developing chamber, equilibrium with mobile phase vapor
- Detection: UV at 254 nm
- Data Analysis: Calculate RM values, extrapolate to zero organic modifier (RM0)
RP-UHPLC Methodology [9]:
- Columns: C18 (50 × 2.1 mm, 1.8 μm) or phenyl (150 × 2.1 mm, 5 μm)
- Mobile Phases: Binary (methanol/water or acetonitrile/water) or ternary (methanol/acetonitrile/water) mixtures
- Modifier Volume Fraction: 0.5-0.85 v/v
- Conditions: Isocratic elution, 25°C, flow rate 0.3-0.5 mL/min
- Detection: DAD at 254 nm
- Data Analysis: Calculate capacity factor k = (tᵣ - t₀)/t₀; logk as lipophilicity index
Biomimetic Liposome Systems
Liposome Preparation & Partition Measurement [22]:
- Liposome Composition: 1,2-dimyristoyl-sn-glycero-3-phosphorylcholine (DMPC) or mixtures with other phospholipids/cholesterol
- Preparation: Thin-film hydration or microfluidic technology [23]
- Size Control: Extrusion through polycarbonate membranes or microfluidic mixing
- Partition Determination: Derivative spectroscopy at physiological conditions (37°C, pH 7.4)
- Measurement: Compound concentration in aqueous phase before/after incubation with liposomes
- Data Analysis: Calculate partition coefficient log Kp = log(Cliposome/Cwater)
Microfluidic Liposome Fabrication [23]:
- Device: 3D-printed T-shaped microfluidic chips
- Process: Continuous flow mixing of lipid and aqueous phases
- Advantages: Monodisperse liposomes, reproducible manufacturing, precise size control
- Characterization: Dynamic light scattering, electron microscopy, protein quantification (Bradford method)
Research Reagent Solutions Toolkit
Table 3: Essential Materials for Anisotropic Lipophilicity Studies
| Category | Specific Items | Function & Application |
|---|---|---|
| Chromatographic Materials | RP-18W F254s TLC plates [2] | Stationary phase for reversed-phase TLC |
| C18 and phenyl columns [9] | UHPLC stationary phases with different selectivity | |
| HPLC-grade methanol, acetonitrile [9] | Organic modifiers for mobile phase preparation | |
| Liposome Components | DMPC, POPC, POPS phospholipids [22] [21] | Building blocks for biomimetic membrane systems |
| Cholesterol [21] | Modifies membrane fluidity and integrity | |
| Fluorescent probes (DPH, NBD-PE, Liss Rhod PE) [21] [23] | Membrane structure and organization assessment | |
| Specialized Equipment | 3D-printed microfluidic devices [23] | Precision manufacturing of uniform liposomes |
| Vertical TLC development chambers [2] | Controlled TLC separation environment | |
| Ultracentrifugation systems [22] | Liposome separation and purification |
Applications and Data Interpretation
Chromatographic systems particularly excel in early discovery phases where high-throughput screening of structural analogs is required. The linear relationship between RM and organic modifier concentration (RM = RM0 + bC) allows extrapolation to zero organic modifier content, providing the RM0 parameter that correlates well with lipophilicity [2]. For example, in the study of tacrine derivatives, RM0 values effectively differentiated the lipophilicity of compounds with subtle structural variations [2].
Liposome systems provide superior biomimetic prediction for biological barrier permeability. Research demonstrates that liposomes are generally the preferred model for assessing drug lipophilicity, outperforming both octanol/water and micelle systems [22]. The partition coefficients obtained using biomimetic models are "quite different and more reliable than the ones obtained using an octanol/water system" [22]. This enhanced predictability stems from their structural similarity to biological membranes, particularly when complex compositions including cholesterol and anionic lipids are incorporated [21].
The anisotropic nature of chromatographic systems arises from the structured chemical environment of the stationary phase, which provides a fixed orientation of functional groups that interact differentially with analytes based on their physicochemical properties [14]. This creates a more biologically relevant system than the isotropic n-octanol/water system, though less complex than liposome bilayers.
Chromatographic phases and liposome systems offer complementary approaches for anisotropic lipophilicity assessment. Chromatographic methods provide robust, high-throughput screening suitable for early-stage discovery and compound ranking, particularly when sample purity varies. Liposome systems deliver superior biomimetic prediction for membrane permeability and biological distribution, making them invaluable for lead optimization and mechanistic studies. The choice between systems should be guided by research stage, throughput requirements, needed biological relevance, and available resources.
The Critical Role of Lipophilicity in ADMET and Pharmacodynamics
Lipophilicity is a fundamental physicochemical property defining a molecule's affinity for a lipophilic environment versus an aqueous one. It is primarily expressed as the logarithm of the partition coefficient (log P) for unionized species or the distribution coefficient (log D) for both ionized and unionized species at a specific pH [1] [8]. This property is not merely a number but a critical descriptor that influences every aspect of a drug's behavior within the body, from its initial absorption to its final excretion, as well as its interaction with the intended biological target [24] [1] [25]. The pursuit of optimal lipophilicity is central to modern drug design, as it seeks to balance potency with favorable pharmacokinetic profiles, thereby avoiding the pitfalls of "molecular obesity" associated with excessively large and lipophilic molecules [1].
A key conceptual framework in this field is the distinction between isotropic and anisotropic lipophilicity. Isotropic lipophilicity is determined using homogeneous, bulk organic solvents like n-octanol. The resulting log P value represents the net sum of hydrophobicity (which drives partitioning into the organic phase) and polarity (which favors the aqueous phase) [1]. In contrast, anisotropic lipophilicity is measured using anisotropic systems such as artificial or natural membranes (e.g., liposomes, micelles). These systems introduce topographical relationships and additional intermolecular forces, including ionic bonds, offering a more biologically relevant mimic of cellular barriers [1]. This guide will objectively compare the experimental approaches, data, and implications of research into these two paradigms of lipophilicity.
Isotropic vs. Anisotropic Lipophilicity: A Fundamental Comparison
The choice between isotropic and anisotropic models dictates the type of intermolecular forces measured and the subsequent biological inferences that can be drawn. The table below provides a structured comparison of these two approaches.
Table 1: Core Differences Between Isotropic and Anisotropic Lipophilicity
| Feature | Isotropic Lipophilicity | Anisotropic Lipophilicity |
|---|---|---|
| Definition | Partitioning into a homogeneous, bulk organic solvent [1] | Partitioning into an anisotropic system like a membrane [1] |
| Typical Non-Aqueous Phase | n-octanol [7] [1] | Liposomes, micelles, phospholipid bilayers [1] |
| Forces Measured | Net sum of Hydrophobicity minus Polarity [1] | Hydrophobicity, polarity, and Ionic bonds [1] |
| Biological Relevance | Models passive transport through bulk lipids; well-established for QSAR [1] | More accurately mimics interactions with complex cell membranes [1] [8] |
| Key Parameter | log P (partition coefficient) [1] | log D (distribution coefficient at specific pH) [1] |
The relationship between the intermolecular forces governed by lipophilicity and biological systems is complex. The following diagram illustrates the forces encoded in each lipophilicity type and their primary pharmacokinetic (PK) and pharmacodynamic (PD) consequences.
Diagram 1: Lipophilicity Types, Forces, and Biological Impacts
Impact on ADMET and Pharmacodynamics
Pharmacokinetics (ADME)
Lipophilicity is a master regulator of a drug's journey through the body. It profoundly influences absorption, as compounds must passively permeate lipid biomembranes; the rate-limiting step for hydrophilic drugs is partitioning into the membrane, while for hydrophobic drugs, it is partitioning back into the intracellular aqueous environment [1]. Regarding distribution, lipophilic compounds tend to have a larger volume of distribution and accumulate in adipose tissue, but they also exhibit higher plasma protein binding, which can reduce their free concentration [1]. A critical aspect of distribution is Blood-Brain Barrier (BBB) penetration, which is generally enhanced by higher lipophilicity, though this can also increase affinity for efflux pumps like P-glycoprotein [24] [1]. Furthermore, lipophilicity influences metabolism and excretion, as the body often metabolizes lipophilic drugs into more polar metabolites to facilitate clearance. Highly lipophilic compounds may be stored in fatty tissues, leading to a prolonged half-life [1] [26].
Toxicity and Pharmacodynamics
Beyond pharmacokinetics, lipophilicity directly impacts safety and efficacy. High lipophilicity is a key risk factor for hERG channel binding, which can lead to cardiotoxicity by prolonging the QT interval [1]. It is also associated with target promiscuity, where compounds achieve potency through non-specific hydrophobic interactions, increasing the risk of off-target effects and toxicity [1]. From a pharmacodynamic perspective, the presence of lipophilic moieties can be crucial for interacting with hydrophobic binding pockets on target proteins, but this must be carefully balanced to maintain selectivity [1].
Experimental Data: Linking Lipophilicity to Properties and Activity
Recent studies on novel anticancer compounds provide quantitative evidence of these relationships. Research on 1,9-diazaphenothiazines showed that lipophilicity is associated with the activation of the mitochondrial apoptosis pathway (BAX induction, cytochrome c release, and caspase 9/3 activation) [24]. The following table summarizes experimental lipophilicity data and its connection to molecular properties for a series of diquinothiazines.
Table 2: Experimental Lipophilicity and Drug-Likeness Parameters of Selected Anticancer Diquinothiazines [26]
| Compound | RM₀ (RP-TLC) | logPTLC | iLOGP (calc.) | # Violations of Lipinski's Rule | TPSA (Ų) |
|---|---|---|---|---|---|
| 2 | 1.02 | 3.75 | 3.22 | 0 | 32.78 |
| 5 | 1.41 | 4.65 | 4.44 | 0 | 21.76 |
| 8 | 1.10 | 3.91 | 3.56 | 0 | 41.99 |
| 11 | 1.26 | 4.29 | 3.89 | 0 | 32.78 |
This data demonstrates that computational tools like iLOGP can provide a reasonable approximation of experimental chromatographic lipophilicity (RM0), supporting their use in early drug design [26]. All listed compounds adhere to Lipinski's Rule of Five, indicating a high probability of good oral bioavailability [24] [26].
Experimental Protocols for Lipophilicity Determination
Isotropic Methods: The Gold Standard and Its Evolution
The shake-flask method is the gold standard for direct log P determination, officially recommended by the OECD. It involves dissolving the sample in a biphasic system of n-octanol and water, shaking it until equilibrium is reached (which can take 1 to 24 hours), and then measuring the compound concentration in each phase, typically using HPLC [7] [1] [26]. While accurate for log P between -2 and 4, it is labor-intensive, requires pure compounds, and is unsuitable for poorly soluble or surface-active materials [7] [1].
Several modernized methods have been developed to address these shortcomings:
- Slow-Stirring Method: Prevents emulsion formation by using slow stirring instead of shaking, providing more reliable data for log P > 4.5, albeit with longer equilibration times (2-3 days) [7].
- Vortex-Assisted Liquid-Liquid Microextraction (VALLME): Uses vortex agitation to create an n-octanol emulsion in water, dramatically increasing the interfacial area and reducing equilibrium time to just 2 minutes. The phases are separated by centrifugation, and the solute concentration is determined by LC [7].
- High-Throughput 96-Well Method: This method measures the partition coefficient between a plasticized poly(vinyl chloride) (PVC) film and water in a 96-well microplate format. With 6 repeats, log Ppw values for 15 solutes can be determined in one plate in 4 hours. A linear correlation with log Pow allows this method to be used for prediction [27].
Anisotropic and Chromatographic Methods
Reversed-Phase Chromatography (RP-HPLC and RP-TLC) is a popular indirect method for determining lipophilicity. It is high-throughput, requires small sample amounts, and has a wide applicable range. The retention factor (log k) correlates with log P [26] [8]. RP-TLC, using C18 plates and a water-acetone mobile phase, has been successfully used to determine the RM0 parameter for novel diquinothiazines [26]. A significant advantage of chromatographic systems is that the stationary phase (e.g., C18-silica) is a non-polar anisotropic environment, making it more similar to partitioning into phospholipid bilayers than the isotropic n-octanol/water system [8].
The following diagram illustrates the workflow for a high-throughput, modern lipophilicity measurement method that can be adapted for both isotropic and anisotropic systems.
Diagram 2: High-Throughput Lipophilicity Measurement Workflow [27]
The Scientist's Toolkit: Essential Research Reagents and Materials
Successful lipophilicity research relies on a set of core materials and reagents. The following table details key solutions used in the featured experimental protocols.
Table 3: Essential Research Reagent Solutions for Lipophilicity Studies
| Research Reagent / Material | Function in Experiment | Example Application |
|---|---|---|
| n-Octanol / Water System | The standard isotropic biphasic solvent system for direct partition coefficient measurement [7] [1]. | Shake-flask, slow-stirring, and VALLME methods [7]. |
| Plasticized PVC Film | The hydrophobic polymer phase in the 96-well high-throughput partition method [27]. | Serves as the non-aqueous phase in log Ppw determination [27]. |
| C18 Functionalized Silica | The stationary phase for reversed-phase chromatographic (RP-HPLC & RP-TLC) lipophilicity estimation [26] [8]. | Used in RP-TLC with acetone-TRIS buffer mobile phase to determine RM0 [26]. |
| TRIS Buffer (pH 7.4) | An aqueous mobile phase component that mimics physiological pH for chromatographic determination [26]. | Creates a biologically relevant environment for measuring lipophilicity in RP-TLC [26]. |
| Liposomes / Micelles | Anisotropic non-aqueous phases that mimic biological membranes for partitioning studies [1]. | Used in slow-stirring or other methods to determine anisotropic distribution coefficients [7] [1]. |
The comparative analysis of isotropic and anisotropic lipophilicity research underscores that the choice of model system is not trivial; it fundamentally shapes the interpretation of a compound's behavior. Isotropic measures like the n-octanol/water log P provide a vital, standardized metric for forecasting general absorption and informing QSAR models. However, anisotropic systems offer a more nuanced and biologically faithful representation of a drug's interaction with cellular membranes, impacting its distribution, ability to penetrate specific barriers like the BBB, and its potential for off-target effects. Modern drug discovery benefits from a hybrid approach: leveraging high-throughput computational and chromatographic methods for initial screening and rapid iteration, while employing more sophisticated anisotropic and direct measurement techniques for lead optimization to de-risk efficacy and toxicity profiles. Ultimately, framing lipophilicity within this dualistic context enables researchers to more intelligently navigate the complex trade-offs in designing effective and safe therapeutics.
Measuring Lipophilicity: From Shake-Flask to High-Throughput Chromatographic Methods
Lipophilicity, the affinity of a compound for a lipid-like environment over an aqueous one, is a fundamental property in drug discovery and development. It influences a molecule's absorption, distribution, metabolism, excretion, and toxicity (ADMET). The classical methods for determining lipophilicity—shake-flask, slow-stirring, and their modern miniaturized variants—are classified as isotropic techniques. These methods measure a compound's behavior in a uniform, homogeneous chemical environment, most commonly the 1-octanol/water system. The resulting partition coefficient (log P) and distribution coefficient (log D) provide a baseline understanding of a molecule's hydrophobic/hydrophilic balance. This guide objectively compares these isotropic methodologies, detailing their protocols, performance, and appropriate applications within the broader context of lipophilicity research, which increasingly explores anisotropic systems that mimic the heterogeneous, structured nature of biological membranes [15].
The following table summarizes the key characteristics, performance metrics, and applications of the primary isotropic lipophilicity assessment methods.
Table 1: Comparative Overview of Classical Isotropic Lipophilicity Methods
| Method | Key Principle | Typical Throughput | log P Range | Key Advantages | Primary Limitations | Ideal Use Case |
|---|---|---|---|---|---|---|
| Shake-Flask [28] [29] [30] | Vigorous shaking to accelerate partitioning between 1-octanol and water phases. | Medium; can be medium-to-high when automated with LC-MS/MS for compound mixtures [29]. | Up to ~4 [30] | Considered a gold standard; well-understood; can be adapted for high-throughput [29]. | Prone to emulsion formation; cannot measure very high log P values; manual version is labor-intensive [31]. | Early-stage drug discovery for compounds with low-to-medium log P; generation of training data for in silico models [28]. |
| Slow-Stirring [31] | Gentle stirring to establish equilibrium without emulsion formation. | Low (requires prolonged stirring and multiple time points) [31]. | Up to 8.2 [31] | Eliminates emulsion issues; allows for measurement of very high log P values; OECD guideline method [31]. | Very low throughput; time-consuming (can take days); requires large volumes [31]. | Definitive measurement for highly lipophilic compounds in late-stage development or for regulatory purposes. |
| Miniaturized Variants [32] [33] | Scaling down assay volumes using microtiter plates and advanced analytical detection. | High | Varies with detection method | Dramatically reduced sample and solvent consumption (Green Analytical Chemistry); high-speed data acquisition; suitable for automation [32] [33]. | Potential for analytical interference; may not be suitable for very high log P compounds without specialized detection. | High-throughput screening in early discovery; profiling of large compound libraries; working with scarce compounds. |
Detailed Experimental Protocols
The Shake-Flask Method
The shake-flask method is a foundational technique for determining the partition coefficient of a compound between water-saturated 1-octanol and 1-octanol-saturated water [29] [30].
- Procedure:
- Phase Saturation: Pre-saturate 1-octanol and the aqueous buffer (at the desired pH for log D measurements) with each other by mixing them thoroughly and allowing them to separate before use.
- System Setup: Combine the test compound with both phases in a flask or vial. The volume ratio of the phases is chosen based on the expected log P to ensure measurable concentrations in both layers.
- Equilibration: Shake the mixture vigorously using an orbital shaker to create a large surface area for partitioning. The shaking frequency and diameter (e.g., up to 400 rpm [34]) are key process parameters that influence equilibration speed.
- Phase Separation: After shaking, allow the mixture to stand undisturbed until the phases separate completely. Centrifugation may be used to aid separation if emulsions form.
- Concentration Analysis: Carefully sample each phase and quantify the concentration of the test compound using a suitable analytical method, such as High-Performance Liquid Chromatography (HPLC) with UV detection or tandem Mass Spectrometry (LC-MS/MS) [29].
- Data Calculation: The partition coefficient, log P, is calculated as the logarithm (base 10) of the ratio of the compound's molar concentration in the 1-octanol phase to its molar concentration in the water phase [15] [30].
The Slow-Stirring Method
The slow-stirring method, an OECD guideline (Test No. 123), is designed to measure very high log P values while avoiding the formation of emulsions [31].
- Procedure:
- Reactor Setup: Water, 1-octanol, and the test substance are equilibrated at a constant temperature (e.g., 25 °C) in a thermostated, sealed stirred reactor, protected from daylight.
- Gentle Agitation: The mixture is stirred slowly and gently using a magnetic stirrer. The key is to create minimal shear stress to keep the interface between the two phases undisturbed, thus preventing emulsion formation.
- Kinetic Sampling: The concentrations of the test substance in both phases are determined at multiple consecutive time points over an extended period (potentially days). This is crucial for demonstrating that equilibrium has been attained.
- Replication: The determination must be performed using at least three independent slow-stirring experiments with identical conditions [31].
- Data Analysis: The log P is calculated from the equilibrium concentrations. A regression analysis based on at least four consecutive time points is used to confirm that the concentration ratio has stabilized, proving equilibrium has been reached [31].
Miniaturized and High-Throughput Variants
To address the demand for faster and more efficient screening, miniaturized versions of the shake-flask method have been developed.
- Procedure:
- Microplate Setup: The experiment is conducted in 96-well or 384-well microtiter plates. The pre-saturated octanol and aqueous phases, along with the test compound, are dispensed into the wells using automated liquid handlers.
- Miniaturized Equilibration: The plate is sealed and agitated on an orbital plate shaker. The small volumes and high surface-to-volume ratios can lead to faster equilibration times.
- Automated Analysis: After phase separation, samples from each phase are directly injected from the microplate into an LC-MS/MS system for quantification. A significant advancement is the ability to measure the distribution coefficients of mixtures of up to 10 compounds simultaneously by using MS detection to deconvolute the signals [29].
- Core Principle: This approach leverages the principles of Green Analytical Chemistry by drastically reducing solvent and sample consumption while increasing throughput [32] [33].
Workflow Visualization
The following diagram illustrates the standard experimental workflow common to these isotropic methods, highlighting the shared steps and key decision points.
The Researcher's Toolkit: Essential Materials and Reagents
Successful execution of these methods relies on specific laboratory materials and reagents.
Table 2: Essential Research Reagent Solutions for Lipophilicity Assays
| Item Name | Function/Description | Critical Notes for Use |
|---|---|---|
| 1-Octanol (Water-Saturated) | Organic solvent phase modeling lipid environments. | Must be pre-saturated with the aqueous buffer to prevent volume shifts during partitioning [31]. |
| Aqueous Buffer (Octanol-Saturated) | Aqueous phase at physiologically relevant pH (e.g., pH 7.4). | Must be pre-saturated with 1-octanol. Buffer choice controls ionization for log D measurements [28]. |
| Shake Flasks / Microtiter Plates | Cultivation vessels for equilibration. | Glass shake flasks are common [34]; polypropylene 96-well plates are standard for miniaturized assays [29] [33]. |
| Orbital Shaker / Plate Shaker | Provides mechanical agitation for equilibration. | Shaking frequency and diameter are key parameters controlling oxygen transfer and mixing [34] [35]. |
| HPLC-MS/MS System | For sensitive and specific quantification of analyte concentrations in both phases. | Essential for high-throughput methods analyzing compound mixtures [29] [33]. |
| Centrifuge | Aids in separation of phases post-equilibration. | Crucial for breaking micro-emulsions that can form in the shake-flask method. |
Connecting Isotropic Data to Anisotropic Research
The data generated from isotropic methods serve as a critical foundation for understanding more complex, anisotropic biological systems. Anisotropic environments, such as cellular membranes and engineered anisotropic hydrogels, possess ordered, non-uniform structures that can selectively influence molecular permeability based on direction and molecular properties [15].
For instance, research on anisotropic gelatin hydrogels has demonstrated that they preferentially permit the permeability of hydrophobic molecules (high log P), whereas isotropic hydrogels from the same material favor the transport of hydrophilic molecules (low log P) [15]. This mirrors the selective permeability of biological membranes. Therefore, a molecule's isotropic log P value, as measured by the methods described in this guide, is a key descriptor that helps predict its behavior in these more complex, biologically relevant anisotropic environments. This establishes a direct conceptual and practical link between classical isotropic measurements and cutting-edge anisotropic lipophilicity research.
Lipophilicity represents a fundamental physicochemical property in drug discovery, traditionally defined by the International Union of Pure and Applied Chemistry (IUPAC) as a "partitioning equilibrium of solute molecules between water and an immiscible organic solvent, favouring the latter" [1]. Conventionally, this property is expressed as the logarithm of the partition coefficient (log P) for a solute partitioned between n-octanol (nonpolar phase) and water (aqueous phase) [1]. This classical measurement, termed isotropic lipophilicity, results from the net sum of hydrophobicity minus polarity interactions in a uniform solvent environment [1].
In contrast, anisotropic lipophilicity has emerged as a more biologically relevant concept that accounts for complex interactions with non-homogeneous phases such as artificial membranes, liposomes, and micelles [1]. These anisotropic systems establish different topographical relationships between the solute and the nonaqueous phase, incorporating additional interaction forces including ionic bonds [1]. This distinction is crucial because anisotropic lipophilicity better mimics the heterogeneous environments drugs encounter in biological systems, particularly when interacting with cell membranes and proteins [1].
Chromatographic techniques have proven invaluable for assessing anisotropic lipophilicity, as the retention parameters obtained from reversed-phase high-performance liquid chromatography (RP-HPLC) and high-performance thin-layer chromatography (HPTLC) strongly correlate with a compound's partitioning behavior in anisotropic systems [36] [37]. These chromatographic methods provide a rapid, reliable alternative to traditional shake-flask methods, especially for compounds with limited purity or availability [37].
Methodological Approaches: RP-HPLC versus HPTLC
Fundamental Principles of Chromatographic Lipophilicity Assessment
Both RP-HPLC and RP-HPTLC determine lipophilicity through a compound's retention behavior in reversed-phase systems, where the stationary phase is nonpolar and the mobile phase is polar. The underlying principle states that more lipophilic compounds exhibit stronger interactions with the stationary phase, resulting in longer retention times (in HPLC) or lower migration distances (in TLC) [37].
In RP-HPLC, lipophilicity is typically expressed as the capacity factor (log k), calculated as log k = log[(tr - t0)/t0], where tr is the retention time of the compound and t0 is the dead time of the system [9]. For isocratic measurements, the extrapolated value log k0 (determined at 0% organic modifier) provides a standardized lipophilicity measure [36] [37].
In RP-HPTLC, lipophilicity is expressed as the RM value, calculated as RM = log[(1/Rf) - 1], where Rf is the retardation factor [38]. Similar to HPLC, the extrapolated value RM0 (determined at 0% organic modifier) serves as the chromatographic lipophilicity index [36] [37].
Experimental Protocols for Anisotropic Lipophilicity Determination
RP-HPLC Methodology
The typical RP-HPLC protocol for determining anisotropic lipophilicity involves the following steps [36] [37] [9]:
Stationary Phase Selection: Common columns include octadecyl (C18) or phenyl-modified silica columns. The phenyl columns are particularly valuable for compounds containing aromatic rings due to their ability to form π-π interactions [9].
Mobile Phase Preparation: Binary mixtures (methanol/water or acetonitrile/water) or ternary mixtures (methanol/acetonitrile/water) are used. The organic modifier content typically ranges from 50% to 85% (v/v) [9].
System Equilibration: The column is equilibrated with the mobile phase until a stable baseline is achieved.
Sample Preparation: Compounds are dissolved in appropriate solvents (e.g., acetone, methanol) at concentrations of approximately 1 mg/mL, followed by filtration [9].
Chromatographic Analysis: Samples are injected (typically 10 μL injection volume), and analyses are performed under isocratic conditions at controlled temperature (e.g., 25°C) [9].
Detection: UV detection at appropriate wavelengths (e.g., 254 nm for triazine derivatives) is commonly employed [9].
Data Processing: Retention times are recorded, and capacity factors (log k) are calculated. Plotting log k against organic modifier percentage and extrapolating to 0% modifier yields the log k0 parameter [37].
RP-HPTLC Methodology
The standard RP-HPTLC protocol involves these key steps [38] [37]:
Stationary Phase Preparation: Commercially available RP-HPTLC plates (e.g., C8 or C18 modified silica gel) are used without pretreatment.
Mobile Phase Selection: Various organic modifiers including methanol, acetonitrile, and dioxane are mixed with water in different proportions [38].
Sample Application: Compounds are spotted 1-1.5 cm from the bottom edge of the HPTLC plate using micropipettes.
Chromatogram Development: The mobile phase ascends through the stationary phase in a saturated chromatographic chamber until the solvent front reaches a predetermined distance.
Detection: UV light at appropriate wavelengths or specific staining reagents are used to visualize spots.
Data Processing: Rf values are determined, RM values calculated, and plots of RM versus organic modifier concentration are used to derive RM0 values [37].
Comparative Experimental Data: RP-HPLC versus HPTLC Performance
Case Study: Succinimide Derivatives
A comprehensive study on 1-aryl-3-ethyl-3-methylsuccinimide derivatives demonstrated strong correlation between RP-HPLC and RP-HPTLC determinations of anisotropic lipophilicity [36] [37]. The researchers determined log k0 values using RP-HPLC with methanol/water mobile phases and RM0 values using RP-HPTLC, with high determination coefficients (R² ≥ 0.99) for the correlations between organic modifier content and retention parameters [37].
Table 1: Lipophilicity Parameters of Selected Succinimide Derivatives [37]
| Compound | Substituent | RP-HPLC log k₀ | RP-HPTLC Rₘ₀ | Computational log P |
|---|---|---|---|---|
| 1 | 4-Br | 1.32 | 1.45 | 2.47 |
| 2 | 4-Cl | 1.29 | 1.41 | 2.37 |
| 3 | 4-CN | 0.85 | 0.92 | 1.32 |
| 4 | 4-COOH | 0.42 | 0.51 | 1.21 |
| 5 | 4-OH | 0.38 | 0.46 | 1.15 |
The study revealed that halogenated derivatives (compounds 1 and 2) exhibited the highest lipophilicity, while hydroxyl and carboxyl-substituted derivatives (compounds 4 and 5) showed the lowest lipophilicity [37]. Most significantly, strong linear relationships were observed between chromatographic parameters (log k0 and RM0) and computed log P values, validating both chromatographic approaches as reliable measures of anisotropic lipophilicity [37].
Case Study: Thiadiazole Derivatives
Another comparative investigation on 5-heterocyclic 2-(2,4-dihydroxyphenyl)-1,3,4-thiadiazoles employed multiple chromatographic approaches including RP-HPLC with C8, C18, phosphatidylcholine (IAM), and cholesterol stationary phases, alongside RP-HPTLC with C8 and C18 phases [38]. The researchers found that dioxane and methanol were particularly beneficial organic modifiers for lipophilicity estimation in HPTLC [38].
Table 2: Comparison of Chromatographic Methods for Thiadiazole Derivatives [38]
| Method | Stationary Phase | Organic Modifiers | Correlation with Computational log P | Key Advantages |
|---|---|---|---|---|
| RP-HPLC | C18, C8, IAM, Cholesterol | Methanol, Acetonitrile | Strong correlation (85% redundancy) | High precision, automation capability |
| RP-HPTLC | C18, C8 | Methanol, Dioxane | Strong correlation (85% redundancy) | High throughput, low solvent consumption |
| In silico | - | - | Reference method for validation | Rapid screening |
Principal component analysis (PCA) of the results demonstrated that chromatographic lipophilicity parameters (log kw and RMw) were well correlated and showed high redundancy (85%) compared with computed values [38]. Most tested compounds exhibited lipophilicity parameters within the recommended range for drug candidates, demonstrating the utility of these methods in early drug development [38].
Correlation with Pharmacokinetic Properties
Chromatographically determined anisotropic lipophilicity parameters show significant correlations with key pharmacokinetic properties. Research on succinimide derivatives demonstrated that log k0 and RM0 values strongly influence plasma protein binding (PPB), Madin-Darby Canine Kidney (MDCK) cell permeability, volume of distribution (Vd), and absorption constant (Ka) [36] [37].
These correlations are mechanistically explained by the fact that anisotropic lipophilicity captures not just hydrophobic interactions but also polarity and ionic contributions that mirror the complex biological environments drugs encounter in vivo [1]. For instance, compounds with moderate anisotropic lipophilicity (log k0 values around 1.0-1.5 in succinimides) demonstrated optimal balance between permeability and solubility, resulting in favorable absorption and distribution profiles [37].
Additionally, anisotropic lipophilicity parameters have proven valuable in predicting blood-brain barrier (BBB) penetration, with studies applying Clark's rules and Pre-ADMET software demonstrating that moderately lipophilic compounds (log k0 ~ 1.0-2.0) generally exhibit better BBB penetration potential [37]. This application is particularly relevant for central nervous system-active drugs such as anticonvulsant succinimide derivatives [37].
The Scientist's Toolkit: Essential Research Reagents and Materials
Table 3: Essential Research Reagents for Chromatographic Lipophilicity Determination
| Reagent/Material | Function/Application | Examples/Specifications |
|---|---|---|
| C18 Modified Columns | Stationary phase for RP-HPLC | ZORBAX Eclipse C18, 2.1 × 50 mm, 1.8 µm [9] |
| Phenyl Modified Columns | Stationary phase for π-π interactions | ZORBAX Eclipse XDB-Phenyl, 95 Å, 2.1 × 150 mm, 5 µm [9] |
| RP-HPTLC Plates | Stationary phase for thin-layer chromatography | C8 or C18 modified silica gel plates [38] |
| HPLC-grade Methanol | Protic organic modifier for mobile phase | HPLC gradient grade, J.T. Baker [9] |
| HPLC-grade Acetonitrile | Aprotic organic modifier for mobile phase | For HPLC analysis, Acros Organics [9] |
| HPLC-grade Water | Aqueous component of mobile phase | HPLC grade distilled water [9] |
| Reference Compounds | System suitability testing | Compounds with known lipophilicity values [37] |
Workflow and Relationship Diagrams
Chromatographic Lipophilicity Determination Workflow
Isotropic vs. Anisotropic Lipophilicity Concepts
Chromatographic determination of anisotropic lipophilicity using RP-HPLC and HPTLC provides a sophisticated approach that transcends traditional isotropic measurements. Both techniques offer distinct advantages: RP-HPLC delivers high precision and automation capability, while RP-HPTLC enables high-throughput analysis with minimal solvent consumption [38] [37].
The strong correlations between chromatographic parameters and key pharmacokinetic properties underscore the biological relevance of anisotropic lipophilicity measurements [36] [37]. Furthermore, the consistency between RP-HPLC and RP-HPTLC results, as demonstrated in multiple case studies, validates both approaches for reliable lipophilicity assessment in drug discovery [38] [37].
For optimal results, researchers should consider employing both techniques complementarily—using HPTLC for rapid screening of compound libraries and HPLC for detailed characterization of promising candidates. This integrated approach provides a comprehensive understanding of anisotropic lipophilicity, enabling more efficient optimization of drug candidates with favorable pharmacokinetic profiles.
Lipophilicity is a fundamental physicochemical property defined as the affinity of a molecule or a moiety for a lipophilic environment, commonly measured by its distribution behavior in a biphasic system [39]. In medicinal chemistry, it is crucial for explaining a compound's distribution in biological systems and is a key parameter in the drug discovery pipeline [1] [39]. Lipophilicity is primarily expressed as the logarithm of the partition coefficient (log P) for a solute between n-octanol and water, or as the distribution coefficient (log D), which accounts for all forms of a compound (neutral and ionized) at a given pH [1]. This property affects every pharmacokinetic component—absorption, distribution, metabolism, excretion, and toxicity (ADMET)—and also influences pharmacodynamic behavior by helping to explain ligand-target interactions [1]. The determination of lipophilicity can be broadly categorized into two approaches: isotropic methods, which use homogeneous solvents like n-octanol, and anisotropic methods, which use membrane-like systems such as liposomes or immobilized artificial membranes (IAMs) [1]. Isotropic lipophilicity results from the net sum of hydrophobicity minus polarity, whereas anisotropic lipophilicity also incorporates ionic bonds, meaning they express lipophilicity on different scales and encode different intermolecular forces [1]. This guide compares high-throughput approaches for determining these lipophilicity parameters, focusing on the central role of 96-well microplates and automated workflows.
Isotropic vs. Anisotropic Lipophilicity: A Conceptual and Practical Comparison
Fundamental Differences and Biological Relevance
The choice between isotropic and anisotropic lipophilicity measurement is not merely technical but fundamentally influences the predictive power for biological permeation. Isotropic lipophilicity, traditionally measured using the shake-flask method with an n-octanol/water system, provides a well-understood baseline of a compound's partitioning behavior [1]. Its strength lies in its simplicity and standardization, making it ideal for initial compound ranking and for use in quantitative structure-activity relationship (QSAR) studies [1]. However, its primary limitation is its failure to mimic the complex nature of biological membranes, which are anisotropic environments [1].
In contrast, anisotropic lipophilicity assessment employs systems like immobilized artificial membranes (IAM), liposomes, or micelles [1]. These systems are considered anisotropic because they establish different topographical relations between the solute and the nonaqueous phase, involving a broader spectrum of interaction forces, including ionic bonds [1]. Consequently, anisotropic parameters often provide a more accurate prediction of passive drug permeation across physiological barriers like the intestinal epithelium, the blood-brain barrier (BBB), or the skin, as they better simulate the actual environment a compound encounters in vivo [1] [40]. While increasing lipophilicity generally enhances membrane permeation, the pursuit of potency through this route carries risks. The trend known as 'molecular obesity' refers to designing large, lipophilic molecules that, despite high potency, may have poor pharmacokinetic profiles and increased promiscuity, leading to off-target effects and toxicity [1].
Comparative Analysis of Methodologies
The following table summarizes the core characteristics of these two approaches, highlighting their respective advantages and limitations.
Table 1: Core Characteristics of Isotropic and Anisotropic Lipophilicity Assessment
| Feature | Isotropic Lipophilicity | Anisotropic Lipophilicity |
|---|---|---|
| Defining System | Homogeneous organic solvent (e.g., n-octanol) [1] | Heterogeneous, membrane-like systems (e.g., IAM, liposomes) [1] |
| Primary Molecular Forces Encoded | Hydrophobicity and polarity [1] | Hydrophobicity, polarity, and ionic bonds [1] |
| Gold-Standard Method | Shake-flask method [1] | Methods using biomimetic stationary phases (e.g., IAM chromatography) [39] |
| Throughput & Automation | Lower throughput in classical form; amenable to HTS with automation [1] | Generally higher throughput and more amenable to automation via chromatographic techniques [39] |
| Predictive Strength | Good for initial solubility and basic partitioning [1] | Superior for predicting passive permeation across biological membranes (e.g., intestinal, BBB) [1] [40] |
| Key Limitation | Does not mimic the complex structure of biological membranes [1] | Can be more complex to set up and interpret; requires specialized materials [39] |
The 96-Well Microplate: A Standardized Platform for High-Throughput Experimentation
The microplate, also known as a microtiter or multi-well plate, is the physical foundation of modern high-throughput screening (HTS). It consists of a plate with multiple cavities (wells) that function as small sample tubes, typically arranged in a rectangular matrix [41].
Standardization and Formats
A critical development was the standardization of microplate features—including well dimensions, spacing, and overall footprint—by organizations like the American National Standards Institute (ANSI) and the Society for Laboratory Automation and Screening (SLAS) [41]. This standardization, particularly the established footprint of 127.76 mm × 85.48 mm, has been essential for enabling lab automation and the production of compatible instrumentation [41]. Microplates are available in various formats, with the 96-well layout being the most common. Higher-density formats, such as 384-well and 1536-well plates, are used for miniaturization to reduce reagent volumes and costs, though they often require pipetting machines rather than manual handling [41].
Table 2: Common Microplate Formats and Their Typical Operating Volumes
| Well Format | Maximum Fill Volume | Recommended Working Volume |
|---|---|---|
| 96-well | Up to 300 µL/well [41] | 100-300 µL [41] |
| 96-well half-area | Up to 170 µL/well [41] | 50-170 µL [41] |
| 384-well | Up to 100 µL/well [41] | 30-100 µL [41] |
| 384-well low-volume | 5-25 µL [41] | 5-25 µL [41] |
| 1536-well | Up to 15 µL/well [41] | 5-25 µL [41] |
Material and Color Selection for Assay Performance
The choice of microplate material and color is not trivial and directly impacts data quality.
- Materials: Polystyrene is the most common material and is ideal for absorbance assays and microscopy, but it does not transmit UV light (< 320 nm), making it unsuitable for nucleic acid quantification [41]. For UV-transparent applications, such as DNA/RNA quantification, cyclic olefin copolymer (COC) is preferred [41]. Polycarbonate and polypropylene are used for their temperature stability in applications like PCR and sample storage at -80°C [41].
- Colors: The plate color controls optical signal-to-background ratios and well-to-well crosstalk.
- Clear plates are required for absorbance-based assays like ELISA [41].
- Black plates absorb light and are suited for fluorescence intensity assays, as they reduce background and crosstalk [41].
- White plates reflect light and are recommended for luminescence and time-resolved fluorescence (TRF) assays to maximize signal detection [41].
- Grey plates offer an intermediate solution, useful for reducing crosstalk in assays like AlphaScreen while maintaining good signal levels [41].
High-Throughput Experimental Protocols for Lipophilicity Assessment
High-Throughput Media Blending and Cell Culture Optimization
A prime example of a high-throughput application in an anisotropic context is the optimization of cell culture media for bioprocessing. Rouiller et al. detailed a method for enhancing mammalian fed-batch cultures using 96-deepwell plates [42].
Detailed Protocol:
- Experimental Design: Starting from a baseline chemically-defined medium, 16 formulations testing 43 components at three different levels are designed.
- Media Blending: A custom-made mixture Design of Experiments (DoE) is employed, considering binary blends. This design generates 376 distinct media blends to be tested.
- Culture and Production: The blends are tested during both cell expansion and fed-batch production phases within a single experiment in 96-deepwell plates.
- Data Analysis:
- A simple ranking of conditions is used for a quick selection of promising formulations.
- Software (e.g., Design Expert) is used to predict the best mixes for maximizing growth and titer.
- Multivariate analysis identifies individual critical components for further optimization.
This high-throughput method allows for the identification of an optimized cell culture process in a significantly reduced timeframe compared to traditional approaches [42].
Automated Antibody Purification: A Comparison of Miniaturized Formats
Chromatographic purification, a key anisotropic separation technique, has been successfully miniaturized and automated in 96-well formats. A study directly compared two miniaturized labware formats for purifying an IgG antibody from cell culture [43].
Detailed Protocol:
- Sample Preparation: Cell culture broth is centrifuged (240 s at 3000× g) to remove cell debris.
- Chromatographic Formats:
- Miniaturized RoboColumns: Equilibrated with 2400 µL PBS buffer. Loaded with 600 µL of sample. Eluted with 600 µL of sodium acetate buffer (pH 3.5). These columns are reusable after a cleaning procedure.
- 96-Well Filter Plates: Equilibrated with 600 µL PBS buffer. Loaded with 200 µL of sample, followed by a 900-second incubation with shaking. Eluted with a double elution of 200 µL sodium acetate buffer (pH 3.5). Plates are single-use.
- Automation: Both formats are processed using a liquid-handling system (e.g., epMotion) coupled with a positive pressure device for solvent flow.
- Analysis: The purified antibody content is quantified by transferring an aliquot to a UV-compatible microplate for spectrophotometric measurement.
Key Comparison Findings:
- Quality: Both methods showed high efficacy and comparable results, with minor differences in yield.
- Economics: RoboColumns achieved the lowest cost per sample when annual throughput was maximized, largely due to their reusability.
- Sustainability: A significant reduction in laboratory waste was achieved using the reusable RoboColumns, enhancing both environmental friendliness and researcher safety [43].
The Scientist's Toolkit: Essential Research Reagent Solutions
Table 3: Key Materials and Reagents for High-Throughput Workflows
| Item | Function in High-Throughput Workflows |
|---|---|
| 96-Well Microplates | The standardized platform for parallel sample processing and analysis. Available in various formats, materials, and colors to suit specific assay needs (e.g., UV-transparent COC for DNA quantification, polypropylene for PCR) [41]. |
| Liquid Handling System | An automated system (e.g., epMotion) that provides precise and reproducible pipetting, enabling complex protocols and reducing manual labor and error [44] [43]. |
| Miniaturized Chromatography Labware | Includes formats like RoboColumns and 96-well filter plates pre-packed with chromatographic resin (e.g., Protein A). They enable high-throughput, parallel purification and screening of biomolecules under different conditions [43]. |
| Biomimetic Stationary Phases | Chromatographic phases that mimic biological membranes (e.g., Immobilized Artificial Membranes - IAM). They are used in anisotropic lipophilicity determination to predict a compound's behavior in biological systems [39]. |
| Absorbance Microplate Reader | An instrument for rapidly detecting signals from microplates. When integrated on-deck with a liquid handler, it enables fully automated measurement, as demonstrated in bacterial growth (OD600) assays [44]. |
Workflow Visualization of High-Throughput Approaches
The following diagrams illustrate the logical flow of two primary high-throughput approaches discussed in this guide.
Isotropic Lipophilicity Determination Workflow
Diagram 1: Isotropic Lipophilicity Workflow.
Anisotropic Lipophilicity and Automated Bioprocessing
Diagram 2: Anisotropic and Automated Workflows.
The integration of 96-well microplates and automated workflows has revolutionized the efficiency and scope of scientific research, particularly in the field of drug discovery. As demonstrated, the choice between isotropic and anisotropic lipophilicity assessment is critical, with anisotropic methods providing a more biologically relevant prediction of compound permeation. The high-throughput protocols for media optimization and antibody purification showcase the power of miniaturization and automation in accelerating process development while simultaneously improving economic and sustainability outcomes. By leveraging the standardized toolkit of microplates, liquid handlers, and biomimetic stationary phases, researchers can effectively navigate the complex landscape of lipophilicity to design better drug candidates with optimal ADMET profiles.
Lipophilicity, quantified as the partition coefficient (Log P), is a fundamental physicochemical property that significantly influences the absorption, distribution, metabolism, excretion, and toxicity (ADMET) of drug candidates [1]. In medicinal chemistry, it is crucial to control this property within a defined optimal range. While the traditional shake-flask method serves as the gold standard for Log P determination, it presents significant limitations for highly lipophilic compounds (Log P > 5), including a limited measurement range (-2 to 4), long analysis times, and sensitivity to impurities and compound solubility [45] [46] [7]. The proportion of highly lipophilic compounds in drug development pipelines has been steadily increasing, creating a pressing need for robust analytical methods capable of accurately characterizing these molecules [45].
This case study explores the application of Reversed-Phase High-Performance Liquid Chromatography (RP-HPLC) for the reliable determination of lipophilicity for compounds with Log P > 6. We objectively compare its performance against traditional and computational approaches, situating the discussion within the broader research context of isotropic versus anisotropic lipophilicity measurement. Isotropic lipophilicity, typically measured in an n-octanol/water system, results from the net sum of hydrophobicity minus polarity. In contrast, anisotropic lipophilicity, assessed using systems like artificial membranes, liposomes, or micelles, incorporates additional interaction forces, including ionic bonds, offering a potentially more biomimetic assessment [1].
Methodological Comparison: RP-HPLC vs. Alternative Techniques
The following table summarizes the primary methods available for determining lipophilicity, highlighting key performance characteristics.
Table 1: Comparison of Methods for Determining Lipophilicity
| Method | Measurement Range (Log P) | Speed | Key Advantages | Key Limitations |
|---|---|---|---|---|
| Computer Simulation | Broad | Rapid [45] | Cost-effective, fast, ideal for early-stage filtering [45] [7] | Accuracy depends on model and training data; can be imprecise for complex molecules (variances up to 2 Log P units) [46] [7] |
| Shake-Flask (Gold Standard) | -2 to 4 [45] [7] | Slow (1-24 hours to days) [7] | Direct measurement, accurate results, minimal sample amount [45] | Time-consuming, requires high purity, unsuitable for unstable compounds, prone to emulsion formation [45] [46] |
| RP-HPLC | 0 to >6 [45] [46] | Rapid (minutes per sample) [45] | High throughput, mild conditions, low purity requirements, insensitive to impurities, broad dynamic range [47] [45] [46] | Requires a calibration curve with reference standards; retention can be affected for ionizable compounds on silica-based columns [45] [48] |
The Superiority of RP-HPLC for High Lipophilicity Assessment
For compounds with Log P > 6, RP-HPLC offers distinct practical advantages. The method's robustness stems from its ability to obtain partition coefficients from retention time measurements instead of direct concentration determination, making it insensitive to impurities and the low aqueous solubility that often plagues highly lipophilic compounds [48]. Furthermore, the chromatographic hydrophobicity index (CHI) derived from gradient RP-HPLC methods enables rapid profiling of large compound libraries, facilitating high-throughput screening in early drug discovery [48].
Experimental Application: RP-HPLC Protocols for Log P > 6
Detailed RP-HPLC Methodologies
Two established RP-HPLC methodologies are presented below, detailing the protocols for lipophilicity determination.
Table 2: Key RP-HPLC Experimental Methods for Log P Determination
| Method Component | Method 1 (Fast Screening) | Method 2 (High Accuracy) | Application in Natural Products [48] |
|---|---|---|---|
| Core Principle | Direct correlation of Log P with retention factor (log k) [45] | Correlation of Log P with the extrapolated retention factor in 100% water (log kw) [45] | Fast-gradient method using a polystyrene-divinylbenzene (PRP-1) column |
| Standard Equation | Log P = a × log k + b [45] | Log P = a × log kw + b [45] | Calibration of retention time (tR) against known Log P values |
| Chromatographic Conditions | Single isocratic or gradient run [45] | Multiple runs at different organic modifier concentrations to extrapolate log kw [45] | Gradient: 0-100% acetonitrile over 16.5 mins; Flow rate: 1 mL/min |
| Measurement Speed | ~30 minutes per sample [45] | 2-2.5 hours per sample [45] | ~25-minute gradient runtime |
| Predictive Ability (R²) | 0.970 [45] | 0.996 [45] | Excellent correlation with literature Log P for diverse drugs |
| Best Application | Early drug screening of >30 compounds, presence of time constraints [45] | Late-stage development requiring high accuracy, absence of time constraints [45] | Front-loading drug-like properties in natural product libraries |
Experimental Workflow for RP-HPLC Log P Determination
The following diagram illustrates the general experimental workflow for determining Log P using RP-HPLC, integrating steps from both Method 1 and Method 2.
Addressing Ionizable Compounds with Alternative Stationary Phases
A significant challenge in RP-HPLC is the reliable measurement of ionizable compounds. Traditional silica-based C18 columns can exhibit silanophilic interactions with free silanol groups, leading to inaccurate retention times for basic drugs [48]. To overcome this, alternative stationary phases like polystyrene-divinylbenzene (PS-DVB), used in Hamilton PRP-1 columns, are recommended. These polymeric resins are chemically inert across a wide pH range (1-13), lack polar silanol sites, and have been successfully applied to measure the Log P of complex natural products, demonstrating excellent correlation with literature values [48].
The Isotropic vs. Anisotropic Lipophilicity Context
RP-HPLC fundamentally measures isotropic lipophilicity, as it correlates retention behavior to partitioning in the classic n-octanol/water system [1]. This isotropic parameter is encoded in the standard calibration equations using reference compounds with known Log Poct values [45]. The n-octanol/water system embodies isotropic lipophilicity because it represents a net balance between hydrophobicity (favoring the organic phase) and polarity (favoring the aqueous phase) [1].
In contrast, anisotropic lipophilicity is assessed using alternative systems like immobilized artificial membranes (IAM), immobilized liposome chromatography (ILC), or micellar systems, which establish different topographical relations and interaction forces between the solute and the nonaqueous phase [1] [46]. These anisotropic systems more closely mimic biological membranes and can provide valuable insights into a compound's distribution and permeation in vivo, which may not be fully captured by the isotropic Log P. The following diagram conceptualizes this relationship and the role of RP-HPLC.
Essential Research Reagent Solutions
The following table catalogs key reagents and materials essential for implementing the RP-HPLC methods discussed in this study.
Table 3: Research Reagent Solutions for RP-HPLC Lipophilicity Determination
| Reagent / Material | Function / Role | Application Notes |
|---|---|---|
| Reference Standards | Compounds with known, reliably established Log P values for constructing the standard calibration curve [45]. | A diverse set covering a wide Log P range (e.g., from 4-Acetylpyridine to Triphenylamine) is critical for an accurate and broad calibration [45]. |
| C18 Silica-Based Columns | The most common stationary phase for reversed-phase separation, providing hydrophobicity-based retention [46]. | Suitable for a wide range of neutral and acidic compounds. May show silanophilic interactions with basic compounds [48]. |
| Polymeric PRP-1 Columns | A polystyrene-divinylbenzene polymer stationary phase, inert and effective over a wide pH range (1-13) [48]. | Ideal for ionizable compounds, basic drugs, and harsh pH conditions where silica columns are unstable [48]. |
| Methanol & Acetonitrile | Organic modifiers used in the mobile phase to elute compounds from the hydrophobic stationary phase [45]. | Methanol is often preferred for its hydrogen-bonding properties, which are more similar to n-octanol [45]. |
| Ammonium Acetate Buffer | A common volatile buffer used to control the pH of the mobile phase, crucial for consistent retention of ionizable compounds. | Used in concentrations like 25-50 mM; compatible with mass spectrometry detection if needed [48]. |
| Bio-Inert HPLC System | An HPLC system with passivated fluidic paths to minimize surface interactions with sensitive analytes [49]. | Improves peak shape and recovery for compounds that interact with metal surfaces, providing more robust data [49]. |
RP-HPLC has firmly established itself as an indispensable, robust, and high-throughput method for determining the lipophilicity of highly lipophilic compounds (Log P > 6), effectively overcoming the major limitations of the traditional shake-flask method. The choice between fast screening (Method 1) and high-accuracy (Method 2) protocols allows researchers to align the analytical approach with their specific development stage, optimizing resource allocation. While this technique operates within the domain of isotropic lipophilicity, its value in predicting passive diffusion and informing early ADMET profiles is undeniable. For a comprehensive understanding of a compound's behavior, data from RP-HPLC should be considered alongside insights from anisotropic measurement systems, which more closely mimic the complexity of biological environments. The continued development and application of robust RP-HPLC methods are paramount for improving the success rate of potent, high-lipophilicity drug candidates in the development pipeline.
Lipophilicity, a key physicochemical parameter in drug discovery, is fundamentally assessed through two distinct paradigms: isotropic and anisotropic systems. Isotropic lipophilicity, classically represented by the partition coefficient (Log P), describes the equilibrium of a solute between bulk, immiscible solvents—typically n-octanol (nonpolar) and water (polar) [1]. This measurement results from the net sum of hydrophobicity minus polarity and encodes all intermolecular forces between the solute and the homogeneous solvent phases [1].
In contrast, anisotropic lipophilicity is determined using systems where the nonaqueous phase has a defined molecular organization, such as chromatographic stationary phases, artificial membranes, liposomes, or micelles [1] [14]. These systems are termed anisotropic because they establish specific topographical relations between the solute and the nonaqueous phase, involving a different balance of interaction forces, including ionic bonds, which are not present in isotropic scales [1]. The chromatographic retention factor, for instance, is a direct measure of this anisotropic lipophilicity [14]. Critically, anisotropic systems are generally accepted to better reflect distribution in living organisms, as the partitioning of a molecule between a phospholipid cell membrane and aqueous extracellular fluids is itself an anisotropic process [14].
Understanding this core distinction is vital for selecting the appropriate method, as the choice directly impacts the type of intermolecular forces measured and the subsequent predictability of a compound's pharmacokinetic and pharmacodynamic behavior [1].
The following tables provide a structured comparison of the primary methods for lipophilicity determination, categorizing them by their fundamental approach and key characteristics to aid in selection.
Table 1: Core Methodologies for Lipophilicity Determination
| Method Category | Specific Method | Measured Parameter (Lipophilicity Type) | Key Principle |
|---|---|---|---|
| Direct (Biphasic System) | Shake-Flask [1] [7] | Log P (Isotropic) | Direct measurement of concentration ratio after partitioning between n-octanol and water. |
| Slow-Stirring [7] | Log P (Isotropic) | Prevents emulsion formation via slow stirring for compounds with Log P > 4.5. | |
| Vortex-Assisted Liquid-Liquid Microextraction (VALLME) [7] | Log P (Isotropic) | Uses vortex agitation to create an emulsion, dramatically shortening equilibrium time. | |
| Indirect (Chromatographic) | Reversed-Phase TLC (RP-TLC) [2] [50] [14] | RM^0, C0 (Anisotropic) | Retention factor extrapolated to zero organic modifier correlates with partitioning. |
| Reversed-Phase HPLC (RP-HPLC) [51] [9] | log k, log k_0 (Anisotropic) | Capacity factor (or its extrapolation to 100% water) correlates with partitioning. | |
| Biomimetic Chromatographic | Immobilized Artificial Membrane (IAM) HPLC [51] | CHI_IAM (Anisotropic) | Uses stationary phases mimicking phospholipid membranes to model permeability. |
| Human Serum Albumin (HSA) HPLC [2] [51] | % Binding, log K (Anisotropic) | Measures affinity for plasma proteins to predict distribution and free drug concentration. |
Table 2: Characteristic Comparison of Key Methods
| Method | Throughput | Minimum Compound Purity | Typical Log P Range | Key Advantages | Key Limitations |
|---|---|---|---|---|---|
| Shake-Flask [1] [7] | Low | High | -2 to 4 | Gold standard, direct measurement. | Labor-intensive, prone to emulsions, large solvent volumes. |
| Slow-Stirring [7] | Very Low | High | Up to 8+ | Accurate for highly lipophilic compounds; no emulsions. | Very long equilibrium time (2-3 days). |
| VALLME [7] | Medium | High | N/A | Fast equilibrium (2 min), low solvent consumption. | Requires optimization of extraction parameters. |
| RP-TLC [2] [14] | High | Medium | Wide | Simple, cost-effective, low solvent use, multiple samples in parallel. | Less automation compared to HPLC. |
| RP-HPLC [51] [9] | High | Medium | Wide | Automated, highly precise, coupled with diverse detection. | Requires instrumentation; data is indirect. |
| IAM/HSA HPLC [2] [51] | High | Medium | Wide | Provides biomimetic data for permeability and protein binding. | Stationary phases are more specialized and costly. |
Detailed Experimental Protocols
Isotropic Lipophilicity: The Shake-Flask Method
The shake-flask method remains the gold standard and OECD-recommended procedure for the direct determination of the partition coefficient (Log P) [7].
- Principle: A compound is allowed to partition between water-saturated n-octanol and n-octanol-saturated water until equilibrium is reached. The concentration in each phase is then quantified [1] [7].
- Workflow:
- Solution Preparation: Prepare water-saturated n-octanol and n-octanol-saturated water by mixing the solvents and allowing them to separate before use.
- Equilibration: Dissolve the analyte in one of the phases (typically the phase in which it is more soluble). Combine the two phases in a flask (e.g., 1:1 ratio) and shake mechanically for a predetermined time (from 1 to 24 hours) to reach equilibrium.
- Phase Separation: Allow the phases to separate completely. Centrifugation may be used to aid separation.
- Quantification: Carefully separate the two phases. The concentration of the analyte in each phase is quantified, typically using a calibrated LC method (e.g., HPLC-UV) [1]. The use of LC provides a wider dynamic range and lower detection limits compared to UV/Vis spectroscopy, which is crucial for highly lipophilic compounds with low aqueous solubility [1] [7].
- Calculation: Log P is calculated as the logarithm (base 10) of the ratio of the compound's concentration in the n-octanol phase to its concentration in the aqueous phase [1].
Anisotropic Lipophilicity: Reversed-Phase TLC (RP-TLC)
RP-TLC is a favored chromatographic method for its simplicity and efficiency in determining anisotropic lipophilicity [2] [50] [14].
- Principle: The retention of a compound on a non-polar stationary phase (e.g., RP-18, RP-8) using a hydro-organic mobile phase correlates with its lipophilicity. The parameter RM^0, obtained by extrapolating the retention factor (RM) to zero organic modifier concentration, is a representative measure of chromatographic lipophilicity [14].
- Workflow:
- Stationary Phase: Use commercially available TLC plates pre-coated with a non-polar layer (e.g., silica gel modified with C18, C8, or C2 chains) [50] [52].
- Sample Application: Spot 1.0 μL of methanolic solutions of the analytes (concentration ~0.5 mg/mL) onto the baseline of the TLC plate [2].
- Mobile Phase & Development: Prepare a series of mobile phases consisting of an organic modifier (e.g., methanol, acetonitrile, or acetone) and water, often acidified with a small amount of formic acid [2]. Develop the plates in a pre-saturated chromatographic chamber until the mobile phase front travels a set distance.
- Detection & Calculation: Detect spots under UV light (if the compound has a chromophore) or using other appropriate derivatization methods. Calculate the retardation factor (RF). The RM value is calculated as RM = log(1/RF - 1). By developing with at least 5-6 different mobile phase compositions, the relationship between RM and the volume fraction of organic modifier (ϕ) can be established. The intercept of the linear regression (RM^0) at ϕ = 0 is the chromatographic lipophilicity index [14].
Advanced Biomimetic Lipophilicity: IAM and HSA HPLC
High-Performance Affinity Chromatography (HPAC) uses stationary phases with immobilized biomolecules to measure interactions relevant to in vivo distribution [2] [51].
- Principle: The retention time of a compound on a column with an immobilized protein (HSA) or artificial membrane (IAM) correlates with its binding affinity. This is converted into a Chromatographic Hydrophobicity Index (CHI) or a binding constant (log K) [51].
- Workflow:
- Chromatographic System: Use a HPLC system with a dedicated column (e.g., IAM.PC.DD2 or HSA-bound silica) [51].
- Mobile Phase: For IAM, an acetonitrile gradient in phosphate buffer (pH 7.4) is often used. For HSA, an isopropanol gradient in phosphate buffer (pH 7.4) is typical [51].
- Calibration & Analysis: The system is calibrated with a set of standards with known properties. The analyte is injected, and its retention time is recorded. The calibrated retention time is converted into a CHI value or % plasma protein binding [51]. A parallel four-way HPLC system can be configured to measure lipophilicity, HSA binding, and IAM binding in a single run for high-throughput profiling [51].
Visual Decision Guides
Method Selection Workflow
The following diagram outlines a logical decision pathway for selecting the most appropriate lipophilicity method based on project stage and compound properties.
Relationship Between Lipophilicity Methods and Properties
This diagram illustrates how different measurement methods relate to the core concepts of isotropic and anisotropic lipophilicity and the molecular properties they probe.
The Scientist's Toolkit: Essential Research Reagents and Materials
Table 3: Key Reagent Solutions for Lipophilicity Determination
| Item | Function & Application | Notes |
|---|---|---|
| n-Octanol & Water [1] [7] | The standard biphasic solvent system for direct (isotropic) Log P determination. | Must be mutually saturated before use to avoid volume shifts during partitioning. |
| RP-TLC Plates (e.g., RP-18F₂₅₄, RP-8F₂₅₄) [50] [14] | The stationary phase for chromatographic (anisotropic) lipophilicity measurement. Different chain lengths (C18, C8, C2) offer varying selectivity. | C18 provides the highest retention for non-polar compounds. |
| HPLC Organic Modifiers (Methanol, Acetonitrile) [2] [9] | Used in mobile phases for RP-TLC and RP-HPLC. They compete with the analyte for the stationary phase, modulating retention. | Acetonitrile (aprotic) and methanol (protic) offer different selectivity due to their distinct proton-donating abilities [2]. |
| Buffers (e.g., Phosphate Buffer, pH 7.4) [2] [51] | Used to maintain physiological pH in mobile phases, enabling determination of the distribution coefficient (Log D). | Essential for biomimetic HPLC and for profiling ionizable compounds. |
| IAM, HSA, AGP HPLC Columns [2] [51] | Specialized stationary phases for High-Performance Affinity Chromatography (HPAC) to measure biomimetic properties. | IAM predicts membrane permeability; HSA/AGP predict plasma protein binding. |
| Calibration Standards [51] | A set of compounds with known lipophilicity or binding properties used to calibrate chromatographic systems. | Enables conversion of retention times into standardized parameters like CHI or % binding. |
The strategic selection of a lipophilicity measurement method is a critical step in efficient drug design. Isotropic methods like shake-flask provide foundational reference data, while anisotropic chromatographic methods offer high-throughput, biomimetic insights crucial for ranking compounds in early to mid-stages of discovery. The choice is not one of superiority but of context: align the method with the project's stage, the required information throughput, and the specific physicochemical or ADMET properties you need to probe. By leveraging this guide, researchers can objectively navigate the available toolkit, ensuring that lipophilicity data effectively informs the design of compounds with optimal pharmacokinetic and safety profiles.
Overcoming Practical Challenges in Lipophilicity Determination and Data Interpretation
Lipophilicity, quantified as the partition coefficient (Log P) or distribution coefficient (Log D), is a fundamental physicochemical property in drug discovery. It influences a compound's absorption, distribution, metabolism, excretion, and toxicity (ADMET) [45]. A significant proportion of clinical drug development failures—30% to 40% in the 1990s, and still 10% to 15% today—are attributed to poor drug-like properties, with inadequate lipophilicity being a key contributor [53]. Research methodologies in this field can be broadly categorized into isotropic and anisotropic approaches. Isotropic methods, such as the traditional shake-flask technique, measure partitioning in homogeneous, randomly oriented liquid-liquid systems. In contrast, anisotropic techniques, like those using chromatographic surfaces or liquid crystals, assess interactions with ordered, directionally dependent phases [54] [55] [56]. This guide objectively compares these methodologies, highlighting common pitfalls and providing supporting experimental data to inform researchers and drug development professionals.
Comparing Isotropic and Anisotropic Lipophilicity Methods
Understanding the fundamental differences between isotropic and anisotropic systems is crucial for selecting the appropriate research methodology.
Table 1: Fundamental Differences Between Isotropic and Anisotropic Systems
| Property | Isotropic Systems | Anisotropic Systems |
|---|---|---|
| Definition | Uniform properties in all directions [54] [55]. | Direction-dependent properties [54] [55]. |
| Symmetry | High symmetry; no preferential orientations [55]. | Lack symmetry; have preferred directions or orientations [55]. |
| Refractive Index | Single refractive index [54]. | Multiple refractive indices [54]. |
| Chemical Bonding | Consistent [54]. | Inconsistent [54]. |
| Example Systems | -shake-flask (n-octanol/water) [29] [45]- PVC-water polymer phase [27] | - Reversed-Phase HPLC [45]- Lipid-based liquid crystals [56] |
Isotropic systems are characterized by uniform properties regardless of direction. In lipophilicity measurement, the classic shake-flask method using an n-octanol/water system is isotropic because the solute partitions into a homogeneous liquid environment without directional preference [54]. Similarly, a high-throughput method using a plasticized poly(vinyl chloride) (PVC) film and water also represents an isotropic system, as the polymer phase provides a uniform environment for partitioning [27].
Anisotropic systems exhibit direction-dependent properties. Reversed-Phase High-Performance Liquid Chromatography (RP-HPLC) is an anisotropic method because the interaction between the analyte and the stationary phase is directional and governed by the specific chemical geometry and surface chemistry of the column [55]. Likewise, lipid-based drug delivery systems can form anisotropic liquid crystals, such as lamellar or hexagonal phases, where the structured surfactant layers create a non-uniform environment for drug partitioning [56].
Pitfall 1: Emulsion Formation and Stabilization
The Problem and Its Impact
Emulsion formation is a major challenge in isotropic methods like the shake-flask technique. When two immiscible liquids (e.g., n-octanol and water) are mixed, one can disperse as fine droplets in the other, forming an emulsion. These emulsions are stabilized by surface-active compounds, which in drug discovery can include the test compounds themselves, such as asphaltenes, resins, or organic acids [57] [58]. Stable emulsions prevent clear phase separation, leading to inaccurate volume measurements and erroneous Log P values. In industrial contexts like petroleum production, emulsions increase viscosity, accelerate corrosion, and complicate downstream processing [57], highlighting their disruptive potential in laboratory settings.
Comparative Experimental Data
The stability of emulsions is influenced by multiple factors, as shown in studies of petroleum emulsions, which provide a relevant model for understanding this pitfall.
Table 2: Factors Affecting Emulsion Formation and Stability
| Factor | Effect on Emulsion Stability | Experimental Evidence |
|---|---|---|
| Stabilizing Agents | Asphaltenes, resins, fine solids, and surfactants adsorb at the oil-water interface, forming rigid films that prevent droplet coalescence [57]. | The presence of 5–30% resins and 3–20% asphaltenes can extend emulsion stability to over four weeks [57]. |
| Operational Conditions | Temperature, pH, shear forces, and droplet size influence stability [57]. | Higher temperatures and longer residence times can lead to more stable emulsions and increased sludge formation [58]. |
| Ferric Ions (Fe³⁺) | Act as catalysts, dramatically increasing asphaltene deposition and emulsion stability [58]. | Fe³⁺ can increase sludge mass over twofold and the average particle size tenfold [58]. |
| Acid Concentration | Stronger acids like HCl promote more sludge and stable emulsions compared to weaker acids [58]. |
Protocols for Mitigation
- Use of Anti-Emulsifying Agents: Adding formulation additives like didecyl dimethyl ammonium chloride can effectively prevent emulsion and sludge formation [58].
- Centrifugation: Employing centrifugation after mixing can accelerate phase separation, though it may not be sufficient for highly stable emulsions [57].
- Methodological Shift: Adopting anisotropic RP-HPLC methods completely avoids the issue of liquid-liquid emulsion formation, as the partitioning occurs between a liquid mobile phase and a solid stationary phase [45].
Pitfall 2: Analytic Detection Limits and Quantification
The Problem and Its Impact
Accurate quantification of the solute concentration in the aqueous or organic phase is fundamental to calculating Log P. Isotropic methods like shake-flask can struggle with compounds at the extremes of lipophilicity. For highly lipophilic compounds (Log P > 4), the concentration in the aqueous phase is exceedingly low, challenging accurate detection and increasing the method's susceptibility to interference from impurities [27] [45]. This limits the effective measurement range of the shake-flask method to approximately -2 < Log P < 4 [45].
Comparative Experimental Data
Advanced methodologies have been developed to extend the measurable range and improve detection.
Table 3: Methods for Overcoming Detection Limits
| Method | Principle | Effective Log P Range | Key Advantage |
|---|---|---|---|
| Shake-Flask (Isotropic) | Direct partitioning between n-octanol and water followed by concentration analysis [45]. | -2 to 4 [45] | Considered the "gold standard" with accurate results [45]. |
| Shake-Flask with LC/MS MS | Partitioning in mixtures of up to 10 compounds, with quantification via liquid chromatography and tandem mass spectrometry [29]. | Extended range for mixtures | High-throughput capacity for primary screening within drug discovery [29]. |
| RP-HPLC (Anisotropic) | Correlates a compound's retention time on a C18 column with its Log P using a calibration curve [45]. | 0 to 6 (can be broader) [45] | Higher speed, no emulsion issues, and broader detection range [45]. |
| High-Throughput Polymer-Water (Isotropic) | Measures partition coefficient (Ppw) between a plasticized PVC film and water in a 96-well format [27]. | High-throughput friendly | Fast, small sample volume, and amenable to automation [27]. |
Protocols for Mitigation
- RP-HPLC Method 1 (Fast Screening): This anisotropic method uses a standard equation (Log P = a × log k + b) derived from reference compounds. It can determine Log P for compounds with values below 6 within 30 minutes, making it ideal for early-stage screening [45].
- RP-HPLC Method 2 (High Accuracy): A more accurate anisotropic protocol replaces log k with log kw (the capacity factor extrapolated to zero organic modifier). This accounts for the effect of the organic modifier on retention time, yielding a better correlation coefficient (R² = 0.996) and more accurate Log P values for late-stage development [45].
- Solid-Phase Microextraction (SPME): This technique can be applied to estimate Log P for very hydrophobic compounds (Log P > 6) by measuring partitioning between water and a solid-phase fiber [27].
Pitfall 3: The Influence of Impure or Ionizable Compounds
The Problem and Its Impact
The presence of impurities or the ionizable nature of a compound can severely skew lipophilicity measurements. In isotropic methods, impurities with surface-active properties can stabilize emulsions [58]. Furthermore, the shake-flask method measures the partition coefficient (Log P) only for the neutral, non-ionized form of a molecule. For ionizable compounds, the distribution coefficient (Log D), which accounts for all ionized and non-ionized forms present at a specific pH, is the relevant parameter. Failure to control pH and distinguish between Log P and Log D is a common source of error [45].
Comparative Experimental Data
Table 4: Addressing Impurity and Ionization Challenges
| Challenge | Impact on Isotropic Methods | Impact on Anisotropic Methods | Solution |
|---|---|---|---|
| Compound Impurities | Can stabilize emulsions or interfere with analytical detection, leading to inaccurate results [58] [45]. | RP-HPLC is milder and less sensitive to impurities due to the separation step, which can resolve the analyte from contaminants [45]. | Purify compounds prior to shake-flask analysis or use RP-HPLC for impure samples. |
| Compound Ionization | Log P is only for neutral species. Log D varies with pH and must be specified with the pH value (e.g., Log DpH7.4) [45]. | Standard RP-HPLC may not be valid for charged molecules due to complex retention behavior [27]. | Use controlled pH buffers in shake-flask to measure Log D. The polymer-water method can be extended to determine distribution coefficients and pKa of charged solutes [27]. |
Protocols for Mitigation
- pH-Control in Shake-Flask: Use buffered aqueous solutions to maintain a specific pH when measuring the distribution coefficient (Log D) for ionizable compounds [45].
- Extended Polymer-Water Protocol: The high-throughput PVC-water method can be adapted to determine the distribution coefficient and pKa of charged solutes. For example, this protocol successfully measured a log Ppw of 4.83 for the neutral form of econazole and 1.68 for its cationic form [27].
- Computer Simulation: In silico methods can predict Log P rapidly and are cost-effective, but their accuracy depends on the software's algorithm and training set, making them less reliable for novel chemical structures [45].
The Scientist's Toolkit: Essential Research Reagents and Materials
Table 5: Key Reagent Solutions for Lipophilicity Research
| Reagent/Material | Function | Application Context |
|---|---|---|
| n-Octanol and Water | The standard isotropic solvent system for measuring partition coefficients (Log P) [29] [45]. | Shake-flask method. |
| Buffered Solutions | To control pH for accurate measurement of distribution coefficients (Log D) for ionizable compounds [45]. | Shake-flask, RP-HPLC. |
| C18 Chromatographic Column | The stationary phase for anisotropic lipophilicity measurement via RP-HPLC [45]. | RP-HPLC methods. |
| Reference Compounds | A set of compounds with known Log P values for calibrating RP-HPLC methods [45]. | RP-HPLC methods. |
| Plasticized PVC Film | A polymer phase for high-throughput partitioning studies in a 96-well format [27]. | High-throughput isotropic screening. |
| Anti-Emulsifying Agent | Prevents or breaks emulsions formed during mixing of immiscible phases [58]. | Shake-flask method. |
| Medium Chain Triglycerides (MCT) | A biocompatible oil phase for forming lipid-based delivery systems like nanoemulsions [56]. | Studies of partitioning in complex anisotropic systems. |
Workflow and Strategic Pathway
The following diagram illustrates the decision-making pathway for selecting the appropriate lipophilicity measurement method based on the nature of the compound and the research goals, while also highlighting key pitfalls to avoid.
Decision Pathway for Lipophilicity Measurement Methods
Selecting between isotropic and anisotropic methods for lipophilicity assessment requires a strategic balance. Isotropic methods like shake-flask are the gold standard for pure, non-ionizable compounds with moderate Log P but are prone to emulsions and detection limitations. Anisotropic methods like RP-HPLC offer high-throughput, a wider dynamic range, and circumvent emulsion issues, making them superior for early screening and challenging compounds. The choice hinges on project stage, compound characteristics, and the required balance between speed and accuracy. A thorough understanding of the associated pitfalls—emulsion formation, detection limits, and compound purity/ionization—is essential for generating reliable data that effectively de-risks the drug development pipeline.
Lipophilicity is a fundamental physicochemical property in drug discovery, influencing both pharmacokinetic and pharmacodynamic behavior [1]. It is crucial for a compound's absorption, distribution, metabolism, excretion, and toxicity (ADMET) profile [1]. Lipophilicity is most simply defined by the partition coefficient, log P, which describes the equilibrium distribution of a solute between an immiscible organic solvent, typically n-octanol, and an aqueous phase, typically water [1] [7]. When determined at a specific pH, accounting for the ionization state of the compound, it is expressed as the distribution coefficient, log D [1].
A critical distinction exists between isotropic and anisotropic lipophilicity measurements [14] [1]. Isotropic lipophilicity, determined in a system like n-octanol/water, results from the net sum of hydrophobicity minus polarity, where ionic charges have no defined spatial location [14] [1]. In contrast, anisotropic lipophilicity is determined using systems with structured, anisotropic media, such as the stationary phases in chromatography (e.g., C18) or liposomes, where ionic charges have a fixed location [14]. This anisotropic environment is generally considered to better reflect the distribution of a molecule between a biological membrane and extracellular fluids, making it a highly relevant parameter for predicting in vivo behavior [14]. This guide provides a comparative analysis of strategies for measuring lipophilicity, with a focus on optimizing analytical throughput for mixture analysis while navigating the analytical challenges posed by ion-pair interactions.
Comparative Analysis of Lipophilicity Measurement Techniques
A variety of experimental methods exist for determining lipophilicity, each with distinct advantages, limitations, and applicability for mixture analysis. The following table provides a structured comparison of these key techniques.
Table 1: Comparison of Key Lipophilicity Measurement Methods
| Method | Key Principle | Throughput | Suitability for Mixtures | Key Considerations on Ion Pairing | Best Use Case |
|---|---|---|---|---|---|
| Shake-Flask (Isotropic) [1] [7] | Direct measurement of solute concentration in n-octanol and water phases after equilibrium. | Low; labor-intensive and time-consuming [7]. | Low; typically requires pure compounds [7]. | Apparent lipophilicity can be significantly influenced by lipophilic counter-ions, which can increase the observed log P value [59]. | Gold standard for direct measurement; ideal for validating other methods for a small number of compounds [1] [7]. |
| Slow-Stirring (Isotropic) [7] | Modification of shake-flask using slow stirring to prevent emulsion formation. | Very Low; can require 2-3 days to reach equilibrium [7]. | Not specified in search results. | Similar concerns as shake-flask regarding ion pairing. | More accurate for compounds with log P > 4.5 by avoiding emulsions [7]. |
| Vortex-Assisted Liquid-Liquid Microextraction (VALLME) (Isotropic) [7] | Microextraction using vortex agitation to disperse n-octanol into fine droplets in water, drastically increasing surface area. | High; equilibrium is achieved in ~2 minutes [7]. | Designed for single compounds, but high speed allows for rapid sequential analysis. | Ion-pairing effects are still expected to be present in this system. | High-throughput, direct log P measurement with low solvent and sample consumption [7]. |
| Reversed-Phase Chromatography (Anisotropic) [14] [1] | Indirect measurement where retention factor (e.g., log k, RM0) correlates with lipophilicity. | High; multiple compounds can be analyzed in a single run [14] [60]. | Excellent; inherently designed for the analysis of mixtures [14]. | The stationary phase's fixed ionic charges make the system fundamentally different. Ion-pairing may not be the primary mechanism; the Galvani potential difference is a key factor for ionic species [59]. | High-throughput screening of compound libraries and for compounds with limited solubility [14] [1]. |
High-Throughput Experimental Protocols
Protocol 1: High-Throughput Shake-Flask for Mixtures
This protocol adapts the traditional shake-flask method for higher throughput by leveraging modern liquid chromatography-tandem mass spectrometry (LC-MS/MS) for analysis [60].
- Step 1: Mixture Preparation. Combine up to 10 compounds into a single mixture. Pre-dissolve the mixture in either the n-octanol phase or the aqueous buffer phase [60].
- Step 2: Partitioning. Add equal volumes of the second phase (e.g., buffer if compounds are in octanol) to the solution. Vortex the mixture vigorously to ensure thorough mixing and then allow it to equilibrate until the partitioning reaches equilibrium [60].
- Step 3: Phase Separation. After equilibrium is reached, centrifuge the vials to achieve complete separation of the n-octanol and aqueous layers.
- Step 4: Quantitative Analysis. Dilute samples from each phase as needed and analyze them using LC-MS/MS. The use of mass spectrometry is critical as it enables the specific quantification of individual compounds within the mixture based on their mass-to-charge ratios [60].
- Step 5: Data Calculation. Calculate the log P for each compound using the ratio of its concentration in the n-octanol phase to its concentration in the aqueous phase. Validation Note: It is crucial to assess potential interactions (e.g., ion-pairing between compounds in the mixture) that could lead to aberrant results by comparing with measurements of individual compounds [60].
Protocol 2: Anisotropic Lipophilicity by Reversed-Phase UHPLC
This protocol determines chromatographic lipophilicity, which serves as an excellent anisotropic descriptor [14] [9].
- Step 1: Column Selection. Select an appropriate UHPLC column. For standard reversed-phase analysis, a C18 column (e.g., 50 mm x 2.1 mm, 1.8 µm) is common. For compounds capable of π-π interactions, a phenyl column may offer different selectivity [61] [9].
- Step 2: Mobile Phase and System Setup. Use isocratic elution with binary (e.g., methanol/water or acetonitrile/water) or ternary (e.g., methanol/acetonitrile/water) mobile phases. The organic modifier volume fraction typically ranges from 0.5 to 0.85 [9]. Maintain the column temperature at a constant level (e.g., 25°C) [9].
- Step 3: Sample Analysis. Dissolve test compounds in a suitable solvent like acetone. After injection, record the retention time (tr) for each analyte and the dead time (t0) of the system [9].
- Step 4: Data Processing. Calculate the capacity factor (log k) for each compound using the formula: k = (tr - t0) / t0 [9]. The value of log k, often extrapolated to 0% organic modifier (log k0), is a direct measure of the compound's anisotropic lipophilicity in the chosen chromatographic system [14] [9].
Table 2: Research Reagent Solutions for Lipophilicity Screening
| Reagent / Material | Function in the Protocol |
|---|---|
| n-Octanol (HPLC grade) [7] | The standard nonpolar phase for isotropic (shake-flask) lipophilicity measurements. |
| Aqueous Buffer (e.g., Phosphate Buffer, pH 7.4) [1] | The aqueous phase for shake-flask; controls pH to determine log D. |
| Reversed-Phase UHPLC Column (C18 or Phenyl) [61] [9] | The anisotropic stationary phase for chromatographic lipophilicity determination. |
| HPLC-grade Organic Modifiers (Methanol, Acetonitrile) [9] | Components of the mobile phase in RP-UHPLC that control elution strength and retention. |
| LC-MS/MS System [60] | Enables specific and sensitive quantification of individual compounds in mixtures from shake-flask experiments. |
Navigating the Challenge of Ion Pair Interactions
The behavior of ionizable compounds, particularly in isotropic systems, presents a significant challenge. While it was historically thought that ion-pairing—the formation of neutral complexes between charged drugs and their counter-ions—was the primary mechanism enabling the partitioning of ions into organic phases, modern electrochemical studies suggest an alternative explanation [59].
Research using techniques like cyclic voltammetry at the interface between two immiscible electrolyte solutions (ITIES) indicates that the standard lipophilicity of ions is intrinsic and not influenced by counter-ions [59]. The observed increase in apparent lipophilicity in the presence of lipophilic anions is instead fully accounted for by a resulting increase in the Galvani potential difference between the two phases [59]. This fundamental understanding is crucial for method selection and data interpretation. Anisotropic chromatographic systems, with their fixed ionic charges, inherently operate under a different thermodynamic principle, which can simplify the lipophilicity assessment of ionizable compounds by avoiding the complicating factors of the shake-flask system [14] [59].
The following diagram illustrates the key decision-making workflow for selecting an appropriate high-throughput strategy, integrating considerations for mixture analysis and ionizable compounds.
Diagram Title: Workflow for Selecting a High-Throughput Lipophilicity Strategy
The choice between isotropic and anisotropic methods for high-throughput lipophilicity screening hinges on the specific goals of the research. For the direct measurement of the classical log P parameter with mixture compatibility, the shake-flask method coupled with LC-MS/MS provides a robust, validated solution, though it requires vigilance for potential intermolecular interactions [60]. For higher throughput and a potentially more biologically relevant lipophilicity parameter, reversed-phase chromatography is an outstanding tool, capable of simultaneously profiling numerous compounds in a single run while sidestepping some of the complexities associated with ionic partitioning in isotropic systems [14] [9] [59]. Understanding that the apparent lipophilicity of ions in shake-flask experiments is governed more by the Galvani potential difference than by ion-pair formation is a critical insight that informs the selection and interpretation of these high-throughput strategies [59].
Addressing the Limitations of Calculated (in silico) Log P Values
Lipophilicity, a key physicochemical property, governs a compound's behavior in biological systems, influencing every aspect of its absorption, distribution, metabolism, excretion, and toxicity (ADMET) profile [1]. Traditionally expressed as the logarithm of the n-octanol/water partition coefficient (Log P), this parameter serves as a fundamental determinant in drug discovery and development [1]. The accurate prediction and measurement of lipophilicity enables researchers to optimize lead compounds for desirable pharmacokinetic properties and minimize toxicity risks [53]. While computational (in silico) methods for Log P determination offer significant advantages in speed and resource requirements, they present substantial limitations that researchers must acknowledge and address through experimental verification [1] [7]. This guide objectively compares the performance of calculated Log P values with experimental alternatives, providing researchers with a framework for selecting appropriate methodologies based on their specific research needs and compound characteristics.
Understanding Isotropic vs. Anisotropic Lipophilicity
The distinction between isotropic and anisotropic lipophilicity represents a crucial conceptual framework in modern lipophilicity assessment [1]. Isotropic lipophilicity refers to partitioning behavior in systems where the non-aqueous phase is an isotropic organic solvent, typically n-octanol, where ionic charges have no defined spatial location [14] [1]. In contrast, anisotropic lipophilicity involves partitioning where the non-aqueous phase has a defined structural organization with fixed spatial charge distribution, such as chromatographic stationary phases, artificial membranes, liposomes, or micelles [14] [1]. These anisotropic systems better mimic the organized nature of biological membranes, potentially offering more physiologically relevant lipophilicity measurements for predicting in vivo behavior [14].
Table 1: Comparison of Isotropic and Anisotropic Lipophilicity Systems
| Feature | Isotropic Lipophilicity | Anisotropic Lipophilicity |
|---|---|---|
| Non-aqueous Phase | Isotropic organic solvent (n-octanol) | Organized phases (stationary phases, membranes, liposomes) |
| Spatial Charge Distribution | No defined location | Fixed spatial organization |
| Intermolecular Forces Encoded | Hydrophobicity minus polarity [1] | Hydrophobicity, polarity, plus ionic bonds [1] |
| Biological Relevance | Fundamental physicochemical parameter | Better mimics biological membrane interactions [14] |
| Common Determination Methods | Shake-flask, slow-stirring [7] | Chromatographic approaches (HPLC, TLC) [14] |
Figure 1: Isotropic vs. Anisotropic Lipophilicity Assessment Systems
Limitations of Calculated Log P Methods
Accuracy and Variability Concerns
In silico Log P prediction methods demonstrate significant limitations in accuracy and consistency, particularly for complex chemical structures. Different computational algorithms frequently produce substantially divergent Log P values for the same compound, with variations exceeding 1.86 log units for highly lipophilic substances [62]. This level of discrepancy is functionally significant in drug discovery, as a single log unit difference translates to a tenfold change in partitioning behavior. The reliability of computational methods decreases notably for highly complex compounds, including those with extensive conformational flexibility, specific structural motifs, or metal complexes [62] [63]. These inaccuracies stem from fundamental challenges in modeling the intricate intermolecular forces and conformational dynamics that govern partitioning behavior [62].
Conformational Flexibility Challenges
Calculated Log P methods face particular difficulties with flexible compounds that can adopt multiple conformations in different environments. Experimental evidence demonstrates that flexible molecules like phenylalkanoic acids and pro-perfume HaloscentD homologues exhibit significantly different Log P values depending on chromatographic conditions, suggesting that molecular conformation profoundly influences apparent lipophilicity [62]. Computational methods often fail to account for these conformation-dependent lipophilicity changes, as they typically model compounds in a single, low-energy state rather than considering the dynamic conformational ensemble that exists in solution [62]. This limitation is especially problematic for drug-like molecules that frequently contain rotatable bonds and flexible chains that can adapt to different molecular environments.
Scaffold Dependency and Training Set Limitations
The predictive performance of in silico Log P methods heavily depends on the chemical space represented in their training data. When compounds fall outside this chemical space, prediction accuracy decreases substantially. For instance, a consensus model for platinum complexes showed a root mean squared error (RMSE) of 0.62 for compounds within the training set chemical space, but this error increased to 1.3 for a series of phenanthroline-containing Pt(IV) derivatives not represented in the training data [63]. This scaffold dependency presents a significant challenge for drug discovery programs exploring novel chemical entities or underrepresented structural classes, as calculated values for such compounds may be particularly unreliable [63].
Table 2: Performance Limitations of Calculated Log P Methods
| Limitation Category | Specific Issue | Impact on Drug Discovery |
|---|---|---|
| Accuracy & Variability | Discrepancies >1.86 log units between algorithms [62] | Misleading structure-activity relationships; poor prediction of ADMET properties |
| Conformational Flexibility | Failure to account for environment-dependent conformational changes [62] | Inaccurate prediction of membrane permeation and tissue distribution |
| Scaffold Dependency | High prediction errors for novel scaffolds outside training sets [63] | Limited utility for innovative drug discovery programs |
| Method Selection | No single algorithm performs optimally across all chemical classes [7] | Requires method validation for each chemical series |
Experimental Methodologies for Log P Determination
Gold Standard: Shake-Flask Method
The shake-flask method remains the gold standard for experimental Log P determination, recommended by the Organization for Economic Co-operation and Development (OECD) [7]. This direct measurement approach involves dissolving the compound in a biphasic system of n-octanol and water, vigorously shaking to establish partitioning equilibrium, separating the phases, and quantifying solute concentrations in each phase, typically using liquid chromatography [1] [7]. While highly accurate for Log P values ranging from -2 to 4, the method becomes challenging for highly lipophilic compounds (Log P > 4) due to detection limit issues in the aqueous phase [7]. Additional limitations include lengthy equilibrium times (1-24 hours), substantial solvent consumption, emulsion formation, and unsuitability for degradable compounds or surface-active materials [7].
Chromatographic Approaches
Chromatographic methods provide valuable alternatives for lipophilicity assessment, particularly for compounds challenging to analyze via shake-flask approaches. These methods correlate retention factors (log k) with partition coefficients through established mathematical relationships [62] [1]. Reverse-phase high-performance liquid chromatography (RP-HPLC) and reverse-phase thin-layer chromatography (RP-TLC) enable rapid determination with minimal sample consumption and insensitivity to impurities [62] [14]. These approaches are particularly advantageous for high-throughput screening in early drug discovery stages. However, method-specific limitations include stationary phase variability, mobile phase composition effects, and the potential for conformational changes induced by chromatographic conditions that may influence results [62] [14].
Specialized and Emerging Techniques
Several specialized methodologies address specific limitations of traditional approaches. The slow-stirring method minimizes emulsion formation through gentle agitation rather than shaking, providing improved accuracy for highly lipophilic compounds (Log P > 4.5) but requiring extended equilibration times of 2-3 days [7]. Vortex-assisted liquid-liquid microextraction (VALLME) dramatically reduces equilibrium time to approximately 2 minutes by creating fine n-octanol microdroplets through vigorous vortexing, significantly increasing surface area for partitioning [7]. Flow-based methods automate the partitioning process using continuous flow systems, standardizing measurements and enabling higher throughput [7]. The water-plug aspiration/injection method addresses phase separation challenges for highly lipophilic compounds by using a water plug in the sampling needle to prevent n-octanol contamination during aqueous phase collection [7].
Figure 2: Experimental Method Selection Workflow
Comparative Performance Analysis
Method Capabilities and Limitations
Table 3: Comprehensive Comparison of Log P Determination Methods
| Method | Log P Range | Throughput | Sample Consumption | Key Advantages | Key Limitations |
|---|---|---|---|---|---|
| In Silico Prediction | Unlimited (theoretical) | Very High | None | Rapid screening; no compound needed [1] [7] | Inaccurate for novel scaffolds; high variability between algorithms [62] [63] |
| Shake-Flask | -2 to 4 [7] | Low | High (mg) | Gold standard; direct measurement [1] [7] | Time-consuming; emulsion issues; not for highly lipophilic compounds [7] |
| Slow-Stirring | Extended range (>4.5) [7] | Very Low | High (mg) | Accurate for highly lipophilic compounds; minimal emulsions [7] | Very long equilibrium (2-3 days) [7] |
| RP-HPLC | -3 to +5 (extendable to 8) [62] | Medium | Low (μg) | Rapid; low sample consumption; insensitive to impurities [62] | Affected by conformational changes [62] |
| RP-TLC | Varies with system | High | Very Low (ng) | Multiple samples simultaneously; reduced cost [14] | Less precision than HPLC [14] |
| VALLME | -2 to 4 [7] | Medium | Low (μg) | Fast equilibrium (2 min) [7] | Limited track record; optimization required [7] |
Case Study: Flexible Compound Analysis
A compelling case study highlighting the limitations of calculated Log P values involves the analysis of phenylalkanoic acids and HaloscentD homologues, flexible compounds with conformational freedom [62]. Experimental determination using different chromatographic methods yielded significantly different Log P values for the same compounds, with molecular modeling suggesting that chromatographic conditions induced specific molecular conformations that influenced apparent lipophilicity [62]. This conformational dependence of lipophilicity presents particular challenges for computational methods, which typically model compounds as rigid structures or in single low-energy conformations. For such flexible compounds, chromatographic methods provide a Log P range reflecting different conformational states rather than a single discrete value, potentially offering more physiologically relevant information [62].
Impact on Drug Discovery Outcomes
Inaccurate Log P estimation contributes significantly to drug development failures, accounting for 10%-15% of clinical phase attrition [53]. Overreliance on calculated values during lead optimization can lead to suboptimal compound selection with poor pharmacokinetic profiles or unmanageable toxicity [53]. The "molecular obesity" trend—designing increasingly large and lipophilic molecules to enhance potency—often results from overoptimizing for target affinity without adequate experimental verification of lipophilicity [1]. Such compounds frequently exhibit poor solubility, promiscuous target interactions, and increased metabolic clearance, ultimately failing in development despite promising in vitro activity [1].
Integrated Workflow for Optimal Log P Determination
Strategic Method Selection
An optimal Log P determination strategy integrates both computational and experimental approaches, leveraging their complementary strengths while mitigating their individual limitations. In silico methods provide maximum value during virtual screening and early compound design, enabling rapid assessment of large chemical libraries and establishment of initial structure-lippphilicity relationships [1] [7]. As compounds advance through the discovery pipeline, experimental verification becomes increasingly critical, with method selection guided by specific compound characteristics and research objectives. For routine compounds within standard Log P ranges, shake-flask methods provide definitive values, while chromatographic approaches offer practical alternatives for high-throughput applications or limited compound availability [62] [14] [1]. Specialized methodologies address challenges with highly lipophilic compounds, flexible molecules, or novel scaffolds requiring anisotropic assessment [62] [7].
The Scientist's Toolkit: Essential Research Reagents and Materials
Table 4: Essential Research Reagents and Materials for Log P Determination
| Reagent/Material | Function/Application | Key Considerations |
|---|---|---|
| n-Octanol | Standard nonpolar phase for isotropic lipophilicity [7] | High purity; pre-saturated with aqueous phase |
| Buffer Solutions | Aqueous phase for shake-flask; mobile phase modifier for chromatography [1] | pH control; ionic strength adjustment |
| Reverse-Phase HPLC Columns | Stationary phases for chromatographic lipophilicity assessment [62] [1] | Various chain lengths (C18, C8, C4); different manufacturers |
| HPTLC Plates | Stationary phases for thin-layer chromatography [14] | Different modifications (RP-2, RP-8, RP-18) [14] |
| Organic Modifiers | Mobile phase components for chromatographic methods [62] [14] | Acetone, acetonitrile, methanol, 1,4-dioxane [14] |
| Liposomes | Artificial membranes for anisotropic lipophilicity [1] | Composition mimicking biological membranes |
| Reference Compounds | Method calibration and validation | Compounds with known Log P values |
Calculated Log P values provide invaluable tools for initial compound screening and design, but their significant limitations necessitate experimental verification for critical decision-making in drug development. The optimal lipophilicity assessment strategy combines computational efficiency with experimental rigor, selecting methodologies appropriate for specific compound characteristics and research stages. For flexible molecules, anisotropic methods particularly provide valuable insights into conformation-dependent lipophilicity that may better predict in vivo behavior [62] [14]. As drug discovery increasingly explores challenging chemical space, including complex natural products and novel scaffolds, researchers must maintain a critical perspective on calculated Log P values while implementing robust experimental verification workflows to ensure accurate lipophilicity assessment throughout the drug development process.
Lipophilicity is a fundamental physicochemical property in drug discovery, defined as the partitioning equilibrium of a solute between water and an immiscible organic solvent [1]. It is crucial for understanding a compound's pharmacokinetic and pharmacodynamic behavior, influencing every step of ADMET (absorption, distribution, metabolism, excretion, and toxicity) [1] [64]. Lipophilicity is most simply expressed as the decimal logarithm of the partition coefficient, Log P, traditionally measured in an n-octanol/water system [1] [7].
A critical distinction exists between isotropic and anisotropic lipophilicity. Isotropic lipophilicity, determined in a system with a homogeneous organic solvent like n-octanol, results from the net sum of hydrophobicity minus polarity. In contrast, anisotropic lipophilicity is assessed using anisotropic media such as artificial membranes, liposomes, or chromatographic stationary phases; it incorporates different interaction forces, including ionic bonds, and is considered a better model for a compound's behavior in biological systems where molecules interact with organized phospholipid membranes [1] [14].
Chromatographic techniques, particularly Reversed-Phase High-Performance Liquid Chromatography (RP-HPLC) and High-Performance Thin-Layer Chromatography (HPTLC), are widely used for the indirect, high-throughput determination of lipophilicity. This guide provides a method-specific troubleshooting comparison for these two techniques, focusing on column selection for RP-HPLC and mobile phase optimization for HPTLC, framed within the context of anisotropic lipophilicity assessment.
Core Concepts: Isotropic vs. Anisotropic Lipophilicity Assessment
Chromatography functions as an indirect method for determining lipophilicity. The retention of a compound on a reversed-phase stationary phase correlates with its affinity for a lipophilic environment. The derived chromatographic parameters, such as the capacity factor (log k) or the extrapolated value for zero organic modifier (log kw or RMw), serve as established descriptors of molecular lipophilicity [64] [65].
The following workflow outlines the decision process for selecting and troubleshooting the appropriate lipophilicity assessment method based on research goals.
RP-HPLC Column Selection: A Comparative Guide
The choice of stationary phase in RP-HPLC is paramount, as it directly defines the anisotropic environment and the intermolecular forces governing retention. Different columns model different aspects of biological partitioning [64] [66] [65].
Troubleshooting Data Variability Across Stationary Phases
Data inconsistency when using different columns is a common challenge. The table below summarizes the characteristics and applications of common stationary phases to guide selection and troubleshooting.
Table 1: Troubleshooting RP-HPLC Stationary Phases for Lipophilicity Assessment
| Stationary Phase | Key Characteristics & Interactions | Best For | Common Issues & Troubleshooting |
|---|---|---|---|
| C18 (Octadecyl) | Strong hydrophobic interactions; long alkyl chains provide the highest retentivity [64] [66]. | Standard, non-polar to medium-polar compounds; the default choice for establishing lipophilicity scales [66]. | Too strong retention for highly lipophilic compounds → Switch to C8 or phenyl. Poor retention of very polar compounds → Use IAM or consider HILIC. |
| C8 (Octyl) | Moderate hydrophobic interactions; shorter chains provide weaker retention than C18 [64] [66]. | Highly lipophilic compounds that are overly retained on C18; a good alternative for a wider log P range [64] [66]. | Weaker retention might lead to poor resolution for very polar analytes. |
| Phenyl | Hydrophobic interactions + π-π stacking with analyte aromatic systems [66]. | Compounds containing aromatic rings or conjugated systems; provides selectivity based on electronic structure [66]. | Retention can be highly sensitive to substituents on analyte's aromatic rings. Not ideal for aliphatic compounds. |
| Immobilized Artificial Membrane (IAM) | Phosphatidylcholine-bound silica; models biological membrane partitioning; involves hydrophobic and ionic interactions [64]. | Polar or ionized compounds; provides a more biologically relevant anisotropic lipophilicity measure for permeability [64]. | Retention is influenced by pH and ionic strength due to ionic interactions. More complex method development. |
| Pentafluorophenyl (PFP) | Strong dipole-dipole and π-π interactions, in addition to hydrophobic effects [65]. | Isomeric separations and compounds with strong dipoles or electron-deficient aromatic rings. | Selectivity can be difficult to predict for novel compounds without prior scouting. |
Experimental Protocol: Lipophilicity Determination by RP-HPLC
This standard protocol can be adapted using the columns described in Table 1 [66] [45].
- System Setup: Use an HPLC system with a UV/VIS or DAD detector. The column thermostat should be set to a consistent temperature (e.g., 22°C or 37°C to mimic physiological conditions) [65].
- Mobile Phase Preparation: Prepare a binary mobile phase consisting of water (often with 0.1% formic acid) and an organic modifier (typically methanol or acetonitrile). Prepare at least five different mixtures covering a broad range of organic modifier (e.g., 50-90%).
- Calibration: Inject a dead time marker (e.g., urea or sodium nitrate) to determine the column's void time (t0).
- Analysis: Inject the analyte solutions under isocratic conditions for each mobile phase composition.
- Data Calculation: For each run, calculate the capacity factor, k = (tR - t0)/t0, where tR is the analyte retention time. Plot log k against the volume fraction of the organic modifier (φ). The y-intercept of the linear regression line (log kw) is the chromatographic lipophilicity index [45] [65].
- Validation: For higher accuracy, especially in late-stage development, the log kw value is used in a calibration curve built with reference compounds of known log P, yielding a more accurate experimental log P value [45].
HPTLC Mobile Phase Optimization: A Comparative Guide
In HPTLC, the stationary phase is often a fixed C18 or C8 plate, making the mobile phase the primary variable for optimizing separation and tuning lipophilicity measurement [64] [67].
Troubleshooting Mobile Phase Performance
The choice of organic modifier significantly impacts the retention mechanism and the resulting lipophilicity parameter (RMw). The table below compares common modifiers.
Table 2: Troubleshooting HPTLC Mobile Phases for Lipophilicity Assessment
| Organic Modifier | Key Properties & Impact on Retention | Best For | Common Issues & Troubleshooting |
|---|---|---|---|
| Methanol | Strong proton-donor ability; high polarity; forms a monolayer on the stationary phase, mimicking n-octanol's H-bonding [64] [45]. | General purpose; considered the best solvent for mimicking shake-flask Log P; provides the largest range of RMw values [64]. | High viscosity can lead to longer development times. |
| Acetonitrile | Dipolar aprotic solvent; strong proton-acceptor; different selectivity from methanol, often resulting in lower retention [64] [66]. | Compounds where methanol gives poor resolution; can be beneficial for specific selectivity needs. | Often provides a smaller range of RMw values, potentially reducing discriminatory power [64]. |
| Acetone | Dipolar aprotic solvent; can be used to establish specific anisotropic lipophilicity scales with aprotic solvents [64] [14]. | Analyzing succinimide derivatives and other specific compound classes; exploring different selectivity [14]. | Less commonly used; requires method validation against standard modifiers. |
| Dioxane | Aprotic solvent with weak polarity; can be particularly beneficial in HPTLC for certain compound sets [64]. | Can be "particularly beneficial" as an organic modifier in HPTLC, offering unique selectivity [64]. | High toxicity requires careful handling and disposal. |
Experimental Protocol: Lipophilicity Determination by RP-HPTLC
This standard protocol leverages the modifiers described in Table 2 [64] [17] [2].
- Plate Preparation: Use commercial RP-18W or RP-8 F254 HPTLC plates. Spot the analyte solutions (~0.5-1 µL of 0.5 mg/mL solution) onto the baseline.
- Mobile Phase Preparation: Prepare a series of mobile phases with varying concentrations of the organic modifier (e.g., methanol, acetonitrile) in water, often acidified with 0.1% formic acid to suppress silanol effects [2].
- Chromatogram Development: Develop the plates in a pre-saturated vertical chamber under isocratic conditions until the mobile phase front travels a fixed distance.
- Detection & Calculation: Detect spots under UV light at 254 nm. Calculate the RM value as RM = log(1/RF - 1). Plot RM against the volume fraction of the organic modifier (φ). The y-intercept of the linear regression line (RMw) is the chromatographic lipophilicity index [64] [17].
- Analysis: Compare RMw values obtained with different modifiers to ensure consistency and reliability of the lipophilicity assessment.
The Scientist's Toolkit: Essential Research Reagents and Materials
The following table details key materials required for the experiments described in this guide.
Table 3: Essential Research Reagents and Materials for Lipophilicity Assessment
| Item | Function / Application | Examples / Specifications |
|---|---|---|
| RP-HPLC Columns | Provides the anisotropic stationary phase for separation and lipophilicity measurement. | C18, C8, Phenyl, IAM, PFP columns (e.g., 150 mm x 4.6 mm, 5 µm) [64] [66] [65]. |
| HPTLC Plates | The planar stationary phase for high-throughput lipophilicity screening. | RP-18F254, RP-8F254, RP-2F254 plates [64] [17]. |
| Organic Modifiers | Component of the mobile phase that controls retention and selectivity. | HPLC/Grade Methanol, Acetonitrile, Acetone, Dioxane [64] [66] [14]. |
| Aqueous Buffer / Acid | Aqueous component of the mobile phase; controls pH and ionic strength. | Deionized Water, Phosphate Buffer (pH 7.4), Formic Acid (0.1%) [64] [2]. |
| Reference Compounds | For system calibration and validation of experimental Log P values. | Compounds with known Log P (e.g., acetophenone, chlorobenzene, phenanthrene) [45]. |
| Dead Time Markers | To determine the void volume (t0) of an HPLC system. | Urea or Sodium Nitrate [65]. |
Integrated Data Analysis and Method Comparison
The final step in troubleshooting is validating the chromatographic data against computational and other experimental methods.
Chemometric Analysis for Data Validation
Advanced statistical analysis is routinely used to validate lipophilicity parameters and understand method similarities [64] [66] [65].
- Principal Component Analysis (PCA): Reduces the dimensionality of multiple lipophilicity parameters (e.g., log kw from different columns, RMw from different modifiers) to reveal underlying patterns and groupings of compounds or methods [64] [66].
- Hierarchical Cluster Analysis (HCA): Classifies compounds or chromatographic systems based on the similarity of their lipophilicity data, visually represented in a dendrogram [66] [67].
- Sum of Ranking Differences (SRD): A non-parametric method to rank and compare different lipophilicity assessment approaches (e.g., various HPLC columns, TLC modifiers, in silico tools) against a benchmark [17] [65] [67].
Table 4: Strategic Comparison of RP-HPLC and HPTLC for Lipophilicity Assessment
| Parameter | RP-HPLC | RP-HPTLC |
|---|---|---|
| Throughput | Medium (serial analysis) | High (parallel analysis of many samples) [17] [14] |
| Cost | Higher (cost of columns, solvents, system) | Lower (less solvent consumption, cheaper plates) [2] |
| Sample Purity | Requires relatively pure samples | Tolerates impurities (separation occurs during development) [2] |
| Key Tunable Parameter | Stationary Phase (Column) | Mobile Phase (Modifier) |
| Primary Strengths | High precision, automation, suitability for complex mixtures, diverse column chemistries. | Rapid screening, cost-effectiveness, ability to analyze crude mixtures, visual assessment. |
| Best Application Context | Late-stage development requiring high-precision data, automated analysis, and QSRR modeling [45]. | Early-stage screening of large compound libraries, method scouting, and analysis of compounds with impurities [17]. |
The interplay between isotropic and anisotropic lipophilicity data is key to a comprehensive understanding of a compound's properties. While isotropic log P provides a foundational benchmark, anisotropic chromatographic parameters offer a more nuanced view that often correlates better with biological membrane penetration [1] [14]. By systematically applying the troubleshooting guides for RP-HPLC column selection and HPTLC mobile phase optimization provided here, researchers can efficiently generate robust, high-quality lipophilicity data to accelerate the drug discovery pipeline.
Best Practices for Ensuring Data Accuracy and Reproducibility
Lipophilicity, a compound's affinity for a lipophilic environment, is a fundamental physicochemical property in drug discovery and development. It profoundly influences a compound's pharmacokinetic and pharmacodynamic behavior, affecting absorption, distribution, metabolism, excretion, and toxicity (ADMET) [1]. Accurately determining lipophilicity is therefore crucial for selecting viable drug candidates. Lipophilicity is most commonly expressed as the logarithm of the partition coefficient (Log P) for unionized compounds, or the distribution coefficient (Log D) for ionizable compounds at a specific pH, typically measured between n-octanol and water [1] [7] [45]. Research in this field distinguishes between two principal approaches: isotropic and anisotropic lipophilicity measurements. Isotropic methods, like the traditional shake-flask method with n-octanol/water, measure partitioning into a homogeneous solvent. In contrast, anisotropic methods utilize biomimetic models such as liposomes or micelles, which possess ordered, membrane-like structures that better simulate the complex interactions found in biological systems [1] [68]. This guide provides a comparative analysis of the best practices for ensuring data accuracy and reproducibility across these key methodologies.
Comparative Analysis of Lipophilicity Measurement Methods
A thorough understanding of the strengths, limitations, and appropriate application contexts for each lipophilicity measurement technique is fundamental to generating reliable data. The following table offers a structured comparison of the primary methods.
Table 1: Comparison of Key Lipophilicity Measurement Methods
| Method | Measured Parameter | Typical Operational Range (Log P) | Key Advantages | Key Limitations & Sources of Error |
|---|---|---|---|---|
| Shake-Flask (Isotropic) [7] [45] | Log P / Log D | -2 to 4 | - Gold standard, direct measurement- OECD guideline method- Accurate and intuitive | - Time-consuming and labor-intensive- Prone to emulsion formation- Difficult for highly lipophilic compounds- Requires high compound purity |
| Slow-Stirring (Isotropic) [7] | Log P / Log D | Up to ~4.5 (more reliable for high Log P) | - Prevents emulsion formation- More reliable for highly lipophilic compounds vs. shake-flask | - Very long equilibrium time (2-3 days) |
| Reversed-Phase HPLC (Indirect) [69] [45] [51] | Chromatographic Hydrophobicity Index (CHI) or derived Log P | 0 to 6+ | - High throughput and automation- Low sample consumption and purity requirements- Broad applicability range- Insensitive to impurities | - Indirect method requiring calibration- Accuracy depends on reference compounds and model- Organic modifier can affect ionization |
| Biomimetic Models e.g., Liposomes/Micelles (Anisotropic) [1] [68] | Partition Coefficient (Log Kp) | Varies | - More biologically relevant interactions- Encodes hydrophobic, H-bond, and electrostatic forces- Better predictors for membrane permeation | - Lack of standardized protocols- Phase separation in separative methods can disturb equilibrium- Method sensitivity depends on model (e.g., micelles require high molar absorptivity) [68] |
| In Silico Prediction [1] [7] | Calculated Log P (cLog P) | Broad | - Extremely fast and cost-effective- Useful for virtual screening and initial filtering | - Accuracy is variable and depends on the algorithm and training set- Can be inaccurate for complex or novel chemotypes (varies by up to 2 log units) |
Detailed Experimental Protocols for Key Methods
Shake-Flask Method (Gold Standard Isotropic Protocol)
The shake-flask method is the benchmark direct measurement technique for lipophilicity [7].
Detailed Protocol:
- Phase Preparation: Pre-saturate n-octanol and aqueous buffer (e.g., pH 7.4 for Log D) with each other by mixing them thoroughly and allowing them to separate before use. This prevents volume changes during the experiment.
- Sample Preparation: Dissolve a known amount of the pure analyte in one of the pre-saturated phases (typically the phase in which it is more soluble).
- Equilibration: Combine the analyte solution with the other pre-saturated phase in a flask. The volume ratio should be chosen to ensure measurable concentrations in both phases after partitioning. Shake the mixture vigorously using a mechanical shaker for a predetermined time (from 1 to 24 hours) at a constant temperature (e.g., 25°C) to reach equilibrium.
- Phase Separation: After equilibration, allow the phases to separate completely. For n-octanol/water, this can be time-consuming due to emulsion formation. Centrifugation may be used to accelerate separation.
- Quantification: Carefully separate the two phases, ensuring minimal cross-contamination. Dilute the phases as necessary and analyze the concentration of the analyte in each phase using a suitable analytical method, typically Reversed-Phase Liquid Chromatography (LC) due to its wide applicability and low detection limit [1] [7].
- Calculation: Calculate Log P or Log D using the formula:
Log P = log10([analyte]_n-octanol / [analyte]_aqueous).
Best Practices for Accuracy:
- Control Temperature: Perform all steps at a constant, controlled temperature.
- Verify Equilibrium: Conduct kinetic experiments to confirm the shaking time is sufficient for equilibrium.
- Prevent Evaporation: Use sealed containers during shaking and storage.
- Avoid Contamination: Use techniques like the water-plug aspiration method during phase separation to prevent cross-contamination, especially for compounds with high Log P [7].
RP-HPLC Method (High-Throughput Indirect Protocol)
RP-HPLC is a widely used indirect method for rapid lipophilicity assessment [69] [45] [51].
Detailed Protocol (Dual-Method Approach): Method 1: Fast Screening
- System Calibration: Select a set of 5-6 reference compounds with known, accurately measured Log P values, covering a broad lipophilicity range (e.g., from Log P 0.5 to 5.7) [45].
- Chromatographic Analysis: Inject the reference compounds and the test compound under the same, standardized RP-HPLC conditions (C18 column, methanol/water or acetonitrile/water mobile phase with a gradient).
- Calculate Capacity Factor: For each compound, calculate the capacity factor,
k = (t_R - t_0) / t_0, wheret_Ris the compound's retention time andt_0is the column void time. - Build Calibration Curve: Plot the known Log P values of the reference compounds against their log
k. Perform linear regression to obtain a standard equation:Log P = a * log k + b[45]. - Determine Unknown Log P: Calculate the log
kof the test compound, and use the standard equation to interpolate its Log P value.
Method 2: Higher Accuracy with log k_w
- This method eliminates the effect of the organic modifier on the analyte's retention.
- Multi-Condition Analysis: For each reference and test compound, perform isocratic runs using at least three different mobile phase compositions (e.g., different methanol/water ratios).
- Extrapolate to 100% Water: For each compound, plot log
kagainst the volume fraction of organic modifier (φ). Extrapolate the resulting linear relationship to 0% organic modifier (φ=0) to obtain the theoretical capacity factor in pure water,log k_w[45]. - Build Calibration Curve: Plot the known Log P values of the reference compounds against their
log k_wto obtain a more accurate standard equation:Log P = a * log k_w + b[45]. - Determine Unknown Log P: Substitute the
log k_wof the test compound into this equation.
Best Practices for Accuracy:
- Reference Compound Selection: Choose reference compounds structurally similar to the test compounds for better predictions.
- System Suitability: Ensure the chromatographic system is stable and the calibration curve has a high correlation coefficient (R² > 0.97 is recommended) [45].
- pH Control: For ionizable compounds, use buffered mobile phases to control pH and measure Log D. Measuring retention at multiple pHs can also reveal the compound's acid-base character [51].
Biomimetic Liposome Partitioning (Anisotropic Protocol)
Partitioning into liposomes provides a more physiologically relevant anisotropic lipophilicity measure (Log Kp) [68].
Detailed Protocol (via Derivative Spectrophotometry):
- Liposome Preparation: Prepare unilamellar liposomes from phospholipids like DMPC (1,2-dimyristoyl-sn-glycero-3-phosphocholine) using a method such as thin-film hydration followed by extrusion or sonication to achieve a uniform, nanometric size (e.g., 100 nm) [68].
- Titration Experiment: Prepare a series of samples with a fixed concentration of the drug and increasing concentrations of liposomes, all in an appropriate buffer (e.g., pH 7.4). Maintain a constant temperature (37°C).
- Spectrophotometric Measurement: Record the UV-Vis absorption spectra of each sample in the series.
- Data Processing: Convert the absorption spectra to derivative spectra (e.g., first or second derivative). This step is crucial as it minimizes the strong background light scattering from the liposomes [68].
- Determine Log Kp: The change in the derivative amplitude (ΔA) is related to the concentration of partitioned drug. The partition coefficient (Kp) can be determined by fitting the ΔA data vs. lipid concentration to an appropriate partition model. Log Kp is then calculated as the log10 of Kp.
Best Practices for Accuracy:
- Characterize Liposomes: Use Dynamic Light Scattering (DLS) to determine liposome size and polydispersity, ensuring batch-to-batch consistency.
- Avoid Separation: Derivative spectroscopy is preferred as it avoids the equilibrium disturbance associated with physical phase separation [68].
- Control Physiology-Relevant Conditions: Perform experiments at physiological temperature (37°C) and pH (7.4) for the most biologically relevant data [68].
Visualization of Method Selection and Workflows
Lipophilicity Method Decision Pathway
This diagram outlines a logical workflow for selecting the most appropriate lipophilicity measurement method based on research goals and compound properties.
Diagram 1: Method selection is guided by project needs and compound properties, balancing speed, accuracy, and biological relevance [1] [7] [45].
Experimental Workflow for Key Methods
This diagram illustrates the core procedural steps for three principal methods, highlighting critical control points for reproducibility.
Diagram 2: Core workflows for principal methods. Highlighted steps (yellow) are critical for ensuring data accuracy and reproducibility [7] [68] [45].
The Scientist's Toolkit: Essential Research Reagents and Materials
The following table lists key materials and their functions for setting up robust lipophilicity assays.
Table 2: Essential Reagents and Materials for Lipophilicity Assays
| Item | Function & Application | Key Considerations for Reproducibility |
|---|---|---|
| n-Octanol (≥99% purity) | Standard organic solvent for isotropic partition experiments (shake-flask, slow-stirring). | Pre-saturate with aqueous buffer before use to prevent volume shifts. Store anhydrous. |
| Phosphate Buffered Saline (PBS) | Aqueous phase for Log P/D determination. Mimics physiological ionic strength. | Use consistent buffer concentration and pH. Pre-saturate with n-octanol. |
| HPLC-Grade Methanol & Acetonitrile | Mobile phase modifiers for RP-HPLC methods. | Use high-purity solvents from a consistent supplier. Degas before use. |
| C18 Reversed-Phase HPLC Column | Stationary phase for chromatographic lipophilicity measurements. | Condition thoroughly. Use a dedicated column for log P work. Monitor system performance. |
| Phospholipids (e.g., DMPC, Soy PC) | Primary components for constructing biomimetic liposome models [56] [68]. | Source from a reliable supplier. Store under inert gas at -20°C to prevent oxidation. |
| Reference Compounds (e.g., Acetophenone, Phenanthrene) [45] | Calibrants for building the standard curve in RP-HPLC and other indirect methods. | Select a diverse set with known, well-defined Log P values. Use high-purity compounds. |
| Dynamic Light Scattering (DLS) Instrument | Characterizes size and polydispersity of liposomes and other colloidal dispersions [56]. | Essential for verifying the consistency and quality of anisotropic biomimetic models. |
Ensuring data accuracy and reproducibility in lipophilicity research demands a careful, method-aware approach. The shake-flask method remains the gold standard for direct measurement but requires meticulous control of experimental parameters. RP-HPLC offers unparalleled speed and robustness for screening, with accuracy hinging on a well-chosen calibration set. Anisotropic biomimetic models like liposomes provide superior biological predictability but require further standardization of protocols and characterization of the models themselves. Ultimately, the choice of method should be guided by the specific research question, balancing the need for throughput, accuracy, and physiological relevance. By adhering to the detailed protocols, best practices, and quality control measures outlined in this guide, researchers can generate reliable, high-quality lipophilicity data that effectively drives informed decision-making in drug discovery and development.
Validating Lipophilicity Data: Correlating Isotropic and Anisotropic Measurements with Biological Outcomes
Lipophilicity, a fundamental physicochemical property in drug discovery, is principally defined by a compound's partitioning behavior between aqueous and lipid phases. This property is quantified through two distinct paradigms: isotropic and anisotropic lipophilicity. Isotropic lipophilicity, traditionally measured in an n-octanol/water system, results from the net sum of hydrophobicity minus polarity and encodes primarily hydrophobic and polar interactions [1]. In contrast, anisotropic lipophilicity is determined using artificial or natural membranes (e.g., liposomes, IAM columns) as the nonaqueous phase, which introduces additional ionic interactions and different topographical relationships between the solute and the membrane environment [1]. This critical distinction forms the theoretical foundation for evaluating various predictive models for membrane permeation and blood-brain barrier (BBB) penetration, as the choice between isotropic and anisotropic descriptors significantly impacts model accuracy and mechanistic relevance in forecasting biological barrier penetration.
Performance Benchmarking: Quantitative Comparison of Predictive Approaches
Table 1: Performance Metrics of BBB Penetration Prediction Models
| Predictive Model | Prediction Type | Key Parameters/Descriptors | Reported Performance (AUC/Other) | Relative Advantages |
|---|---|---|---|---|
| Machine Learning (Random Forest) [70] | Binary BBB Penetration & Efflux Transporter Interaction | 3D PSA, HPLC log P, HBD, HBA, log D, Rotatable Bonds | AUC: 0.88 (BBB), 0.82 (Multiclass Efflux) | Complex nonlinear integration; Superior to existing scores |
| CNS MPO Score [70] | CNS Drug Optimization | Traditional Physicochemical Parameters | AUC: 0.53 | Established benchmark; Simple calculation |
| CNS MPO PET Score [70] | PET Tracer Optimization | Adapted Physicochemical Parameters | AUC: 0.51 | Specific to tracer development |
| BBB Score [70] | BBB Penetration | Traditional Physicochemical Parameters | AUC: 0.68 | Simple heuristic |
| PAMPA-BBB Empirical Model [71] | Permeability Classification & Regression | Molecular Descriptors (Stepwise Linear Regression) | R²: 0.71; Balanced Accuracy: Promising | High-throughput capability; Direct permeability measurement |
| Atom-Attention MPNN with Contrastive Learning [72] | BBB & Caco-2 Permeability | Molecular Graph Representation; Self-Attention Mechanisms | Superior to traditional ML (Specific metrics not provided) | Enhanced interpretability; Handles complex molecular patterns |
Table 2: Isotropic vs. Anisotropic Lipophilicity Measurement Methods
| Method Type | Specific Technique | Measured Parameter | Throughput | Key Advantages | Key Limitations |
|---|---|---|---|---|---|
| Isotropic Methods | Shake-Flask [1] | log P (n-octanol/water) | Low | Gold standard; Well-understood | Labor-intensive; Limited log P range (-2 to 4) |
| Reversed-Phase TLC/HPLC [2] | log P (Chromatographic Retention) | Medium-High | Small sample needs; Impurity-tolerant | Indirect measurement; Correlation-dependent | |
| Computational (clog P) [1] | Predicted log P | Very High | Instant screening; No compound needed | Approximation only; Varies by algorithm | |
| Anisotropic Methods | PAMPA-BBB [71] | Effective Permeability (Pe) | High | Biomimetic membrane; Direct permeability | Optimized for pharmaceuticals |
| IAM Chromatography [1] | Membrane Partitioning | Medium-High | Chromatographic efficiency; Anisotropic environment | Specialized columns required | |
| Liposome Partitioning [1] | log Pliposome | Medium | Natural membrane mimic; Anisotropic | More complex preparation |
Experimental Protocols and Methodologies
Machine Learning Model Development for BBB Penetration
The superior-performing ML model was developed using a standardized dataset of 154 radiolabeled molecules and licensed drugs with known BBB penetration categories (CNS-positive, CNS-negative, efflux transporter substrates) [70]. The methodology encompassed:
- Parameter Collection: 24 molecular parameters were compiled, including experimental HPLC log P values, hydrogen bond donor/acceptor counts, rotatable bonds, and multiple PSA calculations (topological PSA, ACD PSA, and a novel 3D PSA) [70].
- 3D PSA Calculation: A novel geometry optimization protocol was implemented using Avogadro 1.2.0 with Merck molecular force field, followed by density functional theory calculations with B3LYP hybrid functionals and a 6-31 G(d) basis set [70]. Polar atoms for PSA calculation were selected based on partial charges (>0.6 or <-0.6) [70].
- Model Training and Validation: Various ML algorithms were trained within a 100-fold Monte Carlo cross-validation framework, with random forest achieving optimal performance [70]. Model interpretation employed SHAP (Shapley Additive Explanations) to determine individual parameter contributions [70].
PAMPA-BBB Assay Protocol
The Parallel Artificial Membrane Permeability Assay for BBB (PAMPA-BBB) provides a high-throughput experimental method for permeability assessment [71]:
- Membrane Preparation: Filter membranes of 96-well plates were coated with 4 μL of 2% (w/v) porcine brain lipid (PBL) in dodecane to mimic the BBB lipid environment [71].
- Experimental Conditions: Assays were conducted in PBS (pH 7.4) containing 1% DMSO as a co-solvent, with a 30-minute permeation period at room temperature [71].
- Permeability Calculation: Effective permeability (Pe) was calculated from the concentration of compound appearing in the receiver chamber over time [71].
- Model Development: Experimental Pe values for 106 compounds were used to train an empirical model via stepwise linear regression of molecular descriptors generated by PaDEL-Descriptor software [71].
Chromatographic Lipophilicity Measurements
- Reversed-Phase TLC (Isotropic): RP-TLC was performed on RP-18W F254s plates with methanol-water or acetonitrile-water mobile phases acidified with formic acid [2]. Lipophilicity parameters (RM0 and C0) were derived from the relationship between RM values and organic modifier concentration [2].
- High Performance Affinity Chromatography (Anisotropic): HPAC utilized human serum albumin (HSA)-immobilized stationary phases to determine plasma protein binding affinity, with retention time indicating binding strength [2]. Mobile phases consisted of phosphate buffer (pH 7.0) and 2-propanol [2].
Workflow Visualization of Key Methodologies
Diagram 1: Comparative Workflows for BBB Penetration Prediction
The Scientist's Toolkit: Essential Research Reagents and Materials
Table 3: Key Research Reagents and Materials for Permeability Studies
| Reagent/Material | Specific Example/Type | Primary Function in Research | Application Context |
|---|---|---|---|
| Artificial Membranes | Porcine Brain Lipids (PBL) | Mimics BBB lipid composition for permeability screening | PAMPA-BBB assays [71] |
| Immobilized Artificial Membrane (IAM) | Chromatographic stationary phase simulating membrane interactions | Anisotropic lipophilicity measurement [1] | |
| Chromatographic Phases | RP-18W F254 | Reversed-phase TLC stationary phase for retention studies | Isotropic lipophilicity measurement [2] |
| Human Serum Albumin (HSA) | Immobilized protein phase for protein binding studies | HPAC for plasma protein binding [2] | |
| Software Tools | PaDEL-Descriptor | Calculates molecular descriptors for QSAR modeling | Molecular descriptor generation [71] |
| Avogadro | Molecular geometry optimization and visualization | 3D PSA calculation [70] | |
| Experimental Materials | PAMPA 96-well Filter Plates | Hydrophobic PVDF membrane (0.45 µm) for permeability assays | High-throughput permeability screening [71] |
| Reference Compounds | Licensed CNS Drugs & Radiolabeled Molecules | Ground truth data for model training and validation | BBB penetration categorization [70] |
The comprehensive comparison of predictive approaches for membrane permeation and BBB penetration reveals a clear performance hierarchy. Machine learning models, particularly those incorporating novel 3D structural descriptors and sophisticated algorithms like random forests and message-passing neural networks, demonstrate superior predictive capability (AUC 0.88) compared to traditional rules-based approaches like CNS MPO (AUC 0.53) and BBB scores (AUC 0.68) [70] [72]. This performance advantage stems from ML's ability to perform complex nonlinear integration of multiple molecular parameters, including both isotropic and anisotropic descriptors.
The distinction between isotropic and anisotropic lipophilicity measurements proves conceptually and practically significant. While isotropic methods (shake-flask, computational log P) offer high throughput and standardization, anisotropic methods (PAMPA-BBB, IAM chromatography) provide superior biological relevance by incorporating membrane-specific interactions [1]. The emerging paradigm favors hybrid approaches that combine the strengths of both frameworks, as evidenced by the top-performing ML model that integrated traditional physicochemical parameters (largely isotropic) with novel 3D structural descriptors (capturing anisotropic aspects) [70].
For research applications, the choice of predictive methodology should align with the specific development stage: high-throughput isotropic measurements and computational predictions for early screening, progressing to experimental anisotropic assessments (PAMPA-BBB) for lead optimization, with advanced ML models providing the most accurate predictions when adequate training data exists. This tiered approach optimally balances resource allocation with predictive accuracy in the challenging pursuit of CNS-active therapeutics with desirable BBB penetration properties.
Correlating Chromatographic Retention Parameters with n-Octanol/Water Log P
Lipophilicity, representing the affinity of a molecule for a lipophilic versus an aqueous environment, is a fundamental physicochemical property in medicinal chemistry and drug design. It profoundly influences a compound's absorption, distribution, metabolism, excretion, and toxicity (ADMET) profile [1]. The reference scale for lipophilicity is defined by the logarithm of the n-octanol/water partition coefficient (log P), an isotropic parameter determined in a system comprised of two immiscible bulk solvents [73] [74].
In contrast, anisotropic lipophilicity is determined using systems where one phase has a defined molecular order, such as the stationary phase in liquid chromatography or artificial membranes [14] [1]. Chromatographic techniques, particularly Reversed-Phase High-Performance Liquid Chromatography (RP-HPLC) and Reversed-Phase Thin-Layer Chromatography (RP-TLC), are widely used to determine this anisotropic lipophilicity. The resulting chromatographic retention parameters are recognized as robust molecular descriptors that can correlate with the standard isotropic log P [73] [75]. This guide provides a comparative analysis of the correlation between chromatographic retention parameters and n-octanol/water log P, examining its principles, methodologies, and applications within drug development.
Theoretical Foundations of Lipophilicity
Isotropic vs. Anisotropic Lipophilicity
Understanding the distinction between isotropic and anisotropic lipophilicity is crucial for interpreting data from different experimental methods.
Isotropic Lipophilicity (log P): This is measured in a system where both phases are structureless bulk solvents, typically n-octanol and water. The intermolecular forces encoded in the isotropic partition coefficient are primarily hydrophobicity and polarity. The resulting parameter, log P, is a thermodynamic equilibrium constant representing the free energy change associated with solute transfer between the two phases [1] [74]. For ionizable compounds, the distribution coefficient (log D) is used, which accounts for the partition of all ionic and neutral species of a solute at a given pH [1].
Anisotropic Lipophilicity: This is measured using a structured phase, such as the hydrophobic stationary phase in chromatography or a liposomal membrane. These systems introduce specific topographical relationships and additional intermolecular forces, such as ionic bonds with charged head groups, which are not present in isotropic systems [14] [1]. Chromatographically determined lipophilicity is considered anisotropic because the stationary phase presents a fixed spatial arrangement of interaction sites, more closely mimicking the environment a drug encounters in a biological system, such as when partitioning into a cell membrane [14].
Fundamental Chromatographic Retention Parameters
Chromatographic retention is a dynamic process where solutes partition between a mobile and a stationary phase. The parameters describing this retention are directly related to the solute's lipophilicity [76] [75].
- Retention Factor (k): Formerly known as the capacity factor (k'), this is the most widely used parameter in HPLC. It is defined as ( k = (tr - t0)/t0 ), where ( tr ) is the solute's retention time and ( t_0 ) is the retention time of an unretained marker. It represents the ratio of time a solute spends in the stationary phase versus the mobile phase and is independent of column geometry and flow rate [76].
- Log k and Log kw: The logarithm of the retention factor (log k) is often used as a lipophilicity descriptor. As the mobile phase composition affects retention, log k values are frequently extrapolated to 100% aqueous mobile phase to derive log kw, a parameter considered to be more closely related to the fundamental partition coefficient [47] [75].
- Chromatographic Hydrophobicity Index (φ₀): This parameter represents the volume fraction of organic modifier in the mobile phase required to achieve equal distribution of the solute between the stationary and mobile phases (i.e., when k=1). It is calculated as ( φ₀ = -\text{log k_w} / S ), where S is the slope of the log k vs. φ (organic modifier fraction) relationship. A more hydrophobic solute requires a higher φ₀ value [75].
- Rₘ Value: Used in TLC, the Rₘ value is derived from the retardation factor (Rf), which is the ratio of the distance traveled by the solute to the distance traveled by the solvent front. Rₘ is defined as ( Rₘ = \log(1/Rf - 1) ) [75]. Like log k, Rₘ can be extrapolated to 0% organic modifier to obtain Rₘ₀, a parameter used to model lipophilicity [14].
The underlying connection between chromatography and thermodynamics is expressed by the equation relating the retention factor (k) to the distribution coefficient (K): ( k = K \cdot (Vs/Vm) ), where ( Vs/Vm ) is the phase ratio of the column [76]. This establishes that log k is linearly related to log P, the free energy parameter, making it a valid descriptor for lipophilicity [73] [76].
Correlation Data and Comparative Analysis
Extensive research has established that linear relationships often exist between chromatographic retention parameters and the shake-flask log P. However, the strength of this correlation depends on the congenericity of the compound set and the chromatographic system used.
Table 1: Correlation of Chromatographic Parameters with Log P for Different Compound Classes
| Compound Class | Chromatographic System | Retention Parameter | Correlation with Log P | Key Findings | Source |
|---|---|---|---|---|---|
| 1-Arylsuccinimide Derivatives (59 compounds) | RP-HPTLC (acetonitrile/water) | Rₘ₀ | Not specified | Rₘ₀ range: 0.280 - 3.154; High-quality QSRR models established. | [14] |
| 1-Arylsuccinimide Derivatives (59 compounds) | RP-HPTLC (acetone/water) | Rₘ₀ | Not specified | Rₘ₀ range: 0.678 - 3.674; Series B (diphenyl) showed highest lipophilicity. | [14] |
| 1-Arylsuccinimide Derivatives | In silico calculation | Average LogP | Reference for chromatographic data | Calculated LogP range: 0.928 - 4.663; Demonstrates structural diversity of set. | [14] |
| Common Drugs (e.g., ibuprofen, carbamazepine) | RP-HPLC (C18 column) | Log k | Good agreement with few available literature LogP values | Method is robust, viable, and resource-sparing for high-throughput LogP estimation. | [47] |
| Diverse Organic Compounds | RP-HPLC | Log k_w | Officially recommended by OECD | Widely accepted substitute for shake-flask LogP; good interlaboratory reproducibility. | [73] |
Table 2: Advantages and Disadvantages of Lipophilicity Measurement Methods
| Method | Key Principle | Lipophilicity Type | Throughput | Key Advantage | Key Limitation | |
|---|---|---|---|---|---|---|
| Shake-Flask | Direct partitioning between n-octanol/water | Isotropic (Log P) | Low | Gold standard; direct measurement. | Laborious; requires pure compound; limited LogP range (~-2 to 4). | [1] |
| RP-HPLC | Retention on hydrophobic stationary phase | Anisotropic (e.g., Log k_w) | High | High-throughput; low sample consumption; automated. | Indirect measure; requires calibration with standards. | [73] [47] |
| RP-TLC/HPTLC | Migration on hydrophobic plate | Anisotropic (e.g., Rₘ₀) | High | Very low cost; many samples simultaneously. | Lower efficiency than HPLC; less automated. | [14] |
| In Silico Prediction | Calculation from molecular structure | Predicted (Log P) | Very High | Instantaneous; no physical sample needed. | Accuracy varies; trained on experimental data; can be inaccurate for novel structures. | [18] [1] |
The correlation is strongest for congeneric series of compounds, where the molecular interactions with the stationary phase are consistent. For example, a study on 1-arylsuccinimide derivatives successfully used quantitative structure-retention relationship (QSRR) analysis to model their chromatographic lipophilicity based on molecular descriptors [14]. For structurally diverse datasets, the correlation can be weaker, as different solute-stationary phase interactions (e.g., hydrogen bonding, dipole-dipole) come into play, which are not present in the isotropic n-octanol/water system [73]. This highlights that while chromatographic parameters are excellent descriptors of anisotropic lipophilicity, their equivalence to the isotropic log P is not always perfect.
Experimental Protocols
RP-HPLC Method for Log P Determination
A robust RP-HPLC method for estimating log P, as detailed by [47], involves the following steps:
- System Configuration: A reversed-phase C18 column is used with an aqueous mobile phase buffered to a specific pH (e.g., 6 or 9), mixed with a polar organic modifier like acetonitrile or methanol.
- Calibration Curve: A series of reference standards with known, reliably measured log P values are analyzed using a gradient or isocratic elution. The retention time (tr) for each standard is recorded, and the retention factor (k) is calculated. The logarithm of the retention factor (log k) is then plotted against the known log P of the standards to create a calibration curve. Alternatively, the extrapolated log kw can be used for a more fundamental correlation.
- Sample Analysis: The compound of unknown log P is analyzed under identical chromatographic conditions, and its log k is determined.
- Log P Estimation: The log k value of the unknown compound is interpolated from the calibration curve to estimate its log P.
This method is noted for being robust, viable, and resource-sparing, making it suitable for high-throughput estimation in early drug discovery [47].
RP-TLC Protocol for Lipophilicity Screening
For TLC-based determination, as applied to 1-arylsuccinimide derivatives [14], the protocol is:
- Plate Development: RP-TLC plates (e.g., C18-coated) are spotted with the analytes. The plates are developed in a saturated chamber using mobile phases consisting of water and an aprotic organic modifier like acetone or acetonitrile, prepared at several different volume fractions.
- Measurement: After development, the R_f value for each compound in each mobile phase is measured.
- Data Processing: The Rₘ value is calculated from each Rf value ( (Rₘ = \log(1/Rf - 1)) ). The Rₘ values are then plotted against the volume fraction (φ) of the organic modifier in the mobile phase.
- Extrapolation: The linear relationship ( Rₘ = Rₘ₀ + Sφ ) is established, and the intercept, Rₘ₀, is extrapolated. This Rₘ₀ parameter serves as the chromatographic descriptor for lipophilicity and can be used in QSRR studies or correlated with log P [14] [75].
The Scientist's Toolkit: Essential Research Reagents and Materials
Table 3: Key Reagents and Materials for Chromatographic Lipophilicity Assessment
| Item | Function/Application | Example Specifications | |
|---|---|---|---|
| n-Octanol | Reference solvent for isotropic LogP (shake-flask method). | High-purity, anhydrous. | [74] |
| Buffered Aqueous Solutions | Aqueous phase for partitioning; controls pH for Log D measurements. | Phosphate buffer, pH 7.4 for physiological relevance. | [1] |
| C18 Stationary Phase | The hydrophobic surface for RP-HPLC and RP-TLC; mimics lipophilic environment. | 5μm particle size, 150mm length for HPLC; silica-based for HPTLC. | [47] [14] |
| Organic Modifiers | Component of mobile phase to modulate retention. | Acetonitrile, Methanol, 2-Propanol (HPLC grade). | [14] [77] |
| Log P Standard Mixture | For calibrating HPLC-based LogP methods. | Set of drugs/compounds with well-established LogP values (e.g., caffeine, hydrocortisone). | [47] |
Visualizing Concepts and Workflows
Lipophilicity Measurement Pathways
The following diagram illustrates the decision-making pathway for selecting the appropriate method to measure lipophilicity based on research goals and compound properties.
Relationship Between Lipophilicity Parameters
This conceptual diagram shows how fundamental thermodynamic properties link isotropic and anisotropic lipophilicity measures through solvation and transfer free energy.
The correlation between chromatographic retention parameters and the n-octanol/water partition coefficient provides a vital bridge between anisotropic and isotropic measures of lipophilicity. While the classical shake-flask method remains the gold standard for determining isotropic log P, chromatographic techniques like RP-HPLC and RP-TLC offer powerful, high-throughput alternatives for deriving anisotropic lipophilicity descriptors. These descriptors are not merely substitutes for log P; they offer a more nuanced view of molecular interactions that can be more biologically relevant. The choice between methods depends on the research context: shake-flask for definitive isotropic measurement, chromatography for efficient screening and anisotropic profiling, and in silico tools for initial, high-volume prediction. Understanding the correlations, strengths, and limitations of each approach enables researchers in drug development to effectively leverage lipophilicity data for optimizing the pharmacokinetic and pharmacodynamic profiles of new chemical entities.
Leveraging QSRR and Chemometric Analysis for Data Validation
Lipophilicity, a compound's affinity for a lipophilic environment, is one of the most critical physicochemical parameters in drug discovery, profoundly influencing a molecule's absorption, distribution, metabolism, excretion, and toxicity (ADMET) profile [14] [78]. Traditionally assessed as the partition coefficient (Log P) between n-octanol and water, this measurement represents isotropic lipophilicity where ionic charges have no defined spatial organization within the non-aqueous phase [14]. In contrast, anisotropic lipophilicity is determined using systems with structurally organized phases, such as chromatographic stationary phases or liposomes, where ionic charges maintain fixed positions [14]. This crucial distinction mirrors the organized biological environment within living organisms, where cell membranes composed of phospholipids create anisotropic systems that more accurately reflect the distribution of molecules between membranes and extracellular fluids [14] [15].
Quantitative Structure-Retention Relationship (QSRR) analysis has emerged as a powerful computational framework that correlates the chemical structure of analytes with their chromatographic retention behavior, enabling the prediction of lipophilicity and validation of experimental data [79] [80]. When combined with chemometric techniques—the application of statistical and mathematical methods to chemical data—QSRR provides researchers with robust tools for authenticating analytical results, understanding separation mechanisms, and extracting meaningful information from complex datasets [14] [81]. This guide compares experimental approaches for lipophilicity assessment, focusing on how QSRR and chemometric analysis serve as essential validation methodologies within the context of isotropic versus anisotropic lipophilicity research.
Theoretical Foundations: Isotropic versus Anisotropic Lipophilicity
Fundamental Differences and Biological Relevance
Isotropic lipophilicity, typically measured using the shake-flask method with n-octanol and water, represents a compound's partitioning between two unstructured liquid phases [7]. While this system benefits from standardization and simplicity, its biological relevance is limited because it fails to mimic the structured nature of biological membranes [14]. The n-octanol/water system primarily captures hydrophobicity driven by molecular volume and hydrogen bonding capacity, but cannot account for specific interactions with organized lipid bilayers [7].
In contrast, anisotropic lipophilicity characterizes molecular distribution in systems with structurally defined interfaces, such as those encountered in chromatographic systems with phospholipid-coated stationary phases or actual liposome suspensions [14] [78]. These systems more closely resemble biological barriers because the fixed spatial arrangement of ionic charges on chromatographic plates or phospholipid heads mimics the organized molecular environment found in cell membranes [14]. Research has demonstrated that anisotropic chromatographic systems better reflect drug behavior in living organisms, particularly for passive diffusion through biological membranes and binding to phospholipids and proteins [14] [15].
Comparative Analysis of Lipophilicity Assessment Methods
Table 1: Comparison of Isotropic and Anisotropic Lipophilicity Assessment Methods
| Feature | Isotropic Methods (n-octanol/water) | Anisotropic Chromatographic Methods |
|---|---|---|
| System Structure | Unstructured liquid phases | Structurally organized stationary phases |
| Charge Distribution | Random ionic charge distribution | Fixed spatial charge orientation |
| Biological Relevance | Limited resemblance to biomembranes | High resemblance to phospholipid membranes |
| Primary Applications | Early-stage lipophilicity screening | Predicting membrane permeability, protein binding |
| Throughput | Lower (time-consuming equilibrium) | Higher (automation compatible) |
| Data Validation | Limited structural insights | QSRR provides mechanistic interpretation |
| Experimental Complexity | Labor-intensive, requires compound purification | Streamlined, minimal sample preparation |
Experimental Platforms for Lipophilicity Determination
Isotropic Lipophilicity Measurement Protocols
The shake-flask method remains the gold standard for direct isotropic lipophilicity measurement, recommended by the Organization for Economic Co-operation and Development (OECD) [7]. This procedure involves dissolving the sample in a system of n-octanol and water pre-saturated with each other, shaking until equilibrium is reached (1-24 hours), separating the phases via centrifugation, and quantifying the compound concentration in each phase, typically using HPLC [7]. The partition coefficient (Log P) is then calculated as the logarithm of the ratio of equilibrium concentrations in the n-octanol and water phases. While this method provides a direct measurement, it suffers from several limitations: long equilibrium times, emulsion formation, large solvent consumption, and limited applicability for poorly soluble or surface-active compounds [7].
Several modifications have been developed to address these limitations. The slow-stirring method reduces emulsion formation by employing gentle stirring instead of vigorous shaking, requiring 2-3 days to reach equilibrium but providing more accurate results for compounds with Log P > 4.5 [7]. The water-plug aspiration/injection method minimizes phase contamination during separation, making it particularly suitable for highly lipophilic compounds [7]. Flow-based methods standardize the measurement process through automated flow injection systems, while vortex liquid-liquid microextraction (VALLME) dramatically reduces equilibrium time to approximately 2 minutes through vigorous vortex agitation that creates fine microdroplets with increased interfacial area [7].
Anisotropic Lipophilicity Measurement Protocols
Chromatographic techniques have become the preferred approach for determining anisotropic lipophilicity due to their higher throughput, reduced sample requirements, and better correlation with biological partitioning [14] [78]. The fundamental protocol involves analyzing compound retention behavior under standardized chromatographic conditions and deriving lipophilicity metrics from retention parameters.
Reversed-phase High-Performance Thin-Layer Chromatography (RP-HPTLC) provides a simple, cost-effective method for simultaneous lipophilicity estimation of multiple compounds [14]. The experimental workflow involves applying test compounds to RP-HPTLC plates, developing them in chambers with binary mobile phases containing water and an organic modifier (such as acetone or acetonitrile), and determining retention factors (Rₘ values). Lipophilicity (Rₘ⁰) is extrapolated from the relationship between Rₘ values and organic modifier concentration [14]. This method offers advantages including reduced cost and time, minimal solvent consumption, and the ability to handle multiple samples simultaneously [14].
Immobilized Artificial Membrane (IAM) Chromatography utilizes stationary phases coated with phospholipids that mimic cell membranes, providing exceptional prediction of drug-membrane interactions [82] [78]. The protocol involves using HPLC systems with IAM columns, employing gradient or isocratic elution with physiologically relevant pH buffers, and determining the Chromatographic Hydrophobicity Index on IAM (CHIIAM) as a measure of phospholipid affinity [82]. This method has demonstrated excellent correlation with cellular permeability and blood-brain barrier penetration [82].
Biomimetic Chromatography extends this approach to include stationary phases coated with other biomolecules, such as Human Serum Albumin (HSA) for predicting plasma protein binding [78]. The general protocol involves determining retention factors on these biomimetic columns and establishing correlations with pharmacokinetic properties through QSRR modeling [78].
QSRR Workflow for Data Validation
The integration of QSRR analysis provides a powerful framework for validating lipophilicity data and extracting mechanistic insights. The standard QSRR workflow involves multiple structured phases [80]:
- Data Compilation: Gathering experimental retention times or derived lipophilicity indices for a diverse set of reference compounds.
- Molecular Descriptor Calculation: Using software tools (such as ACD/Labs, Chemicalize, or alvaDesc) to compute theoretical molecular descriptors capturing structural, topological, and physicochemical properties [78].
- Descriptor Selection: Applying feature selection algorithms (Genetic Algorithms, Stepwise Regression) to identify the most relevant descriptors while avoiding overfitting.
- Model Development: Establishing mathematical relationships between selected descriptors and retention behavior using regression methods (Multiple Linear Regression, Partial Least Squares) or machine learning algorithms (Random Forest, Support Vector Machines, Artificial Neural Networks) [83] [80] [81].
- Model Validation: Rigorously assessing model performance through internal cross-validation, external validation with test sets, and defining applicability domains [78].
- Mechanistic Interpretation: Analyzing selected descriptors to understand structural features governing retention behavior and lipophilicity [14] [78].
Table 2: Key Molecular Descriptors in QSRR Analysis of Lipophilicity
| Descriptor Category | Specific Descriptors | Structural Interpretation | Relevance to Lipophilicity |
|---|---|---|---|
| Lipophilicity Descriptors | LogP, LogD, AlogP, ClogP | Hydrophobic/hydrophilic balance | Direct measurement of partition behavior |
| Steric Descriptors | Molar Volume, Molecular Weight, Maximum Projection Area | Molecular size and shape | Influences membrane penetration and binding |
| Electronic Descriptors | Partial Charges, Dipole Moment, H-bond Acceptors/Donors | Polarity and charge distribution | Affirms interaction with stationary phases |
| Topological Descriptors | Connectivity Indices, Wiener Index | Molecular branching and complexity | Correlates with retention behavior |
Comparative Experimental Data Analysis
Case Study: 1-Arylsuccinimide Derivatives
A comprehensive study of 59 1-arylsuccinimide derivatives illustrates the application of QSRR and chemometric analysis for validating anisotropic lipophilicity data [14]. Researchers determined chromatographic lipophilicity (Rₘ⁰) using RP-HPTLC with two aprotic solvents (acetone and acetonitrile) and applied both unsupervised (Hierarchical Cluster Analysis, Principal Component Analysis) and supervised (Linear Discriminant Analysis) pattern recognition methods to classify compounds based on structural characteristics [14].
The chemometric analysis revealed clear separation between different structural classes, with 1-aryl-3,3-diphenylsuccinimide derivatives (Series B) exhibiting the highest lipophilicity, while 1-aryl-3-methylsuccinimide derivatives (Series C) showed the lowest [14]. QSRR modeling identified three key molecular descriptors governing anisotropic lipophilicity: the partition coefficient (AlogP), the number of hydrogen bond donors (HBD), and the topological polar surface area (TPSA) [14]. The resulting QSRR models demonstrated high predictive quality with strong correlation coefficients (R² > 0.9), enabling accurate prediction of chromatographic behavior for structurally similar compounds [14].
Case Study: Organophosphate Pesticides
A recent study on organophosphate pesticides (OPs) demonstrated the validation of biomimetic chromatography data through QSRR modeling [78]. Researchers determined lipophilicity (CHI꜀₁₈), phospholipid affinity (CHIɪᴀᴍ), and plasma protein binding (%HSA) for 21 OPs using three chromatographic systems: reversed-phase C18, IAM, and HSA columns [78].
Genetic Algorithm-Multiple Linear Regression (GA-MLR) was employed to develop QSRR models linking molecular descriptors to chromatographic indices [78]. The resulting models exhibited satisfactory predictive performance with R² values of 0.844-0.914 for training sets and R²ₑₓₜ of 0.696-0.898 for external validation sets [78]. The QSRR analysis revealed that while lipophilicity was the primary factor for phospholipid binding, plasma protein binding involved more complex specific interactions with HSA pockets, explaining the weaker correlation between these parameters [78]. This insight underscores the value of QSRR not merely for prediction but for understanding the mechanistic basis of molecular interactions.
Case Study: Plant Food Bioactive Compounds
Research on plant food bioactive compounds highlights the application of QSRR for predicting retention times across multiple chromatographic systems [83] [84]. Scientists applied Genetic Algorithms coupled with Multiple Linear Regression (GA-MLR) to select relevant molecular descriptors and establish QSRR models for predicting reversed-phase liquid chromatography retention times of bioactive compounds [83].
The models demonstrated robust predictive ability with careful attention to measuring prediction uncertainty and assessing reliability based on the model applicability domain [83]. Descriptor interpretation provided valuable insights into separation mechanisms, confirming the dominant role of hydrophobicity in reversed-phase separation while identifying additional structural features influencing retention [83] [84]. This approach enabled the prediction of retention times for a large library of plant food bioactive compounds, supporting the identification of unknown metabolites in complex mixtures [83].
The Scientist's Toolkit: Essential Research Reagents and Materials
Table 3: Essential Research Reagents and Materials for Lipophilicity Studies
| Category | Specific Items | Function and Application |
|---|---|---|
| Chromatographic Systems | RP-HPTLC plates, IAM columns, HSA columns | Provide anisotropic environments mimicking biological barriers |
| Mobile Phase Components | n-octanol, acetonitrile, acetone, buffer salts | Create partitioning environments for isotropic and anisotropic measurements |
| Software Tools | ACD/Labs, Chemicalize, alvaDesc | Calculate molecular descriptors for QSRR modeling |
| Chemometric Packages | Genetic Algorithms, MLR, ANN, PCA | Develop predictive models and classify compounds based on structural features |
| Reference Compounds | Standard analytes with known lipophilicity | Validate analytical methods and calibrate instruments |
Integrated Workflow for Lipophilicity Assessment and Validation
The following diagram illustrates the comprehensive workflow integrating experimental determination with QSRR validation for both isotropic and anisotropic lipophilicity assessment:
Integrated Workflow for Lipophilicity Assessment and Validation
The integration of QSRR and chemometric analysis provides a robust framework for validating lipophilicity data across both isotropic and anisotropic measurement platforms. While isotropic methods like shake-flask offer standardized direct measurement of partition coefficients, anisotropic chromatographic approaches, particularly those employing biomimetic stationary phases, better replicate the organized molecular environment of biological systems. The comparative evidence demonstrates that QSRR modeling enhances not only predictive accuracy but also mechanistic understanding of molecular interactions governing lipophilicity.
For researchers and drug development professionals, the strategic combination of anisotropic lipophilicity assessment with QSRR validation offers a powerful approach to prioritize compound selection and optimize lead candidates. As artificial intelligence and machine learning continue to transform QSRR methodologies, the integration of these computational tools with experimental lipophilicity determination will further strengthen data validation protocols and accelerate the drug discovery process.
Lipophilicity is a foundational physicochemical property that profoundly influences the absorption, distribution, metabolism, and excretion (ADME) of therapeutic substances [50]. Traditionally, this property has been characterized as isotropic lipophilicity, represented by a single partition coefficient (Log P) measured in an isotropic octanol-water system, which provides a general measure of a compound's hydrophobicity [7]. However, biological barriers are inherently anisotropic, exhibiting direction-dependent structural and chemical properties that influence molecular transport. This discrepancy has driven research into anisotropic lipophilicity—a more nuanced approach that accounts for direction-dependent molecular interactions with non-uniform environments, such as those found in structurally ordered hydrogels and biological membranes [15] [7].
In the context of drug delivery, hydrogels—three-dimensional networks of hydrophilic polymers capable of retaining large amounts of water—have emerged as pivotal materials for controlled release applications [85]. Their resemblance to biological tissues makes them ideal for mimicking physiological conditions. While conventional isotropic hydrogels have shown promise, their functionality is limited by uniform structure and diffusion mechanisms. Advances in material science have enabled the development of anisotropic hydrogels with oriented polymer networks that exhibit direction-dependent swelling, mechanical properties, and, crucially, molecular permeability [86] [15]. This structural ordering creates microscopic pathways that differentiate between molecular transport along different axes, making traditional isotropic Log P measurements insufficient for predicting release kinetics.
This case study directly compares the predictive capabilities of isotropic versus anisotropic lipophilicity for drug release from hydrogel-based delivery systems. Through experimental data and mechanistic analysis, we demonstrate how accounting for structural anisotropy in both the carrier (hydrogel) and the molecular property (lipophilicity) provides superior forecasting of drug release profiles, enabling more precise design of targeted therapies.
Theoretical Framework: Fundamental Concepts
Isotropic vs. Anisotropic Lipophilicity
- Isotropic Lipophilicity: Measured using the shake-flask method in an octanol-water system, isotropic lipophilicity provides a single, averaged Log P value representing a compound's overall partitioning tendency between hydrophobic and hydrophilic phases [7]. This value assumes uniform interaction with the environment in all directions.
- Anisotropic Lipophilicity: This concept acknowledges that molecular interactions are direction-dependent, particularly in ordered biological or synthetic environments. It can be experimentally determined using systems like liposome/buffer partitions or through computational methods that account for molecular surface properties [7]. Anisotropic measurements reflect how a molecule's topology and uneven charge distribution affect its permeation through non-uniform barriers.
Structural Anisotropy in Hydrogels
Hydrogels can be engineered to possess anisotropic polymer networks. Unlike isotropic gels with random polymer orientation, anisotropic hydrogels feature aligned polymer chains that create direction-dependent diffusion pathways [86] [15]. This structural ordering can be achieved through various fabrication techniques, including:
- Template-based methods: Using oriented surfaces (e.g., polypropylene) to induce directional polymer growth during gelation [15].
- External field alignment: Applying magnetic or electric fields during synthesis.
- 3D/4D printing: Precisely depositing materials to create controlled microarchitectures [86].
These structured networks exhibit distinct permeability behaviors for molecules based on their physicochemical properties and the direction of transport relative to the network orientation [15].
The Interplay Governing Drug Release
The interaction between a drug's anisotropic lipophilicity and the hydrogel's structural anisotropy creates a sophisticated control mechanism for drug release. A molecule's directional affinity for hydrophobic/hydrophilic domains determines its preferred pathway through the oriented polymer network, directly influencing its release rate and profile [15]. This nuanced interaction cannot be captured by a single isotropic Log P value, necessitating a more complex model that integrates molecular and structural anisotropy.
Table 1: Key Concept Definitions
| Concept | Definition | Measurement/Characterization Methods |
|---|---|---|
| Isotropic Lipophilicity | A compound's uniform, direction-independent partition coefficient between octanol and water. | Shake-flask method; Slow-stirring method [7]. |
| Anisotropic Lipophilicity | A compound's direction-dependent partitioning behavior in ordered systems. | Liposome/buffer systems; Computational surface property analysis [7]. |
| Isotropic Hydrogel | A hydrogel with a randomly oriented, uniform 3D polymer network. | Scanning Electron Microscopy (SEM); swelling studies [15]. |
| Anisotropic Hydrogel | A hydrogel with an oriented, non-uniform polymer network creating direction-dependent properties. | SEM; permeability studies; mechanical testing along different axes [86] [15]. |
Experimental Comparison: Methodologies and Protocols
Fabrication of Anisotropic and Isotropic Hydrogels
Anisotropic Hydrogel Fabrication (Template Method) [15]:
- Materials: Gelatin (biomacromolecule), Polypropylene (PP) or Polyvinyl Chloride (PVC) sheets (orientational templates), Glass substrates (for isotropic control).
- Procedure:
- Prepare an aqueous gelatin solution (e.g., 5-10% w/v) at an elevated temperature (e.g., 40-50°C) to ensure complete dissolution.
- Pour the solution onto either the oriented template (PP or PVC) or the unoriented template (glass).
- Allow gelation to proceed at a controlled temperature (e.g., 4°C) for a specified period (e.g., 12-24 hours).
- Carefully detach the formed hydrogel from the template.
- Mechanism: Hydrophobic interactions between the gelatin and the oriented polymer template (like PP) induce the anisotropic growth of the gelatin network, creating aligned, tubular structures perpendicular to the disk surface [15]. The glass template, being unoriented, results in a random, isotropic network.
Isotropic Hydrogel Fabrication [87] [15]:
- Materials: Polymers such as Poly(ethylene glycol) diacrylate (PEGDA), Alginate methacrylate (ALMA), photoinitiator (e.g., Irgacure 2959).
- Procedure (Photopolymerization) [87]:
- Prepare a pre-gel solution containing PEGDA, ALMA, and photoinitiator in an aqueous buffer.
- For spherical particles, use a microfluidic device to form droplets.
- Expose the droplets to UV light to initiate cross-linking and form stable, isotropic microgels.
Measuring Permeability and Release Kinetics
Molecular Permeability Assay [15]:
- Model Molecules: Select compounds with varying Log P values: L-Phenylalanine (Phe, Log P = -1.5, hydrophilic), Methylene Blue (MB, Log P = -0.1, moderately hydrophilic), Rhodamine B (RhB, Log P = 2.3, hydrophobic).
- Protocol:
- Equilibrate disk-shaped anisotropic and isotropic hydrogels in a buffer.
- Mount the hydrogel as a barrier in a diffusion cell, with the donor chamber containing a solution of the model molecule.
- Monitor the concentration of the molecule in the receptor chamber over time using techniques like UV-Vis spectroscopy or HPLC.
- Key Analysis: Compare permeability coefficients and the shape of the permeation curves (e.g., typical Fickian diffusion vs. complex profiles with induction phases) between anisotropic and isotropic gels for each molecule.
Drug Release Kinetics Study [15]:
- Drug Loading: Incubate pre-formed hydrogels in solutions of a hydrophilic drug (e.g., 5-Fluorouracil) and a hydrophobic drug (e.g., Dexamethasone).
- Release Protocol:
- Place the drug-loaded hydrogel in a release medium (e.g., phosphate-buffered saline, PBS) under sink conditions.
- Agitate the medium at a constant temperature (e.g., 37°C).
- Withdraw samples from the release medium at predetermined time intervals and analyze the drug concentration using HPLC or a similar analytical method.
- Replenish the medium to maintain sink conditions.
- Data Modeling: Fit the release data to mathematical models (e.g., Higuchi, Korsmeyer-Peppas) to quantify release kinetics [88].
Results and Data Analysis
Comparative Permeability and Release Profiles
Experimental studies reveal that anisotropic and isotropic hydrogels exhibit fundamentally different permeation and release behaviors based on the drug's lipophilicity.
Table 2: Permeability Behavior of Model Molecules in Different Hydrogel Structures [15]
| Model Molecule | Log P | Anisotropic Hydrogel (PP template) | Isotropic Hydrogel (Glass template) |
|---|---|---|---|
| L-Phenylalanine (Phe) | -1.5 (Hydrophilic) | Complex permeability: Two induction and two permeation phases. | Typical Fickian diffusion behavior after initial induction. |
| Methylene Blue (MB) | -0.1 (Moderate) | Typical Fickian diffusion behavior. | Complex permeability: Induction phase followed by two permeation phases. |
| Rhodamine B (RhB) | 2.3 (Hydrophobic) | Typical Fickian diffusion behavior. | Complex permeability: Induction phase followed by two permeation phases. |
The data demonstrates a clear reversal of permeability efficiency. Anisotropic hydrogels, with their templated hydrophobic regions, facilitate the transport of hydrophobic molecules (MB, RhB), leading to straightforward diffusion. In contrast, their complex structure hinders the passage of hydrophilic molecules (Phe). The isotropic gel shows the opposite preference, most efficiently transporting the hydrophilic compound [15].
This structural preference directly translates to controlled release profiles. Anisotropic hydrogels preferentially release hydrophobic molecules, whereas isotropic hydrogels favor the release of hydrophilic drugs [15]. This selectivity provides a powerful mechanism for designing dual-drug delivery systems from a single polymeric material by controlling its internal architecture.
Limitations of Isotropic Log P in Release Prediction
The study on anisotropic gelatin hydrogels underscores the predictive failure of isotropic Log P. While isotropic Log P correctly ranks the general hydrophobicity of Phe, MB, and RhB, it fails to predict which hydrogel structure will release each molecule faster. For instance, based on Log P alone, one might predict that isotropic hydrogels (hydrophilic environment) would always favor the release of hydrophilic Phe, which holds true. However, predicting the release of the moderately hydrophilic MB and hydrophobic RhB becomes inaccurate without knowledge of the hydrogel's anisotropy. The anisotropic lipophilicity of the molecules—their interaction with the oriented, hydrophobic pathways in the anisotropic gel—is the dominant factor governing their release from these structured systems [15].
Supporting Evidence from Other Hydrogel Systems
Research on other anisotropic hydrogel systems corroborates these findings. For example, asymmetric PEGDA-ALMA hydrogel microparticles fabricated via microfluidics demonstrated higher pH-responsive desorption efficacy for 5-fluorouracil (5-FU) compared to their spherical, isotropic counterparts [87]. The anisotropic shape contributed to increased drug adsorption and more responsive polymer network dynamics, leading to superior controlled release performance at the target pH. This highlights that structural anisotropy, whether in the form of oriented polymer chains or particle morphology, provides enhanced control over drug loading and release that cannot be predicted by the drug's isotropic Log P alone.
The Scientist's Toolkit: Essential Research Reagents and Materials
Table 3: Key Reagents for Anisotropic Lipophilicity and Hydrogel Release Studies
| Category/Item | Function/Application | Examples & Notes |
|---|---|---|
| Hydrogel Polymers | Form the scaffold of the drug delivery system. | Gelatin: For template-based anisotropic gels [15].PEGDA: Provides a biocompatible, cross-linkable network [87].ALMA (Alginate Methacrylate): Adds pH-responsive functionality to the gel [87]. |
| Template Materials | Induce anisotropic polymer network growth during gelation. | Polypropylene (PP) Sheets: Strong hydrophobic interaction induces anisotropy [15].Polyvinyl Chloride (PVC) Sheets: Alternative orientational template [15].Glass Substrates: Standard for producing isotropic control hydrogels [15]. |
| Model Drug Molecules | Serve as probes for permeability and release studies. | L-Phenylalanine (Log P -1.5): Hydrophilic probe [15].Methylene Blue (Log P -0.1): Moderately hydrophilic probe [15].Rhodamine B (Log P 2.3): Hydrophobic probe and fluorescent tracer [15].5-Fluorouracil (5-FU): Model chemotherapeutic drug [87]. |
| Analytical Instruments | Used for characterization, quantification, and data analysis. | HPLC Systems: For precise quantification of drug concentration in release studies [15] [7].UV-Vis Spectrophotometer: For monitoring permeability of colored/chromophoric compounds [15].Scanning Electron Microscope (SEM): For visualizing anisotropic vs. isotropic polymer network morphology [15]. |
The evidence presented firmly establishes that anisotropic lipophilicity provides a superior predictive framework for drug release from advanced hydrogel delivery systems compared to the traditional isotropic Log P model. The directional interactions between a drug molecule and an anisotropically structured polymer network are a critical determinant of release kinetics—a factor that a single, averaged partition coefficient cannot capture.
The implications for drug development are substantial. By characterizing the anisotropic lipophilicity of drug candidates and intentionally designing anisotropic structures in hydrogel carriers, researchers can achieve unprecedented control over drug release profiles. This approach enables the rational design of dual-drug delivery systems from a single polymer composition and improves the accuracy of in vitro in vivo correlations (IVIVC) by better mimicking the anisotropic nature of biological barriers.
Future research should focus on standardizing high-throughput methods for measuring anisotropic lipophilicity [7], developing more sophisticated computational models to predict molecule-structure interactions [89], and exploring a wider range of polymers and fabrication techniques like 3D printing to create complex, application-specific anisotropic architectures [86]. Integrating these elements will accelerate the development of smarter, more effective drug delivery systems tailored to the nuanced physics of biological environments.
Integrating Lipophilicity Data with Other Physicochemical Properties for Holistic Candidate Profiling
Lipophilicity stands as one of the most informative single physicochemical parameters in modern drug discovery, serving as a critical determinant in shaping the pharmacokinetic and pharmacodynamic profiles of candidate compounds [1]. Defined by the International Union of Pure and Applied Chemistry (IUPAC) as a "physicochemical property which describes a partitioning equilibrium of solute molecules between water and an immiscible organic solvent, favouring the latter," lipophilicity is most commonly expressed as the logarithm of the partition coefficient (log P) or the distribution coefficient (log D) at specific pH values [1] [90]. This property influences virtually every aspect of a drug's behavior within the body, including absorption, distribution, metabolism, excretion, and toxicity (ADMET) [1] [91]. In recent years, the integration of lipophilicity data with other physicochemical parameters has emerged as an essential strategy for holistic candidate profiling, particularly when framed within the comparative analysis of isotropic versus anisotropic lipophilicity research methodologies [1].
The fundamental distinction between isotropic and anisotropic lipophilicity measurements lies in the nature of the nonaqueous phase used for partitioning experiments. Isotropic lipophilicity employs homogeneous organic solvents such as n-octanol, resulting from the net sum of hydrophobicity minus polarity. In contrast, anisotropic lipophilicity utilizes artificial and natural membranes like liposomes and micelles, which establish different topographical relations between the solute and the nonaqueous phase involving varied interaction forces, including ionic bonds [1]. This critical distinction means that isotropic and anisotropic partition coefficients express lipophilicity on different scales, with anisotropic systems potentially offering more biologically relevant data for predicting in vivo behavior [1]. The evolving understanding of these complementary approaches now enables researchers to construct more comprehensive physicochemical profiles that better predict clinical success.
Comparative Analysis: Isotropic versus Anisotropic Lipophilicity Assessment
Methodological Foundations and Theoretical Frameworks
The classical approach to lipophilicity assessment has centered on isotropic systems, with the shake-flask method employing n-octanol and water phases remaining the gold standard for log P determination [1] [90]. This method measures the equilibrium distribution of a compound between these two phases, expressed as log P for neutral compounds or log D for ionizable compounds at physiologically relevant pH values [1]. The shake-flask method offers direct measurement of partition coefficients and is accurate for log P values typically ranging from -2 to 4, though it can be labor-intensive and requires relatively large amounts of pure compounds [1].
In contrast, anisotropic lipophilicity assessment employs more complex membrane-like systems including immobilized artificial membranes (IAM), immobilized liposome chromatography (ILC), and liposome/water partitioning [1] [90]. These systems aim to better mimic the biological environment that drug candidates encounter when traversing cellular membranes. The intermolecular forces encoded in anisotropic lipophilicity extend beyond simple hydrophobicity and polarity to include ionic interactions, potentially offering a more nuanced understanding of membrane penetration capabilities [1]. Chromatographic methods, particularly liquid chromatography (LC), play pivotal roles in both direct and indirect determination of lipophilicity across both isotropic and anisotropic systems [1].
Table 1: Fundamental Characteristics of Isotropic vs. Anisotropic Lipophilicity Assessment
| Parameter | Isotropic Lipophilicity | Anisotropic Lipophilicity |
|---|---|---|
| Nonaqueous Phase | Homogeneous organic solvents (n-octanol) | Heterogeneous membrane systems (liposomes, micelles, IAM) |
| Intermolecular Forces Encoded | Hydrophobicity, Polarity | Hydrophobicity, Polarity, Ionic bonds |
| Primary Measurement | Partition coefficient (log P) | Membrane affinity coefficients |
| Biological Relevance | Moderate | High (better mimics biological membranes) |
| Experimental Complexity | Lower | Higher |
| Throughput Potential | Moderate | High with automated systems |
Experimental Determination Methods and Protocols
Shake-Flask Method for Isotropic Lipophilicity
The shake-flask method represents the reference standard for direct log P determination [1]. The following protocol outlines the key steps:
Phase Preparation: Saturate n-octanol with water and vice versa by mixing equal volumes of each solvent and allowing them to equilibrate for 24 hours before separation.
Compound Partitioning: Dissolve the compound of interest in either the aqueous or organic phase at a concentration suitable for detection. Combine the two phases (typically 1:1 ratio) in a sealed container and shake mechanically for 30-60 minutes to establish partitioning equilibrium.
Phase Separation: Allow the phases to separate completely, then carefully separate them to avoid cross-contamination.
Concentration Analysis: Quantify the compound concentration in each phase using appropriate analytical methods, with liquid chromatography (LC) being preferred due to its wide applicability and low detection limits [1].
Calculation: Calculate log P using the formula: log P = log([compound]organic/[compound]aqueous)
For ionizable compounds, log D determinations require careful pH control using appropriate buffer systems, typically at physiologically relevant pH values of 7.4 (blood) or 6.5 (intestinal) [90].
Chromatographic Methods for Lipophilicity Assessment
Chromatographic methods provide indirect determination of lipophilicity through correlation between retention factors and partition coefficients [1] [92]. These methods offer higher throughput and require smaller compound quantities compared to shake-flask.
Reversed-Phase Thin Layer Chromatography (RP-TLC) Protocol [92]:
Stationary Phase Preparation: Use modified silica gel plates (C8, C18, or CN derivatives) as the stationary phase.
Mobile Phase Preparation: Prepare mobile phases consisting of a buffer solution (e.g., 0.2 M tris-hydroxymethyl aminomethane, pH 7.4) mixed with an organic modifier (e.g., acetone) in varying proportions (typically 60-90% organic modifier in 5% increments).
Sample Application: Dissolve test compounds in appropriate solvent (e.g., chloroform at 1.0 mg/mL) and apply 5μL spots to chromatographic plates.
Chromatographic Development: Develop plates in equilibrated chambers until the solvent front travels an appropriate distance.
Detection and Visualization: Visualize spots using appropriate methods (e.g., spraying with 10% ethanolic sulfuric acid and heating to 110°C).
Data Analysis: Calculate RM values using the formula: RM = log(1/Rf - 1), where Rf is the retardation factor. Plot RM against organic modifier concentration (C) and extrapolate to zero organic modifier to obtain RM0, the chromatographic lipophilicity index.
High-Performance Liquid Chromatography (HPLC) Methods:
HPLC-based methods follow similar principles but offer enhanced automation and precision. Reverse-phase columns (C8, C18) are used with aqueous-organic mobile phases, and retention times are correlated with known log P values of standard compounds to establish calibration curves [1] [90].
Immobilized Artificial Membrane (IAM) Chromatography
IAM chromatography provides anisotropic lipophilicity assessment by employing stationary phases that mimic biological membranes [1] [90]:
Column Selection: Use IAM columns containing phospholipid analogs covalently bonded to silica particles.
Mobile Phase: Employ physiologically relevant buffer solutions (e.g., phosphate buffer, pH 7.4) with or without organic modifiers.
Chromatographic Conditions: Isocratic or gradient elution with UV detection monitoring compound retention.
Data Interpretation: Correlate retention factors with membrane penetration potential, often providing better prediction of cellular permeability than isotropic methods.
Comparative Data Analysis and Interpretation
The following table summarizes key comparative data between isotropic and anisotropic lipophilicity assessment methods based on current literature:
Table 2: Performance Comparison of Lipophilicity Assessment Methods
| Method | Measurement Range | Throughput | Compound Requirement | Correlation with Biological Permeability | Key Limitations |
|---|---|---|---|---|---|
| Shake-Flask (Isotropic) | -2 to 4 log P units | Low | High (pure compounds) | Moderate | Labor-intensive, limited range, potential emulsion formation |
| RP-TLC (Isotropic) | -1 to 5 log P units | Medium | Low | Moderate to good | Limited precision, compound-dependent detection |
| RP-HPLC (Isotropic) | 0 to 6 log P units | High | Low | Good | Requires reference standards, solvent limitations |
| IAM Chromatography (Anisotropic) | Not well-defined | Medium | Low | Excellent for membrane penetration | Costly columns, limited method standardization |
| Liposome/Water Partitioning (Anisotropic) | -1 to 5 log P units | Low | Medium | Excellent for membrane penetration | Complex preparation, limited throughput |
Recent research has demonstrated that anisotropic systems often provide superior correlation with biological permeability phenomena, particularly for compounds that interact specifically with membrane components [1]. For instance, studies on betulin triazole derivatives with attached 1,4-quinone have shown that anisotropic measurements better predict cellular uptake and distribution patterns compared to traditional octanol/water systems [92]. This enhanced predictive power stems from the ability of anisotropic systems to capture additional interaction forces, particularly ionic bonding, that significantly influence membrane partitioning in biological systems [1].
Integration Strategies for Holistic Candidate Profiling
Lipophilicity Efficiency Metrics
The concept of Ligand Lipophilicity Efficiency (LLE or LipE) has emerged as a powerful integrative metric that combines lipophilicity with potency data [91] [93]. Defined as LLE = pIC50 (or pEC50) - log P (or log D), this metric quantifies the amount of target potency achieved per unit of lipophilicity [91]. Higher LLE values indicate more efficient compounds that achieve desired potency with minimal lipophilicity, potentially reducing safety liabilities [91].
Recent analyses suggest that targeting LLE values >5-7 can significantly improve compound quality by reducing the risk of attrition due to toxicity or poor pharmacokinetics [91]. This approach encourages medicinal chemists to maintain optimal lipophilicity (typically log P 1-3) while enhancing potency through specific target interactions rather than nonspecific hydrophobic binding [91] [93]. The strategic application of LLE has been successfully implemented across multiple drug discovery programs, resulting in clinical candidates with improved efficacy and safety profiles [91].
Multivariate Profiling and Property-Based Design
Holistic candidate profiling requires the integration of lipophilicity data with multiple additional physicochemical parameters. Key complementary properties include:
Hydrogen Bonding Capacity: Influences membrane permeability and solubility; typically quantified through hydrogen bond donor (HBD) and acceptor (HBA) counts [90] [91].
Polar Surface Area (PSA): Correlates with passive membrane permeability and brain penetration; optimal range typically 60-140 Ų for oral drugs [91].
Molecular Size and Flexibility: Impact membrane crossing and target interaction; often assessed through molecular weight, rotatable bond count, and fraction of sp³ carbons [1].
Ionization State (pKa): Determines pH-dependent partitioning behavior and significantly influences log D profiles [1] [90].
The following workflow visualization illustrates the integrated approach to candidate profiling combining isotropic and anisotropic lipophilicity data with other key parameters:
Integrated Candidate Profiling Workflow
Experimental Data Integration and Decision Framework
The following table demonstrates how integrated lipophilicity data can be combined with other parameters to guide candidate selection and optimization:
Table 3: Holistic Candidate Profiling Data Integration Framework
| Parameter | Compound A | Compound B | Compound C | Optimal Range |
|---|---|---|---|---|
| log P (Isotropic) | 2.1 | 3.8 | 1.5 | 1-3 |
| IAM Capacity Factor (Anisotropic) | 1.2 | 4.1 | 0.8 | 1-3 |
| log D₇.₄ | 1.8 | 3.2 | 1.5 | 1-3 |
| LLE (LipE) | 6.2 | 3.1 | 5.8 | >5 |
| H-Bond Donors | 2 | 1 | 3 | ≤3 |
| H-Bond Acceptors | 5 | 8 | 4 | ≤7 |
| Polar Surface Area (Ų) | 85 | 45 | 95 | 60-140 |
| Molecular Weight | 385 | 465 | 350 | ≤500 |
| Predicted Permeability | High | Medium | High | - |
| Predicted Solubility | Good | Poor | Good | - |
| Overall Profile Assessment | Optimal | Suboptimal (high lipophilicity, low LLE) | Good (moderate potency) | - |
This integrated framework enables researchers to identify compounds with balanced physicochemical properties, such as Compound A in the example above, which demonstrates optimal lipophilicity across both isotropic and anisotropic measurements combined with favorable efficiency metrics and complementary properties.
The Scientist's Toolkit: Essential Research Reagents and Materials
Successful implementation of integrated lipophilicity profiling requires access to specialized reagents and materials. The following table details key solutions and their applications:
Table 4: Essential Research Reagent Solutions for Lipophilicity Assessment
| Reagent/Material | Application | Function | Key Considerations |
|---|---|---|---|
| n-Octanol (water-saturated) | Isotropic shake-flask | Nonpolar phase simulating lipid environments | Must be pre-saturated with aqueous buffer; high purity essential |
| Physiological Buffers (pH 7.4, 6.5) | Isotropic/anisotropic systems | Aqueous phase simulating biological fluids | Phosphate or tris buffers commonly used; ionic strength affects partitioning |
| RP-TLC Plates (C8, C18, CN) | Chromatographic lipophilicity | Stationary phase for retention measurement | Different chain lengths offer selectivity modulation |
| IAM Chromatography Columns | Anisotropic assessment | Mimics biological membrane environments | Costly but essential for membrane interaction studies |
| Liposome Preparations | Anisotropic partitioning | Artificial membrane systems | Composition tunable to mimic specific membrane types |
| HPLC Columns (C8, C18) | Chromatographic lipophilicity | High-resolution separation for log P correlation | Method transferability between systems requires validation |
| Reference Standard Compounds | Method calibration | Establishing retention-log P correlations | Should cover broad log P range with known literature values |
| LC-MS Compatible Solvents | Compound quantification | Enables sensitive detection in both phases | Low UV cutoff and high purity essential for accurate quantification |
The integration of isotropic and anisotropic lipophilicity data with complementary physicochemical parameters represents a significant advancement in holistic candidate profiling. While isotropic methods like shake-flask and reversed-phase chromatography provide fundamental lipophilicity data with well-established interpretation frameworks, anisotropic approaches offer enhanced biological relevance by capturing additional interaction forces present in membrane environments [1]. The strategic combination of these approaches, guided by efficiency metrics such as LLE and complemented by additional physicochemical profiling, enables drug discovery teams to make more informed decisions during candidate selection and optimization [91] [93].
The evolving understanding of lipophilicity's multifaceted impact on drug behavior continues to shape modern medicinal chemistry practices. By employing the integrated strategies and experimental protocols outlined in this review, researchers can better navigate the complex balance between potency, permeability, and safety, ultimately increasing the probability of clinical success. As the field advances, further refinement of anisotropic systems and their integration with computational prediction models will likely enhance our ability to design candidates with optimal physicochemical properties from the earliest stages of drug discovery.
Conclusion
The comparative analysis of isotropic and anisotropic lipophilicity underscores that neither system is universally superior; rather, they provide complementary information crucial for modern drug development. Isotropic measures like log P offer a standardized, well-understood benchmark, while anisotropic methods often deliver a more biologically relevant profile of a compound's interaction with structured membranes. The future lies in the intelligent integration of both data types, enhanced by high-throughput methodologies and robust computational models. This synergistic approach will continue to refine our ability to predict complex in vivo behaviors, ultimately guiding the design of safer, more effective therapeutics with optimal pharmacokinetic and pharmacodynamic properties.
References
- 1. Liquid Chromatography on the Different Methods for ... [https://www.mdpi.com/2227-9040/10/8/340]
- 2. Experimental and computational analysis of lipophilicity ... [https://www.sciencedirect.com/science/article/abs/pii/S1570023225000339]
- 3. Anisotropic solvent model of the lipid bilayer. 1. ... [https://pmc.ncbi.nlm.nih.gov/articles/PMC3089899/]
- 4. Difference Between Isotropic And Anisotropic [https://byjus.com/chemistry/difference-between-isotropic-and-anisotropic/]
- 5. Isotropic vs Anisotropic: Key Differences Explained [https://www.vedantu.com/chemistry/isotropic-anisotropic]
- 6. Isotropic vs Anisotropic - Definition and Examples [https://sciencenotes.org/isotropic-vs-anisotropic-definition-and-examples/]
- 7. Methods for Determination of Lipophilicity [https://encyclopedia.pub/entry/26444]
- 8. Lipophilicity [https://www.creative-biolabs.com/drug-discovery/therapeutics/lipophilicity.htm]
- 9. Comparative Analysis of Anisotropic Lipophilicity of a ... [https://www.mdpi.com/2077-0472/13/12/2212]
- 10. Hydrophobic Interactions [https://chem.libretexts.org/Bookshelves/Physical_and_Theoretical_Chemistry_Textbook_Maps/Supplemental_Modules_(Physical_and_Theoretical_Chemistry)/Physical_Properties_of_Matter/Atomic_and_Molecular_Properties/Intermolecular_Forces/Hydrophobic_Interactions]
- 11. The Hydrophobic Effects: Our Current Understanding - PMC [https://pmc.ncbi.nlm.nih.gov/articles/PMC9609269/]
- 12. 2.3: Intermolecular Forces [https://chem.libretexts.org/Courses/can/CHEM_231%3A_Organic_Chemistry_I_Textbook/02%3A_Polar_Covalent_Bonds_Acids_and_Bases/2.03%3A_Intermolecular_Forces]
- 13. Molecular Structure and Bonding (1.1.2) | IB DP Biology HL ... [https://www.tutorchase.com/notes/ib/biology-2025-hl/1-1-2-molecular-structure-and-bonding]
- 14. Journal of Chromatography A [https://www.sciencedirect.com/science/article/abs/pii/S0021967320307159]
- 15. Analysis of Permeation and Release Behavior Based on ... [https://pmc.ncbi.nlm.nih.gov/articles/PMC12530698/]
- 16. LogD/LogP [https://enamine.net/biology/services/admet-and-pharmacokinetics/logd-logp]
- 17. Comparative Study of the Lipophilicity of Selected Anti ... [https://pmc.ncbi.nlm.nih.gov/articles/PMC9821840/]
- 18. Prediction of logarithm of n-octanol-water partition ... [https://pmc.ncbi.nlm.nih.gov/articles/PMC10101867/]
- 19. Partition Coefficient (n-octanol/water): Shake Flask Method [https://www.oecd.org/en/publications/1995/07/test-no-107-partition-coefficient-n-octanol-water-shake-flask-method_g1gh28d3.html]
- 20. Simple method to calculate octanol–water partition ... [https://www.sciencedirect.com/science/article/abs/pii/S0260877403004291]
- 21. Interactions of Ionic Liquids and Spirocyclic Compounds with... [https://cris.vtt.fi/en/publications/interactions-of-ionic-liquids-and-spirocyclic-compounds-with-lipo]
- 22. Accessing lipophilicity of drugs with biomimetic ... models [https://pubmed.ncbi.nlm.nih.gov/29366962/]
- 23. Fabrication of Biomimetic Hybrid Liposomes via Microfluidic... [https://www.dovepress.com/fabrication-of-biomimetic-hybrid-liposomes-via-microfluidic-technology-peer-reviewed-fulltext-article-IJN]
- 24. Study of Lipophilicity and ADME Properties of 1,9 ... [https://pmc.ncbi.nlm.nih.gov/articles/PMC10138389/]
- 25. Key Properties in Drug Design | Predicting Lipophilicity, ... [https://chemaxon.com/blog/presentation/key-properties-in-drug-design-predicting-lipophilicity-pka-and-solubility-0]
- 26. Study of the Lipophilicity and ADMET Parameters of New ... [https://www.mdpi.com/1424-8247/17/6/725]
- 27. A High-Throughput Method for Lipophilicity Measurement [https://pmc.ncbi.nlm.nih.gov/articles/PMC2538958/]
- 28. Improved estimation of intrinsic solubility of drug-like ... [https://pmc.ncbi.nlm.nih.gov/articles/PMC12516829/]
- 29. A Method for Measuring the Lipophilicity of Compounds in ... [https://www.sciencedirect.com/science/article/pii/S2472555222077619]
- 30. Quantifying uncertainty in predicted chemical partition ratios ... [https://pubs.rsc.org/en/content/articlehtml/2025/em/d5em00357a]
- 31. Partition Coefficient (1-Octanol/Water): Slow-Stirring Method [https://www.oecd.org/en/publications/2022/06/test-no-123-partition-coefficient-1-octanol-water-slow-stirring-method_g1gh7328.html]
- 32. Miniaturization in action: High-resolution, low-cost ... [https://www.sciencedirect.com/science/article/pii/S2949771X25000404]
- 33. High-Throughput Miniaturized Biotransformation Testing ... [https://pmc.ncbi.nlm.nih.gov/articles/PMC12613810/]
- 34. Pitfalls in Early Bioprocess Development Using Shake Flask ... [https://pmc.ncbi.nlm.nih.gov/articles/PMC11773345/]
- 35. Parallel use of shake flask and microtiter plate online ... [https://jbioleng.biomedcentral.com/articles/10.1186/s13036-015-0005-0]
- 36. Chromatographic and computational screening of anisotropic ... [https://pubmed.ncbi.nlm.nih.gov/31787580/]
- 37. Chromatographic and computational screening of ... [https://www.sciencedirect.com/science/article/abs/pii/S1476927119307601]
- 38. Comparison of HPLC, HPTLC, and In Silico Lipophilicity ... [https://pubmed.ncbi.nlm.nih.gov/38893351/]
- 39. State of the art and prospects of methods for determination ... [https://www.sciencedirect.com/science/article/abs/pii/S0165993618300669]
- 40. Lipophilicity and its relationship with passive drug ... [https://pubmed.ncbi.nlm.nih.gov/21052797/]
- 41. The microplate: utility in practice [https://www.bmglabtech.com/en/the-microplate-utility-in-practice/]
- 42. A high-throughput media design approach for ... [https://pubmed.ncbi.nlm.nih.gov/23563583/]
- 43. Comparison of Miniaturized Chromatographic Columns ... [https://www.mdpi.com/2297-8739/10/8/447]
- 44. Lab Automation Workflows For Bacterial Growth ... [https://byonoy.com/journal/accelerate-bacterial-growth-measurement-with-integrated-absorbance-96-automate-eppendorf-epmotion-automated-workflow/]
- 45. Establishment and Application of Reversed-Phase Liquid ... [https://dmpkservice.wuxiapptec.com/articles/36-rapid-determination-of-lipophilicity-establishment-and-application-of-reversed-phase-liquid-chromatography-rp-hplc/]
- 46. Recent advances in lipophilicity measurement by reversed- ... [https://www.sciencedirect.com/science/article/abs/pii/S0165993615000655]
- 47. A robust, viable, and resource sparing HPLC-based logP ... [https://www.sciencedirect.com/science/article/pii/S0378517323007457]
- 48. Estimating the Lipophilicity of Natural Products using a ... [https://pmc.ncbi.nlm.nih.gov/articles/PMC3407816/]
- 49. HPLC 2025 Update: The Rise of GLP-1 Therapeutics [https://www.chromatographyonline.com/view/the-rise-of-glp-1-therapeutics]
- 50. Use of TLC and Computational Methods to Determine ... [https://pubmed.ncbi.nlm.nih.gov/41011127/]
- 51. HPLC-Based Measurements of Various Lipophilicity ... [https://www.chromatographyonline.com/view/hplc-based-measurements-various-lipophilicity-parameters-aid-drug-design]
- 52. Use of TLC and Computational Methods to Determine ... [https://www.mdpi.com/1424-8247/18/9/1255]
- 53. Why 90% of clinical drug development fails and how to ... [https://pmc.ncbi.nlm.nih.gov/articles/PMC9293739/]
- 54. and Isotropic - GeeksforGeeks Anisotropic [https://www.geeksforgeeks.org/chemistry/isotropic-vs-anisotropic/]
- 55. Difference Between Isotropic and Anisotropic : JEE Main 2026 [https://www.vedantu.com/jee-main/chemistry-difference-between-isotropic-and-anisotropic]
- 56. Phase Transitions of Isotropic to Anisotropic Biocompatible ... [https://pmc.ncbi.nlm.nih.gov/articles/PMC4964366/]
- 57. Petroleum Emulsion Stability and Separation Strategies [https://www.mdpi.com/2305-7084/9/5/113]
- 58. Formation damage analysis of matrix acidizing: effect ... [https://link.springer.com/article/10.1007/s13202-025-02032-5]
- 59. The Apparent Lipophilicity of Quaternary Ammonium Ions Is... [https://link.springer.com/article/10.1023/A:1011001914685]
- 60. A method for measuring the lipophilicity of compounds in mixtures of... [https://pubmed.ncbi.nlm.nih.gov/21343602/]
- 61. Choosing the Right HPLC Column: A Complete Guide [https://www.phenomenex.com/knowledge-center/hplc-knowledge-center/choosing-the-right-hplc-column?srsltid=AfmBOopcWezhFcwvS7QOl1_9eZqrIKybpoDEwLE_-Z4O93-BXTo1DpOq]
- 62. Limits of rapid log P determination methods for highly ... [https://www.sciencedirect.com/science/article/abs/pii/S0003267016301908]
- 63. Online OCHEM multi-task model for solubility and ... [https://www.sciencedirect.com/science/article/pii/S0162013425000704]
- 64. Comparison of HPLC, HPTLC, and In Silico Lipophilicity ... [https://www.mdpi.com/1420-3049/29/11/2478]
- 65. Assessment of Lipophilicity Indices Derived from Retention ... [https://pmc.ncbi.nlm.nih.gov/articles/PMC6154650/]
- 66. Comprehensive Chemometric and Chromatographic ... [https://www.mdpi.com/1424-8247/18/12/1778]
- 67. Influence of organic modifier and separation modes for ... [https://www.sciencedirect.com/science/article/abs/pii/S0021967318309968]
- 68. Accessing lipophilicity of drugs with biomimetic models [https://www.sciencedirect.com/science/article/abs/pii/S0928098718300368]
- 69. The Impact of Lipophilicity in Drug Discovery [https://pubmed.ncbi.nlm.nih.gov/30039409/]
- 70. Enhancing Blood–Brain Barrier Penetration Prediction by ... [https://pmc.ncbi.nlm.nih.gov/articles/PMC11938273/]
- 71. Developing a predictive model for blood-brain-barrier ... [https://www.frontiersin.org/journals/toxicology/articles/10.3389/ftox.2025.1535112/full]
- 72. Prediction of blood–brain barrier and Caco-2 permeability ... [https://pmc.ncbi.nlm.nih.gov/articles/PMC12051285/]
- 73. Chromatographic retention parameters in medicinal ... [https://pubmed.ncbi.nlm.nih.gov/12570698/]
- 74. Octanol-water partition coefficient [https://en.wikipedia.org/wiki/Octanol-water_partition_coefficient]
- 75. Chromatographic Retention Parameters as Molecular ... [https://www.intechopen.com/chapters/40377]
- 76. Chromatography Fundamentals, Part III: Retention ... [https://www.chromatographyonline.com/view/chromatography-fundamentals-part-iii-retention-parameters-liquid-chromatography]
- 77. Retention behavior of lipids in reversed-phase ultrahigh ... [https://www.sciencedirect.com/science/article/abs/pii/S0021967316305556]
- 78. Application of Biomimetic Chromatography and QSRR ... [https://www.mdpi.com/1422-0067/26/5/1855]
- 79. Recent applications of liquid chromatography-based ... [https://pubmed.ncbi.nlm.nih.gov/41176062/]
- 80. Application of artificial intelligence to quantitative structure– ... [https://pmc.ncbi.nlm.nih.gov/articles/PMC11782803/]
- 81. Chemical Composition, Chemometric Analysis, and ... [https://www.mdpi.com/2297-8739/12/5/115]
- 82. New QSRR Model for Drug Discovery [https://www.chromatographyonline.com/view/new-qsrr-model-for-drug-discovery]
- 83. Application of QSRR models for predicting the retention ... [https://pubmed.ncbi.nlm.nih.gov/40651059/]
- 84. QSRR Models Sharpen Retention Time Predictions for ... [https://www.chromatographyonline.com/view/qsrr-models-sharpen-retention-time-predictions-for-plant-based-bioactives-in-chromatographic-analysis]
- 85. Advances in Hydrogel-Based Drug Delivery Systems - PMC [https://pmc.ncbi.nlm.nih.gov/articles/PMC11048949/]
- 86. Bio-inspired anisotropic hydrogels and their applications in ... [https://www.sciencedirect.com/science/article/pii/S2590238523004186]
- 87. Anisotropic, Hydrogel Microparticles as pH-Responsive ... [https://www.mdpi.com/1999-4923/15/5/1380]
- 88. Mathematical Modeling of Release Kinetics from ... [https://pmc.ncbi.nlm.nih.gov/articles/PMC6471682/]
- 89. Developing a machine learning model for accurate ... [https://www.nature.com/articles/s41467-024-46866-9]
- 90. Lipophilicity - an overview [https://www.sciencedirect.com/topics/biochemistry-genetics-and-molecular-biology/lipophilicity]
- 91. Role of Physicochemical Properties and Ligand ... [https://www.sciencedirect.com/science/article/abs/pii/S006577431045023X]
- 92. Lipophilicity, Pharmacokinetic Properties, and Molecular ... [https://pmc.ncbi.nlm.nih.gov/articles/PMC8224687/]
- 93. Integrating the Impact of Lipophilicity on Potency and ... [https://www.semanticscholar.org/paper/Integrating-the-Impact-of-Lipophilicity-on-Potency-Miller-Madeira/82871f26522683b534a3f73111ebeed1c061697a]