Demystifying QSAR Validation: A Practical Guide to the OECD Principles for Drug Discovery
This article provides a comprehensive guide to the OECD principles for QSAR validation, a cornerstone of modern computational toxicology and drug discovery.
Demystifying QSAR Validation: A Practical Guide to the OECD Principles for Drug Discovery
Abstract
This article provides a comprehensive guide to the OECD principles for QSAR validation, a cornerstone of modern computational toxicology and drug discovery. Tailored for researchers, scientists, and development professionals, it covers the fundamental rationale behind the principles, a step-by-step methodological breakdown of their application, common pitfalls and optimization strategies, and their role in regulatory acceptance versus alternative frameworks. The goal is to equip practitioners with the knowledge to build, validate, and confidently deploy robust, reliable QSAR models for predictive safety and efficacy assessment.
What Are the OECD QSAR Principles and Why Do They Matter in Biomedical Research?
The Genesis and Global Impact of the OECD Validation Framework
Within the context of a broader thesis on OECD principles for QSAR (Quantitative Structure-Activity Relationship) validation, this whitepaper details the genesis and global impact of the OECD Validation Framework. Established to promote the regulatory acceptance of (Q)SAR models for chemical hazard assessment, the framework provides a standardized, principle-based approach to ensure scientific rigor and reliability. Its development was driven by the need for efficient, animal-free safety assessment methods within regulatory decision-making, aligning with global efforts in green chemistry and the 3Rs (Replacement, Reduction, and Refinement of animal testing).
Genesis: The Five OECD Principles for QSAR Validation
The cornerstone of the framework is the set of five validation principles, formally adopted in 2004 (OECD Series on Testing and Assessment No. 49). They were established to evaluate if a (Q)SAR model is scientifically valid for a specific regulatory purpose.
Table 1: The Five OECD Principles for QSAR Validation
| Principle Number | Principle Name | Core Requirement |
|---|---|---|
| 1 | A defined endpoint | The endpoint being predicted must be unambiguous and biologically/regulatorily significant. |
| 2 | An unambiguous algorithm | The algorithm for generating the prediction must be described in a transparent and reproducible manner. |
| 3 | A defined domain of applicability | The chemical scope of the model must be clearly defined, indicating for which substances it is reliable. |
| 4 | Appropriate measures of goodness-of–fit, robustness, and predictivity | The model's performance must be assessed using internal (training set) and external (test set) validation statistics. |
| 5 | A mechanistic interpretation, if possible | A description of the mechanistic link between chemical descriptor and endpoint strengthens scientific confidence. |
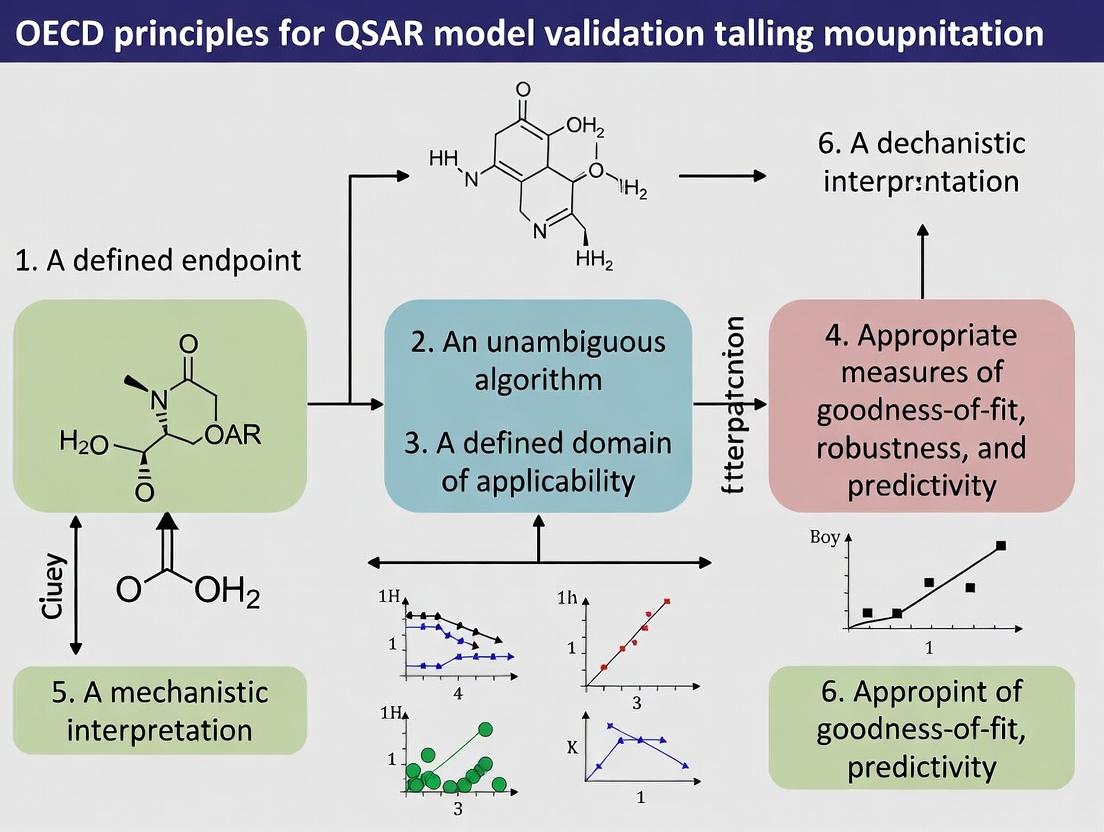
Title: Logical Flow of OECD QSAR Validation Principles
Experimental Protocol for QSAR Model Validation
Following the OECD principles, a standard validation protocol involves sequential steps.
Detailed Methodology for Key Validation Experiments:
- Endpoint Curation & Data Preparation: Assemble a high-quality dataset with measured endpoint values (e.g., LC50, mutagenicity). Apply strict quality controls. Split data into a training set (≈70-80%) and a hold-out external test set (≈20-30%) using defined algorithms (e.g., Kennard-Stone, sphere exclusion).
- Model Development & Internal Validation: On the training set, compute molecular descriptors. Develop the model using a chosen algorithm (e.g., Partial Least Squares, Random Forest). Perform internal validation via techniques like:
- Cross-validation (CV): Typically 5-fold or 10-fold CV. The dataset is partitioned, the model is rebuilt multiple times, and predictive performance is averaged.
- Y-scrambling: The endpoint values are randomly shuffled to confirm the model is not based on chance correlation.
- External Validation & Domain Definition: Apply the final model, frozen from the training step, to the external test set. Calculate external validation metrics (see Table 2). Define the Applicability Domain using methods such as leverage (Williams plot), distance-based measures, or descriptor ranges.
- Performance Assessment & Reporting: Calculate and report all statistical metrics for both internal and external validation. Provide a transparent description of the algorithm and, if available, a mechanistic rationale.
Table 2: Key Quantitative Metrics for QSAR Validation (Principle 4)
| Metric | Formula / Description | Acceptability Threshold (Typical) | Purpose |
|---|---|---|---|
| R² (Coefficient of Determination) | R² = 1 - (SSE/SST) | > 0.6 | Goodness-of-fit for training set. |
| Q² (Cross-validated R²) | Calculated during CV (e.g., LOO, 5-fold). | > 0.5 | Measure of internal robustness/predictivity. |
| RMSE (Root Mean Square Error) | RMSE = √[Σ(Ŷᵢ - Yᵢ)²/n] | Context-dependent; lower is better. | Overall error magnitude. |
| MAE (Mean Absolute Error) | MAE = Σ|Ŷᵢ - Yᵢ|/n | Context-dependent; lower is better. | Robust measure of average error. |
| Sensitivity (for Classification) | TP / (TP + FN) | > 0.7-0.8 | Ability to identify true positives. |
| Specificity (for Classification) | TN / (TN + FP) | > 0.7-0.8 | Ability to identify true negatives. |
| Concordance (for Classification) | (TP + TN) / Total | > 0.75-0.8 | Overall classification accuracy. |
SSE: Sum of Squared Errors of prediction; SST: Total Sum of Squares; Ŷᵢ: Predicted value; Yᵢ: Experimental value; n: number of compounds; TP: True Positive; TN: True Negative; FP: False Positive; FN: False Negative.
Title: Experimental Workflow for QSAR Model Validation
The Scientist's Toolkit: Key Research Reagent Solutions
Table 3: Essential Tools and Resources for QSAR Development & Validation
| Item/Resource | Function in QSAR Validation | Example(s) |
|---|---|---|
| Curated Chemical Databases | Source of high-quality experimental endpoint data for model training and testing. | EPA CompTox Chemistry Dashboard, OECD QSAR Toolbox, CHEMBL. |
| Chemical Standardization Tools | Ensure consistent representation of chemical structures (e.g., tautomers, salts) before descriptor calculation. | RDKit, OpenBabel, KNIME. |
| Molecular Descriptor Software | Calculate numerical representations of chemical structures that serve as model input variables. | DRAGON, PaDEL-Descriptor, RDKit Descriptors. |
| Machine Learning/Modeling Platforms | Provide algorithms for building regression and classification models and performing internal validation. | R (caret, randomForest), Python (scikit-learn), WEKA, MOE. |
| Applicability Domain (AD) Tools | Implement algorithms to define the chemical space where model predictions are considered reliable. | AMBIT, Standalone AD software within QSAR Toolbox. |
| Validation Statistics Software/Code | Calculate the suite of performance metrics required by OECD Principle 4. | Custom scripts in R/Python, QSARINS, Model Validation reports in KNIME. |
| OECD QSAR Toolbox | An integrative software supporting grouping, read-across, and profiling, with built-in functionality for applying OECD principles. | Primary tool for regulatory application of (Q)SARs and filling data gaps. |
Global Impact and Regulatory Adoption
The Framework has become the global benchmark, transforming regulatory science and chemical management.
Table 4: Global Impact of the OECD QSAR Validation Framework
| Region/Program | Impact and Adoption | Key Legislation/Context |
|---|---|---|
| European Union | Cornerstone of REACH legislation. Allows use of (Q)SAR predictions instead of testing for specific endpoints, provided they meet OECD principles. | REACH (EC 1907/2006), ECHA Guidance on QSARs. |
| United States | Used by EPA for chemical screening and prioritization under TSCA. Integrated into the Endocrine Disruptor Screening Program (EDSP). | TSCA, EPA's New Chemicals Program, OCSPP guidelines. |
| International Collaboration | Facilitates mutual acceptance of data (MAD) among OECD member countries, reducing non-tariff trade barriers. | OECD Mutual Acceptance of Data (MAD) system. |
| Global Harmonization | Provides a common language and standard, enabling joint projects and data sharing worldwide (e.g., IATA). | Integrated Approaches to Testing and Assessment (IATA). |
| Industry | Provides a clear roadmap for developing in-house models for early screening and R&D decision-making, reducing costs and animal use. | Internal safety assessment, green chemistry design. |
Title: Global Impact Pathways of the OECD Framework
The OECD Validation Framework for QSARs, grounded in its five principled pillars, has evolved from a theoretical construct into a foundational element of modern regulatory toxicology and green chemistry. By providing a rigorous, transparent, and internationally harmonized methodology for assessing model credibility, it has catalyzed the regulatory acceptance of non-animal methods, fostered global cooperation, and established a enduring standard for predictive science in chemical safety assessment. Its continued evolution remains critical for addressing new endpoint and emerging chemical challenges.
Within the context of quantitative structure-activity relationship (QSAR) model validation for regulatory use, the Organisation for Economic Co-operation and Development (OECD) principles provide the definitive framework. This whitepaper offers an in-depth technical guide to these five principles, explaining their role as a cornerstone in predictive toxicology and drug development research. Adherence to these principles ensures that QSAR models are scientifically valid, transparent, and fit for purpose in chemical risk assessment and pharmaceutical screening.
The Five OECD Principles: A Technical Deconstruction
The OECD principles were established to facilitate the regulatory acceptance of QSAR models. The following table summarizes the core quantitative and qualitative requirements of each principle.
Table 1: The Five OECD Principles for QSAR Validation
| Principle | Core Requirement | Key Metrics & Descriptors |
|---|---|---|
| 1. A defined endpoint | The biological or chemical effect being predicted must be unambiguous. | - Experimental protocol identifier (e.g., OECD TG 471).- Measured variable (e.g., LD50, EC50, Ames test result).- Units of measurement (e.g., mg/L, mmol/L, binary (+/-)). |
| 2. An unambiguous algorithm | A clear description of the computational procedure used to generate the prediction. | - Algorithm type (e.g., Multiple Linear Regression, Random Forest, Neural Network).- Algorithm software & version.- Complete set of equations and/or source code. |
| 3. A defined domain of applicability | The chemical space and response range for which the model is reliable must be specified. | - Structural/Descriptor ranges (e.g., log P: -2 to 5, MW: 50-500 g/mol).- Applicability domain method (e.g., Leverage, Distance-based, PCA).- Percentage of training set within domain (typically >80%). |
| 4. Appropriate measures of goodness-of-fit, robustness, and predictivity | The model must be statistically validated internally and externally. | - Goodness-of-fit: R², RMSE (Training set).- Robustness: Q² (LOO or LCO-CV), sPRESS.- Predictivity: R²ext, RMSEext, Concordance, Sensitivity/Specificity (Test set). |
| 5. A mechanistic interpretation, if possible | The model should be associated with a biologically meaningful mechanism. | - Key molecular descriptors (e.g., log P, HOMO/LUMO, polar surface area).- Correlation with known toxicophores or pharmacophores.- Alignment with Adverse Outcome Pathways (AOPs). |
Experimental Protocols for QSAR Validation
The validation of a QSAR model against the OECD principles requires rigorous experimental design. The following protocols are standard in the field.
Protocol 1: Defining the Applicability Domain (Principle 3)
Objective: To mathematically define the chemical space where the model's predictions are reliable. Methodology:
- Descriptor Calculation: Compute relevant molecular descriptors (e.g., constitutional, topological, electronic) for the training set compounds.
- Space Definition: Use a method such as:
- Leverage Approach: Calculate the hat matrix H = X(XᵀX)⁻¹Xᵀ, where X is the descriptor matrix. The warning leverage h is typically set to 3(p+1)/n, where p is the number of model descriptors and n is the number of training compounds. A new compound with leverage > h is outside the domain.
- Distance-Based Approach: Calculate the standardized Euclidean distance of a new compound to its k-nearest neighbors in the training set in descriptor space. A distance exceeding a predefined threshold (e.g., the maximum distance observed in the training set) places the compound outside the domain.
- Documentation: Report the method, parameters, and the percentage of the training set considered "inside" the domain.
Protocol 2: External Validation of Predictivity (Principle 4)
Objective: To assess the model's ability to predict new, untested data. Methodology:
- Data Splitting: Before model development, randomly divide the full dataset into a Training Set (~70-80%) for model building and a Test Set (~20-30%) for validation. Ensure both sets represent the chemical and response space.
- Model Development: Develop the QSAR model using only the training set data.
- Prediction & Evaluation: Use the finalized model to predict the endpoint values for the withheld test set.
- Statistical Calculation: Compute external validation metrics:
- R²ext: Coefficient of determination for the test set predictions.
- RMSEext: Root mean square error for the test set.
- Concordance Correlation Coefficient (CCC): Measures agreement between observed and predicted values.
- For classification models: Calculate Sensitivity, Specificity, and Accuracy.
Visualizing the QSAR Validation Workflow
The logical process of developing and validating an OECD-compliant QSAR model is depicted below.
QSAR Model Development and Validation Workflow
The Scientist's Toolkit: Essential Research Reagent Solutions
Implementing the OECD principles requires specific tools and materials. The following table lists key resources.
Table 2: Key Research Reagent Solutions for QSAR Validation
| Item | Function in QSAR Validation |
|---|---|
| Curated Chemical Databases (e.g., EPA CompTox, ChEMBL) | Provide high-quality, structured biological endpoint data for model training and testing (Principle 1). |
| Cheminformatics Software (e.g., RDKit, PaDEL-Descriptor) | Generate standardized molecular descriptors and fingerprints necessary for algorithm development and domain definition (Principles 2 & 3). |
| Statistical & ML Platforms (e.g., R, Python/scikit-learn, KNIME) | Implement modeling algorithms, perform cross-validation, and calculate all required goodness-of-fit/predictivity metrics (Principles 2 & 4). |
| Applicability Domain Toolkits (e.g., AMBIT, ISIDA/DA) | Specialized software for calculating leverage, distances, and other measures to formally define the model's domain (Principle 3). |
| Adverse Outcome Pathway (AOP) Knowledge Bases (e.g., OECD AOP Wiki) | Provide structured biological knowledge to support mechanistic interpretation of model descriptors (Principle 5). |
| QSAR Reporting Formats (e.g., QMRF, QPRF) | Standardized templates for documenting all model parameters and validation results, ensuring transparency and regulatory compliance. |
Quantitative Structure-Activity Relationship (QSAR) models, once primarily tools for chemical hazard assessment and regulatory compliance, have undergone a paradigm shift. Their application now critically underpins modern drug discovery pipelines. This whitepaper details this expansion, firmly framing the discussion within the context of the Organisation for Economic Co-operation and Development (OECD) principles for QSAR validation. We provide a technical guide on implementing these principles to develop robust, reliable models suitable for both regulatory submission and early-stage pharmaceutical research.
The migration of QSARs from regulatory toxicology to drug discovery necessitates an unwavering commitment to model validation. In regulatory contexts (e.g., REACH, ICH), validation ensures predictions are defensible for priority-setting and risk assessment. In drug discovery, it builds confidence in virtual screening, lead optimization, and ADMET (Absorption, Distribution, Metabolism, Excretion, Toxicity) prediction. The OECD principles provide the universal framework for this rigor.
The OECD Principles: A Framework for Reliability
For a QSAR model to be considered valid for use, it must satisfy the following five principles:
- A defined endpoint: The biological or chemical effect being modeled must be unambiguous and experimentally measurable.
- An unambiguous algorithm: A transparent description of the mathematical procedure and software used.
- A defined domain of applicability: Explicit boundaries within which the model's predictions are reliable.
- Appropriate measures of goodness-of-fit, robustness, and predictivity: Quantitative statistical validation.
- A mechanistic interpretation, if possible: Relating model descriptors to biological or chemical mechanisms increases scientific plausibility.
Core Methodologies & Experimental Protocols
Protocol for Developing an OECD-Compliant QSAR Model
Objective: To construct a validated QSAR model for predicting a specific endpoint (e.g., hERG channel inhibition, aqueous solubility).
Materials & Data:
- Chemical Dataset: A curated set of compounds with reliable, experimental endpoint data.
- Descriptor Calculation Software: e.g., DRAGON, PaDEL-Descriptor, RDKit.
- Modeling Platform: e.g., Python/R with scikit-learn/keras, WEKA, MOE.
- Validation Suite: Software for calculating OECD metrics.
Procedure:
- Data Curation: Clean structures, remove duplicates, correct experimental errors. Standardize chemical representation (e.g., tautomer, protonation state at physiological pH).
- Descriptor Generation & Filtering: Calculate molecular descriptors (2D, 3D) and fingerprints. Remove constant, near-constant, and highly correlated descriptors.
- Data Splitting: Partition data into Training Set (∼70-80%), Test Set (∼10-15%), and an external Validation Set (∼10-15%) not used in any model building.
- Model Building (Training Phase): Apply machine learning algorithms (e.g., Random Forest, Support Vector Machine, Neural Networks) on the training set. Use internal validation (e.g., 5-fold cross-validation) to tune hyperparameters.
- Internal Validation: Assess the model on the held-out Test Set. Calculate performance metrics (see Table 1).
- Domain of Applicability (DA) Definition: Establish a DA using methods like leverage (Williams plot), distance-based measures (e.g., Euclidean distance in descriptor space), or probability density-based approaches.
- External Validation: The ultimate test. Predict the endpoint for the external Validation Set compounds. Performance must meet pre-defined acceptance criteria.
- Mechanistic Interpretation: Analyze descriptor importance (e.g., feature ranking from Random Forest, PLS coefficients) to link molecular properties to the endpoint.
Protocol for Applying a QSAR Model in Virtual Screening
Objective: To computationally prioritize compounds from a large library for experimental testing.
Procedure:
- Library Preparation: Prepare a database of purchasable or in-house compounds (e.g., 1M molecules). Standardize structures.
- Descriptor Calculation: Compute the same set of descriptors used in the trained model.
- DA Filtering: For each compound, check if it falls within the model's DA. Flag or exclude outliers.
- Prediction & Ranking: Generate predictions for all compounds within the DA. Rank them by favorable predicted activity/perty.
- Diversity & Visual Inspection: Select a subset of top-ranked compounds ensuring structural diversity. Perform expert chemoinformatic review.
Data Presentation: Performance Metrics for Validated QSARs
Table 1: Key Statistical Metrics for QSAR Model Validation
| Metric | Formula / Description | Interpretation | Acceptability Threshold (Typical) |
|---|---|---|---|
| Goodness-of-Fit | Measures model performance on training data | ||
| R² (Training) | Coefficient of Determination | Proportion of variance explained by the model. | > 0.7 |
| RMSE (Training) | Root Mean Square Error | Average magnitude of prediction error. | Context-dependent. |
| Robustness | Measures model stability via internal CV | ||
| Q²ₙₒₒ or R²ₒᵥ | Predictive squared correlation coefficient from Leave-One-Out or k-fold CV. | Should be close to R² (training). | > 0.6, (Q² > 0.5) |
| Predictivity | Measures performance on unseen data | ||
| R² (Test/Ext) | R² on external test/validation set. | Gold standard for real-world accuracy. | > 0.6 |
| RMSE (Test/Ext) | RMSE on external set. | Should be comparable to training RMSE. | Context-dependent. |
| Classification Metrics | For categorical endpoints (e.g., active/inactive) | ||
| Accuracy | (TP+TN)/(TP+TN+FP+FN) | Overall correct classification rate. | > 0.7 |
| Sensitivity/Recall | TP/(TP+FN) | Ability to identify true actives. | > 0.7 |
| Specificity | TN/(TN+FP) | Ability to identify true inactives. | > 0.7 |
| AUC-ROC | Area Under ROC Curve | Overall ranking performance. | > 0.8 |
TP=True Positive, TN=True Negative, FP=False Positive, FN=False Negative
Visualizing the Integrated Workflow
Diagram Title: OECD-Compliant QSAR Model Development and Application Workflow
The Scientist's Toolkit: Key Research Reagent Solutions
Table 2: Essential Materials & Tools for QSAR Modeling
| Item/Category | Example Product/Software | Primary Function in QSAR Workflow |
|---|---|---|
| Chemical Databases | PubChem, ChEMBL, ZINC15, DrugBank | Sources of experimental bioactivity and property data for model training and validation. |
| Descriptor Calculation | RDKit (Open Source), DRAGON, MOE, PaDEL-Descriptor | Generates numerical representations (descriptors/fingerprints) of molecular structures. |
| Modeling & ML Platforms | Python (scikit-learn, TensorFlow), R (caret), WEKA, KNIME | Provides algorithms for building regression/classification models (RF, SVM, ANN, etc.). |
| Validation Software | QSAR-Co, MFMLab, in-house scripts | Calculates OECD validation metrics and defines the Domain of Applicability. |
| Cheminformatics Suites | OpenBabel, ChemAxon JChem, Schrödinger Suite | Handles chemical file format conversion, standardization, and basic molecular properties. |
| Visualization | Matplotlib/Seaborn (Python), Spotfire, Graphviz | Creates plots for model diagnostics (Williams plots, ROC curves) and workflow diagrams. |
| High-Performance Computing | Local Clusters, Cloud (AWS, GCP) | Provides computational power for descriptor calculation and training on large datasets. |
The development and validation of Quantitative Structure-Activity Relationship (QSAR) models represent a cornerstone in modern computational toxicology and drug discovery. This guide is framed within the broader thesis that adherence to the Organisation for Economic Co-operation and Development (OECD) principles for QSAR validation is not merely a regulatory checkbox but a foundational framework for ensuring scientific integrity. These principles—a defined endpoint, an unambiguous algorithm, a defined domain of applicability, appropriate measures of goodness-of-fit, robustness, and predictivity, and a mechanistic interpretation, where possible—provide the scaffold for achieving reliability, transparency, and regulatory readiness. For researchers and drug development professionals, rigorous implementation of these principles translates to trustworthy predictions that can confidently inform safety assessments and early-stage lead optimization.
Core Methodologies & Experimental Protocols for QSAR Validation
Protocol for Defining the Applicability Domain (AD)
The Applicability Domain defines the chemical space on which the model is trained and for which its predictions are reliable.
- Descriptor Calculation: Compute a relevant set of molecular descriptors (e.g., topological, electronic, geometrical) for the entire training set using standardized software (e.g., RDKit, Dragon).
- Domain Characterization: Employ a combination of methods:
- Range-Based: For each descriptor, define the min/max values observed in the training set.
- Distance-Based: Calculate the similarity of a new compound to the training set. Common metrics include the Euclidean distance or Mahalanobis distance in the principal component space of the descriptors.
- Leverage Approach: Compute the leverage (h) for a new compound using the descriptor matrix (X) of the training set: ( h = x^T (X^TX)^{-1} x ), where x is the descriptor vector of the new compound. A leverage greater than the warning leverage ( h^* = 3p/n ) (where p is the number of model parameters and n is the number of training compounds) indicates the compound is outside the AD.
- Decision Rule: A compound is considered within the AD only if it satisfies all chosen criteria (e.g., within range for >95% of descriptors and similarity distance below a defined threshold).
Protocol for Assessing Robustness (Internal Validation)
Robustness evaluates the model's stability to perturbations in the training data.
- Resampling Procedure: Perform k-fold cross-validation (typically k=5 or 10) or repeated leave-many-out validation.
- Model Training & Prediction: For each iteration, hold out a subset of data, train the model on the remaining data, and predict the held-out values.
- Metric Calculation: Calculate performance metrics (e.g., ( Q^2 ) (cross-validated R²), RMSEcv) for the predictions across all iterations.
- Acceptance Criterion: A model is generally considered robust if ( Q^2 > 0.5 ), though domain-specific thresholds apply.
Protocol for Assessing Predictivity (External Validation)
Predictivity is the ultimate test of a model's performance on truly independent data.
- Data Splitting: Initially, the full dataset is rationally split into a training set (~70-80%) and a completely independent test set (~20-30%). Splitting should ensure the test set is within the AD of the training model.
- Blind Prediction: The model is built exclusively on the training set. Its finalized form (algorithm, parameters) is then used to predict the endpoint values for the test set compounds without any further adjustment.
- Metric Calculation: Calculate external validation metrics comparing predictions to experimental values for the test set (see Table 1).
Data Presentation: Key Validation Metrics
Table 1: Core Quantitative Metrics for QSAR Model Validation
| Metric | Formula | Interpretation | Ideal Value |
|---|---|---|---|
| R² (Fit) | ( 1 - \frac{\sum (yi - \hat{y}i)^2}{\sum (y_i - \bar{y})^2} ) | Goodness-of-fit for training data. | > 0.7 |
| Q² (LOO-CV) | ( 1 - \frac{\sum (yi - \hat{y}{(i)})^2}{\sum (y_i - \bar{y})^2} ) | Internal robustness via leave-one-out cross-validation. | > 0.5 |
| RMSE | ( \sqrt{\frac{1}{n} \sum (yi - \hat{y}i)^2} ) | Average prediction error (same units as y). | As low as possible |
| RMSEext | ( \sqrt{\frac{1}{n{ext}} \sum (y{ext} - \hat{y}_{ext})^2} ) | Average error on the external test set. | Comparable to RMSE |
| CCC | ( \frac{2 \cdot \sum (yi - \bar{y})(\hat{y}i - \bar{\hat{y}})}{\sum (yi - \bar{y})^2 + \sum (\hat{y}i - \bar{\hat{y}})^2 + n(\bar{y} - \bar{\hat{y}})^2} ) | Concordance correlation coefficient; measures agreement. | Close to 1 |
| MAE | ( \frac{1}{n} \sum |yi - \hat{y}i| ) | Mean Absolute Error; robust to outliers. | As low as possible |
Table 2: Summary of OECD Principle Implementation Workflow
| OECD Principle | Technical Implementation Method | Output/Documentation for Transparency |
|---|---|---|
| 1. Defined Endpoint | Use standardized experimental protocols (e.g., OECD TG). | Clear endpoint definition, units, measurement conditions. |
| 2. Unambiguous Algorithm | Use open-source scripts (Python/R) or fully described commercial software settings. | Published code, software name/version, all equation parameters. |
| 3. Defined Applicability Domain | Leverage, PCA, or similarity-based methods (Protocol 2.1). | List of descriptors with ranges, similarity threshold value. |
| 4. Goodness-of-Fit & Robustness | Calculate R², RMSE; perform cross-validation (Protocol 2.2). | Table of internal validation metrics (as in Table 1). |
| 5. Predictivity | External validation with hold-out test set (Protocol 2.3). | Table of external validation metrics and scatter plot. |
| 6. Mechanistic Interpretation | Descriptor significance analysis, mapping to known pathways. | Discussion of key descriptors and their physicochemical meaning. |
Visualizing the QSAR Validation Workflow
QSAR Validation Workflow Aligned with OECD Principles
Decision Logic for Applying a Validated QSAR Model
The Scientist's Toolkit: Essential Research Reagent Solutions
Table 3: Key Resources for QSAR Development & Validation
| Item / Solution | Function in QSAR Workflow | Example Source / Tool |
|---|---|---|
| Curated Chemical/Activity Databases | Provides high-quality training and test data with standardized endpoints. | ChEMBL, PubChem, OECD QSAR Toolbox. |
| Chemical Descriptor Software | Generates numerical representations of molecular structures for modeling. | DRAGON, PaDEL-Descriptor, RDKit (Open Source). |
| Chemoinformatics & Modeling Suites | Platforms for data analysis, model building, and validation. | KNIME, Orange Data Mining, Scikit-learn (Python). |
| Applicability Domain Scripts | Implements algorithms to define and assess chemical domain borders. | AMBIT (Toxtree), In-house Python/R scripts. |
| Statistical Validation Packages | Automates calculation of fit, robustness, and predictivity metrics. | Caret (R), scikit-learn model_selection (Python). |
| Mechanistic Alert & Profiling Tools | Links structural features to potential toxicological mechanisms. | OECD QSAR Toolbox, Sarah Nexus, Derek Nexus. |
| Reporting Template (OECD MQN) | Ensures transparent and standardized reporting of models for regulatory submission. | OECD (Q)SAR Model Reporting Format (MRF). |
Adherence to the OECD principles for QSAR validation provides a systematic, defensible, and transparent pathway from model conception to regulatory application. By implementing the detailed protocols for domain definition, robustness, and predictivity testing outlined herein, researchers generate not just predictive models, but credible scientific evidence. The resulting reliability builds trust in computational predictions, the inherent transparency facilitates peer review and collaboration, and together, they form the bedrock of regulatory readiness—enabling the confident use of QSAR models to support critical decisions in drug development and chemical safety assessment.
Implementing the OECD Principles: A Step-by-Step Guide to QSAR Model Development
Quantitative Structure-Activity Relationship (QSAR) models are pivotal computational tools in modern regulatory science and drug discovery, enabling the prediction of chemical properties, toxicity, and biological activity. Their reliable application, however, hinges on rigorous validation. The Organisation for Economic Co-operation and Development (OECD) established a set of five principles to ensure the regulatory acceptability of QSAR models. The first and foundational principle is "a defined endpoint." This principle mandates a clear, unambiguous definition of the biological or chemical effect being modeled, forming the bedrock upon which a curated dataset is built. This technical guide elaborates on the operationalization of this principle, detailing the methodologies for endpoint specification and the subsequent construction of a high-quality, fit-for-purpose dataset.
Deconstructing the "Defined Endpoint"
A defined endpoint is not merely a label (e.g., "mutagenicity"). It is a precise operational specification of the biological effect, the experimental conditions under which it was measured, and the units of measurement. Ambiguity here propagates through model development, leading to unreliable and non-interpretable predictions.
Core Components of a Defined Endpoint:
- Biological/Chemical Phenomenon: The specific effect (e.g., Ames test mutagenicity, LogP for lipophilicity, IC50 for kinase inhibition).
- Assay Protocol & Experimental Conditions: Standardized test guidelines (e.g., OECD TG 471 for Ames test), species, cell line, exposure time, pH, temperature.
- Measured Value and Units: The quantitative or qualitative result (e.g., revertant count, partition coefficient, molar concentration).
- Data Type: Continuous (e.g., pIC50), categorical (e.g., active/inactive), or ordinal.
Table 1: Examples of Poorly vs. Well-Defined Endpoints
| Poorly Defined Endpoint | Well-Defined Endpoint (OECD-aligned) |
|---|---|
| "Cytotoxicity" | "In vitro cell viability inhibition measured in human hepatocarcinoma (HepG2) cells after 48h exposure, expressed as half-maximal inhibitory concentration (IC50) in µM, following OECD Guidance Document 129." |
| "Water Solubility" | "Intrinsic water solubility (S_w) measured in pure water at 25°C using the shake-flask method (OECD TG 105), expressed in mol/L." |
| "hERG Blockage" | "Inhibition of the human Ether-à-go-go-Related Gene potassium channel current measured via patch-clamp electrophysiology in transfected mammalian cells, expressed as percentage inhibition at 10 µM test concentration." |
Protocol for Building a Curated Dataset
Once the endpoint is rigorously defined, the creation of a curated dataset follows a systematic, multi-stage protocol. This process transforms raw, scattered data into a reliable model-ready resource.
Experimental Protocol for Data Curation
Stage 1: Data Sourcing and Aggregation
- Objective: Collect all available relevant data from public and proprietary sources.
- Methodology:
- Identify relevant databases (e.g., PubChem BioAssay, ChEMBL, EPA's CompTox Chemicals Dashboard, DrugBank).
- Perform structured queries using chemical identifiers (SMILES, InChIKey, CAS RN) and endpoint-specific keywords aligned with the definition.
- Extract associated metadata (assay ID, experimental parameters, measurement values, confidence scores).
- Log all sources with provenance information (Source, ID, Access Date).
Stage 2: Data Standardization and Harmonization
- Objective: Ensure chemical structures and data values are consistent and comparable.
- Methodology:
- Chemical Structure Standardization: Use toolkits (e.g., RDKit, OpenBabel) to: desalt molecules, neutralize charges, generate canonical SMILES, remove duplicates, and verify valence correctness.
- Endpoint Value Harmonization: Convert all activity values to a uniform scale and unit (e.g., all IC50 to pIC50 = -log10(IC50[M])). For categorical data, apply consistent classification thresholds (e.g., active if IC50 < 10 µM).
Stage 3: Quality Control and Curation
- Objective: Identify and resolve errors, inconsistencies, and outliers.
- Methodology:
- Plausibility Filtering: Remove physically impossible values (e.g., negative solubility, LogP > 25).
- Outlier Detection: Employ statistical (e.g., Z-score, IQR) and chemical domain expertise to flag outliers for manual review.
- Conflict Resolution: For multiple measurements on the same compound, apply rules: prioritize data from the definitive assay (as per endpoint definition), use the highest quality source, or compute a weighted average. Document all decisions.
- Chemical Space Analysis: Use principal component analysis (PCA) or t-SNE on molecular descriptors to visualize coverage and identify clusters/voids.
Stage 4: Final Dataset Assembly and Documentation
- Objective: Produce a fully annotated, ready-to-use dataset.
- Methodology:
- Assemble the final list of unique, standardized chemical structures.
- Attach the harmonized endpoint value for each compound.
- Include crucial metadata columns: compound identifier, endpoint value, endpoint definition, data source, confidence flag.
- Create a comprehensive README document detailing all curation steps, decision rules, and software versions used.
Title: QSAR Dataset Curation Workflow
The Scientist's Toolkit: Essential Research Reagent Solutions
Table 2: Key Tools and Resources for Endpoint Definition and Dataset Curation
| Tool/Resource Name | Category | Primary Function | Key Features for Curation |
|---|---|---|---|
| ChEMBL | Public Database | Repository of bioactive molecules with drug-like properties. | Provides standardized bioactivity data (IC50, Ki, etc.) linked to detailed assay descriptions, enabling precise endpoint mapping. |
| OECD QSAR Toolbox | Software Platform | Grouping of chemicals into categories and filling data gaps. | Critical for applying OECD principles, identifying analogue chemicals, and accessing regulatory datasets for endpoint clarification. |
| RDKit | Open-Source Cheminformatics | Programming toolkit for cheminformatics. | Performs chemical standardization, descriptor calculation, and substructure analysis essential for data cleaning and exploration. |
| KNIME Analytics Platform | Data Analytics Integration | Visual programming for data pipelining. | Enables building reproducible, documented workflows that integrate data sourcing, standardization, and modeling steps. |
| PubChem | Public Database | World's largest collection of freely accessible chemical information. | Aggregates data from hundreds of sources, useful for initial data gathering and cross-referencing activity values. |
| pKa & LogP Predictors (e.g., ChemAxon, ACD/Labs) | Predictive Software | Calculates key physicochemical properties. | Used to flag implausible experimental values during quality control and to generate predictive descriptors. |
| EPA CompTox Chemicals Dashboard | Regulatory Database | Access to EPA-curated chemistry, toxicity, and exposure data. | Provides high-quality, well-defined toxicity endpoints aligned with OECD test guidelines for environmental QSARs. |
Data Presentation: Quantitative Analysis of a Curated Dataset
The impact of curation is demonstrable. The following table summarizes a hypothetical but realistic analysis comparing raw aggregated data to the final curated dataset for an Ames mutagenicity model (Endpoint: Binary outcome from Salmonella typhimurium reverse mutation assay, following OECD TG 471).
Table 3: Impact of Curation on Dataset Quality for an Ames Mutagenicity Model
| Metric | Raw Aggregated Data | After Stage 2 (Standardization) | Final Curated Dataset (After Stage 3) |
|---|---|---|---|
| Total Unique Compounds | 12,500 | 11,200 (10.4% reduction) | 9,850 (21.2% reduction) |
| Inconsistent Activity Labels | ~850 compounds with conflicting calls | Resolved to single label per compound | All conflicts resolved via rule-based prioritization |
| Presence of Inorganic/Salts | 320 entries | Removed (0 retained) | Removed |
| Duplicates (by InChIKey) | ~1,300 duplicate entries | Removed (0 retained) | Removed |
| Data Source Coverage | 18 different databases | Harmonized from 18 sources | 4 high-priority sources retained for final model |
| Activity Ratio (Active:Inactive) | 42:58 | 45:55 | 40:60 (after outlier removal) |
Principle 1 is not an administrative formality but a scientific imperative. A meticulously defined endpoint provides the "true north" for all subsequent model development. The rigorous, transparent process of building a curated dataset directly addresses the fundamental OECD tenets of transparency (documented process) and scientific robustness (reliable input data). Without this disciplined foundation, even the most sophisticated algorithmic approaches (Principles 4 & 5) risk producing models that are numerically sound but scientifically meaningless. Therefore, investing substantial effort in defining the endpoint and curating the dataset is the most critical step in developing a QSAR model fit for purpose in regulatory decision-making or drug discovery.
Within the Organisation for Economic Co-operation and Development (OECD) principles for the validation of Quantitative Structure-Activity Relationship (QSAR) models, Principle 2 is fundamental for ensuring scientific rigor and regulatory acceptance. It states: "An unambiguous algorithm" must be provided. This principle mandates that the methodology used to generate a predictive model is transparent, fully described, and reproducible by an independent party. For researchers and drug development professionals, this moves beyond mere model performance; it requires a defensible, stepwise rationalization of the chosen algorithm, its parameters, and its suitability for the specific endpoint being predicted. This guide details the technical implementation of this principle in modern computational chemistry and cheminformatics workflows.
Core Concept: Defining "Unambiguous Algorithm"
An unambiguous algorithm is a precisely defined, step-by-step computational procedure. In QSAR context, this encompasses the entire modeling pipeline:
- Molecular Structure Representation: How chemical structures are converted into numerical or graphical descriptors.
- Descriptor Calculation & Selection: The exact set of molecular descriptors and the method for their calculation and selection.
- Mathematical Form of the Model: The type of model (e.g., linear regression, support vector machine, random forest, neural network) and its exact equation or architecture.
- Fitting Procedure: The optimization method and its associated parameters (e.g., learning rate, convergence criteria, number of trees).
- Applicability Domain Definition: The method for determining the chemical space where the model's predictions are reliable.
Ambiguity in any step compromises the model's reproducibility and challenges its use in regulatory decision-making.
Detailed Methodologies for Key Algorithmic Steps
Protocol for Molecular Descriptor Calculation and Rationalization
Objective: To generate a consistent, reproducible, and chemically meaningful numerical representation of compounds.
Procedure:
- Standardization: Apply a canonical standardization protocol (e.g., using RDKit or OpenBabel) to all input structures: neutralize charges, remove salts, generate canonical tautomers, and enforce specific stereo-chemistry rules.
- Descriptor Suite Selection: Choose a defined suite of descriptors a priori based on mechanistic understanding of the endpoint. Example suites include: RDKit 2D descriptors, Mordred descriptors, or Dragon-like subsets (e.g., topological, constitutional, electronic).
- Calculation: Compute all descriptors in the chosen suite using a specified software version (e.g.,
mordredlibrary v1.2.0). - Descriptor Filtering & Reduction: a. Remove descriptors with zero or near-zero variance (variance < 1e-7). b. Remove one of any pair of descriptors with correlation > 0.95 (Pearson's r). c. Apply a variance inflation factor (VIF) threshold (<5) to reduce multicollinearity in linear models.
- Documentation: Record the final descriptor list, their calculated values for the training set, and the software/version used.
Protocol for Model Algorithm Selection and Training
Objective: To select and train a predictive model with a fully specified, reproducible algorithm.
Procedure:
- Data Splitting: Perform a defined split (e.g., 70/15/15) into training, validation (for hyperparameter tuning), and external test sets. Use a stratified method for classification to preserve class ratios. Seed all random number generators (e.g.,
random_state=42). - Algorithm Rationalization: Justify the choice of algorithm (e.g., Random Forest) based on data characteristics: non-linearity, descriptor dimensionality, and endpoint nature (categorical/continuous).
- Hyperparameter Definition & Tuning: a. Define the hyperparameter search space explicitly (see Table 1). b. Use a specified cross-validation method (e.g., 5-fold stratified CV) on the training set only. c. Employ a defined search strategy (e.g., Bayesian optimization for 50 iterations) to identify the optimal hyperparameters, optimizing for a predefined metric (e.g., balanced accuracy for classification).
- Final Model Training: Train the final model using the optimized hyperparameters on the entire training set.
- Model Serialization: Save the final model object (e.g., as a
.pklfile) along with all necessary metadata (scalers, descriptor list, applicability domain model).
Table 1: Example Hyperparameter Search Space for Common Algorithms
| Algorithm | Hyperparameter | Rationale for Inclusion | Specified Search Range/Options |
|---|---|---|---|
| Random Forest | n_estimators |
Controls ensemble size/complexity | [100, 200, 500] |
max_depth |
Limits tree depth to prevent overfitting | [5, 10, 20, None] | |
min_samples_split |
Minimum samples to split a node | [2, 5, 10] | |
| Support Vector Machine (RBF) | C |
Regularization parameter | Log-uniform: [1e-3, 1e3] |
gamma |
Kernel inverse radius | Log-uniform: [1e-4, 1e1] | |
| Gradient Boosting | learning_rate |
Shrinkage of tree contributions | [0.01, 0.05, 0.1] |
n_estimators |
Number of boosting stages | [100, 200] | |
max_depth |
Individual tree depth | [3, 5, 7] |
Adherence to Principle 2 enables fair, unambiguous comparison of model performance. Below is a template for reporting key metrics.
Table 2: Mandatory Performance Metrics for QSAR Model Reporting (Example Data)
| Metric | Purpose | Calculation | Acceptability Threshold (Example) | Model A (RF) | Model B (SVM) |
|---|---|---|---|---|---|
| Q² (LOO-CV) | Internal predictive ability | 1 - (PRESS/SStotal) | > 0.5 | 0.72 | 0.68 |
| R²test | Goodness of fit on external test set | Cov²xy/(σxσy) | > 0.6 | 0.75 | 0.70 |
| RMSEtest | Prediction error magnitude | √(Σ(Ŷi-Yi)²/n) | Context-dependent | 0.45 | 0.52 |
| Sensitivity | Ability to identify positives | TP / (TP + FN) | > 0.7 | 0.85 | 0.78 |
| Specificity | Ability to identify negatives | TN / (TN + FP) | > 0.7 | 0.82 | 0.88 |
| Balanced Accuracy | Overall accuracy for imbalanced data | (Sensitivity + Specificity) / 2 | > 0.7 | 0.835 | 0.83 |
Visualizing the QSAR Modeling Workflow
Title: Unambiguous QSAR Model Development Workflow
The Scientist's Toolkit: Essential Research Reagents & Solutions
Table 3: Key Computational Tools for Implementing Principle 2
| Item/Category | Specific Examples | Function & Role in Ensuring an Unambiguous Algorithm |
|---|---|---|
| Cheminformatics Library | RDKit, OpenBabel | Performs canonical structure standardization, descriptor calculation, and substructure searching. Version control is critical. |
| Descriptor Calculation Suite | Mordred, PaDEL, Dragon | Generates a comprehensive, reproducible set of molecular descriptors from standardized structures. |
| Machine Learning Framework | Scikit-learn, XGBoost, TensorFlow/PyTorch | Provides well-documented, versioned implementations of algorithms with controlled random seeds for reproducibility. |
| Hyperparameter Optimization | Optuna, Scikit-optimize, GridSearchCV | Systematically and reproducibly searches the defined parameter space to identify optimal model settings. |
| Model Serialization | Joblib (*.pkl), ONNX, PMML |
Saves the exact model state, including all weights, parameters, and scaling factors, for independent reloading and prediction. |
| Version Control System | Git, with platforms like GitHub/GitLab | Tracks every change to code, descriptors, and model parameters, providing a complete audit trail. |
| Containerization | Docker, Singularity | Encapsulates the entire software environment (OS, libraries, code) to guarantee identical execution across different machines. |
| Applicability Domain Tool | AMBIT, DCDistance, PCA-based methods | Implements a specified method to define the chemical space where the model's predictions are considered reliable. |
The Organisation for Economic Co-operation and Development (OECD) Principles for the Validation of (Quantitative) Structure-Activity Relationship [(Q)SAR] Models provide a foundational framework for regulatory acceptance of predictive computational tools. Principle 3 explicitly mandates that a model must be accompanied by a "definition of its applicability domain" (AD). This principle acknowledges that no model is universally valid; its reliability is confined to the chemical space for which it was developed and validated. Within drug development, defining the AD is critical for assessing the reliability of predictions for novel compounds, thereby mitigating risk in decision-making processes related to lead optimization, toxicity assessment, and prioritization of synthetic targets.
Theoretical Foundation and Significance
The Applicability Domain represents the response and chemical structure space of the training set, characterized by the model's descriptors and the modeled response. Predictions for new compounds falling within this domain are considered reliable, while extrapolation outside the AD carries higher uncertainty. Key conceptual approaches include:
- Range-Based Methods: Define boundaries based on the range of individual descriptor values in the training set.
- Distance-Based Methods: Assess the similarity of a new compound to the training set molecules (e.g., leverage, Euclidean distance, Mahalanobis distance).
- Geometric Methods: Define the convex hull of the training set in the descriptor space.
- Probability Density Distribution Methods: Estimate the probability density of the training set.
Failure to define and respect the AD can lead to inaccurate predictions, wasted resources, and potential safety issues in downstream development.
Methodologies for Defining the Applicability Domain
Descriptor Range-Based Approach (Bounding Box)
This method defines the AD as the multidimensional rectangle spanned by the minimum and maximum values of each descriptor used in the model.
Experimental Protocol:
- Descriptor Calculation: Compute all model descriptors for the training set compounds.
- Range Determination: For each descriptor
i, identify its minimum (min_i) and maximum (max_i) value across the training set. - AD Criterion Definition: A query compound is considered within the AD if, for every descriptor
i, its valuex_isatisfies:min_i - δ ≤ x_i ≤ max_i + δ, whereδis a small tolerance (often 0 or a scaled fraction of the range). - Application: For a new compound, calculate its descriptors and verify compliance with all ranges. Flag any descriptor value outside the defined bounds.
Leverage and Williams Plot
Leverage (h_i) measures a compound's influence on its own prediction and its position in the descriptor space relative to the model's centroid. The Williams plot combines leverage and standardized residuals.
Experimental Protocol:
- Model Matrix: For a linear model with
pdescriptors andntraining compounds, construct then x (p+1)model matrixX(including intercept). - Leverage Calculation: Calculate the hat matrix
H = X(XᵀX)⁻¹Xᵀ. The leverage for compoundiis thei-th diagonal element ofH(h_ii). The warning leverageh*is typically set to3(p+1)/n. - Standardized Residuals: Compute the cross-validated or externally validated standardized residuals for each compound.
- Plotting: Generate a Williams plot with leverage (
h_i) on the x-axis and standardized residual on the y-axis. Define AD boundaries ath*and ±3 standard residual units. - Interpretation: Compounds with high leverage (
h_i > h*) are structurally influential or outliers in descriptor space. Compounds with high residuals are response outliers.
Distance-Based Methods: k-Nearest Neighbors (k-NN)
This approach assesses the similarity of a query compound to its nearest neighbors in the training set within the multidimensional descriptor space.
Experimental Protocol:
- Descriptor Space Normalization: Standardize all descriptors (e.g., zero mean, unit variance) to ensure equal weighting in distance calculation.
- Distance Metric Selection: Choose a suitable metric (e.g., Euclidean, Manhattan, Mahalanobis).
- Threshold Determination: For each training set compound, calculate the mean distance to its
knearest neighbors within the training set. Establish a threshold distanced_thras, for example, the 90th percentile of these mean distances. - AD Assessment: For a new compound, find its
knearest neighbors in the training set and compute the mean distanced_q. Ifd_q ≤ d_thr, the compound is within the AD.
Table 1: Common Applicability Domain Methods and Their Key Parameters
| Method | Core Metric | Typical Threshold | Advantages | Limitations |
|---|---|---|---|---|
| Descriptor Range | Per-descriptor value | min_i, max_i |
Simple, intuitive, fast to compute. | Does not account for correlation between descriptors. High-dimensional space can be overly restrictive. |
| Leverage | Hat value (h_i) |
h* = 3(p+1)/n |
Integrated with model structure. Identifies influential points. | Primarily for linear models. Requires matrix inversion. |
| k-NN Distance | Mean distance to k neighbors | Percentile-based (e.g., 90th) | Intuitive similarity measure. Non-parametric. | Computationally intensive for large sets. Choice of k and metric is critical. |
| PCA-Based Domain | Score in principal component space | Hotelling's T², DModX | Handles descriptor correlation. Reduces dimensionality. | Interpretation of PCs can be complex. |
Table 2: Example AD Assessment for a Hypothetical hERG Inhibition QSAR Model
| Compound ID | Prediction (pIC50) | Experimental (pIC50) | In AD? (Y/N) | Reason if Outside |
|---|---|---|---|---|
| Train-045 | 5.2 | 5.3 | Y | - |
| Train-128 | 6.8 | 4.9 | N | High residual (Response outlier) |
| New-001 | 6.1 | N/A | Y | All descriptors within range, leverage < h* |
| New-002 | 7.5 | N/A | N | Mean k-NN distance > d_thr (Structural outlier) |
Visualizing the Applicability Domain Concept
Decision Flow for Model Applicability Assessment
Structural Outlier Outside the Convex Hull AD
The Scientist's Toolkit: Key Research Reagent Solutions
Table 3: Essential Resources for AD Development and Assessment
| Item / Solution | Function in AD Definition | Example/Note |
|---|---|---|
| Chemical Descriptor Software | Calculates molecular fingerprints, topological, electronic, and geometric descriptors for training and query sets. | Dragon, MOE, RDKit, PaDEL-Descriptor. |
| Cheminformatics Libraries | Provides programming tools for similarity searching, distance calculations, and AD algorithm implementation. | RDKit, CDK, ChemPy. |
| Model Development Suites | Often include built-in modules for leverage calculation, PCA, and domain estimation. | SIMCA (for PLS), KNIME, Orange. |
| Curated Chemical Databases | Source of training set structures and associated biological data; quality is paramount. | ChEMBL, PubChem, DrugBank. |
| Statistical Software/Environments | For advanced statistical distance measures (Mahalanobis), clustering, and threshold optimization. | R, Python (SciPy, scikit-learn), MATLAB. |
| Standardized Data Formats | Ensures interoperability between tools in the AD assessment workflow. | SMILES, SDF, CSV. |
Implementation Workflow and Best Practices
Detailed Protocol for a Consolidated AD Assessment:
- Training Set Curation: Assemble a high-quality, curated set of compounds with measured endpoints. Ensure diversity but relevance to the target chemical space.
- Descriptor Calculation & Selection: Calculate a broad pool of descriptors. Apply feature selection to reduce dimensionality and remove redundant/correlated variables relevant to the model.
- Model Training: Develop the QSAR model using the selected descriptors and training set.
- Multi-Method AD Definition:
- Calculate descriptor ranges for the final descriptor set.
- Compute the leverage warning threshold
h*for the model. - Perform PCA on the training set descriptors. Calculate the critical Hotelling's T² (for scores) and DModX (for residuals) thresholds at a chosen confidence level (e.g., 95%).
- Determine the optimal
kand threshold distanced_thrfor the k-NN approach via cross-validation.
- AD Integration: Establish a consensus rule. For example: a query compound is considered within the AD only if it passes all criteria (within all descriptor ranges, leverage < h*, T² and DModX below critical limits, and mean distance < d_thr). A more relaxed rule might require passing 3 out of 4.
- Reporting: Document all AD criteria, thresholds, and software used. The AD must be transportable and transparent for end-users.
Best Practices:
- Use Multiple Methods: A consensus approach increases robustness.
- Visualize: Always use Williams plots, PCA score plots, and distance distributions to communicate the AD.
- Context Matters: The strictness of the AD should reflect the model's purpose (screening vs. regulatory).
- Continuous Refinement: As more reliable data becomes available, the training set and AD can be expanded.
Within the OECD framework for the validation of Quantitative Structure-Activity Relationship (QSAR) models, Principle 4 is a critical determinant of model reliability and regulatory acceptance. It mandates that a model must be assessed using both internal validation (to ensure robustness and prevent overfitting) and external validation (to evaluate predictive power and generalizability). This principle moves beyond simple statistical goodness-of-fit to a rigorous, protocol-driven evaluation of model performance. For researchers and drug development professionals, the implementation of robust validation measures is non-negotiable for translating computational predictions into credible scientific insights or regulatory submissions.
Core Validation Metrics: Quantitative Frameworks
Robust validation requires the calculation of specific, interpretable metrics. The following tables summarize the key quantitative measures for internal and external validation.
Table 1: Core Internal Validation Metrics & Thresholds
| Metric | Formula / Method | Ideal Threshold | Purpose & Interpretation |
|---|---|---|---|
| Q² (LOO or LMO) | ( Q^2 = 1 - \frac{\sum (y{obs} - y{pred})^2}{\sum (y{obs} - \bar{y}{train})^2} ) | > 0.5 | Cross-validated coefficient of determination. Measures model robustness and protection against overfitting. |
| RMSECV | ( \sqrt{\frac{\sum{i=1}^{n} (y{i} - \hat{y}_{i(i)})^2}{n}} ) | Low, context-dependent | Cross-validated Root Mean Square Error. Quantifies average prediction error in model units. |
| Y-Randomization | Correlation coefficient (R² or Q²) after scrambling response variable. | Significant drop in performance (e.g., R² < 0.3) | Confirms model is not based on chance correlation. Typically repeated >50 times. |
| Applicability Domain (AD) - Leverage | ( hi = \mathbf{x}i^T (\mathbf{X}^T\mathbf{X})^{-1} \mathbf{x}_i ) | ( h_i \leq h^* = \frac{3p}{n} ) | Identifies if a prediction is an interpolation (within AD) or an extrapolation (outside AD). |
Table 2: Core External Validation Metrics & Thresholds
| Metric | Formula / Method | OECD-Suggested Threshold | Purpose & Interpretation |
|---|---|---|---|
| R²ext | ( R^2{ext} = 1 - \frac{\sum (y{obs,ext} - y{pred,ext})^2}{\sum (y{obs,ext} - \bar{y}_{train})^2} ) | > 0.6 | Explanatory power for the external set. Uses training set mean. |
| Q²F1, Q²F2, Q²F3 | Variants based on denominator using external/test set variance or training set variance. | > 0.6 | Predictive squared correlation coefficients. Q²F3 is often preferred. |
| RMSEext | ( \sqrt{\frac{\sum (y{obs,ext} - y{pred,ext})^2}{n_{ext}}} ) | Comparable to RMSECV | Average prediction error for the external set. |
| CCC (Concordance Correlation Coefficient) | ( \rhoc = \frac{2s{xy}}{sx^2 + sy^2 + (\bar{x} - \bar{y})^2} ) | > 0.85 | Measures agreement between observed and predicted values (precision & accuracy). |
| MAEext | ( \frac{\sum |y{obs,ext} - y{pred,ext}|}{n_{ext}} ) | Low, context-dependent | Mean Absolute Error. Robust to outliers. |
Experimental Protocols for Validation
Protocol for Internal Validation via k-Fold Cross-Validation
Objective: To estimate model robustness and predictive ability within the training data.
- Dataset Preparation: Standardize descriptors and scale the response variable if necessary. Let n = total number of training compounds.
- Data Splitting: Randomly partition the dataset into k subsets (folds) of approximately equal size. Common k values are 5 or 10.
- Iterative Training/Validation:
- For i = 1 to k:
- Hold out fold i as the temporary validation set.
- Train the QSAR model using the remaining k-1 folds.
- Use the trained model to predict the activities of compounds in fold i.
- Record the predicted values.
- For i = 1 to k:
- Metric Calculation: After all iterations, all training compounds have a cross-validated prediction. Calculate Q², RMSECV, etc., using these predictions.
Protocol for External Validation with a True Test Set
Objective: To evaluate the model's predictive power on unseen, independent data.
- Initial Data Division: Before any model development, randomly divide the full dataset into a Training Set (~70-80%) and a Hold-Out Test Set (~20-30%). Ensure both sets span the chemical and activity space (stratified sampling).
- Model Development: Develop the final QSAR model using only the Training Set. This includes descriptor selection, algorithm optimization, and internal validation (as per Protocol 3.1).
- Final Model Locking: Fix all model parameters (coefficients, selected descriptors, scaling factors).
- External Prediction: Apply the locked model to the descriptors of the Hold-Out Test Set to generate predictions.
- Metric Calculation: Calculate R²ext, Q²F1-F3, RMSEext, CCC, and MAEext by comparing these predictions to the experimental values of the Test Set.
Protocol for Y-Randomization Testing
Objective: To verify the model is not the result of chance correlation.
- Baseline Model: Build the QSAR model with the original training data and response variable (Y). Record its R² and Q².
- Randomization Iteration: Repeat the following 50-100 times:
- Randomly permute (shuffle) the values of the response vector (Y) relative to the descriptor matrix (X).
- Build a new model using the same descriptor set and modeling technique with the scrambled Y.
- Record the R² and Q² of this randomized model.
- Statistical Analysis: Plot the distribution of randomized model performance metrics. Calculate the mean and standard deviation. The original model's performance should be a significant outlier (e.g., p < 0.05 from a t-test) compared to the distribution of randomized model performances.
Visualizing the Validation Workflow & Relationships
Workflow Diagram: Principle 4 Validation Process
Decision Logic for QSAR Model Acceptance
The Scientist's Toolkit: Essential Research Reagents & Solutions
Table 3: Key Tools & Resources for QSAR Validation
| Item / Solution | Function in Validation | Example / Specification |
|---|---|---|
| Chemical Descriptor Software | Generates numerical representations of molecular structures for model building. | DRAGON, PaDEL-Descriptor, RDKit, MOE. |
| Modeling & Validation Suite | Platform for algorithm training, internal CV, and metric calculation. | scikit-learn (Python), R (caret, pls), SIMCA, KNIME. |
| External Validation Dataset | A curated, chemically diverse set of compounds with high-quality experimental data, held out from training. | Public sources: ChEMBL, PubChem BioAssay. Must be truly external. |
| Applicability Domain Tool | Software or script to calculate leverage, distance-based metrics, or PCA-based boundaries. | AMBIT (Toxtree), in-house scripts using PCA & Hotelling's T². |
| Y-Randomization Script | Custom script to automate response permutation and model recalibration. | Python (NumPy, scikit-learn), R with for-loop. Minimum 50 iterations. |
| Statistical Analysis Package | For advanced metric calculation (CCC, confidence intervals) and graphical analysis. | R (DescTools), GraphPad Prism, Python (SciPy, statsmodels). |
| Standardized Reporting Template | Checklist or document to ensure all OECD validation principles are reported transparently. | Based on OECD QSAR Toolbox reporting formats or journal-specific guidelines. |
The Organisation for Economic Co-operation and Development (OECD) Principles for the Validation of (Quantitative) Structure-Activity Relationships [(Q)SARs] provide a foundational framework for regulatory acceptance of computational models in chemical safety assessment and drug development. Principle 5, "A (Q)SAR should be associated with a mechanistic interpretation," is not merely a supplementary guideline but a critical determinant of a model's scientific validity, reliability, and domain of applicability. This principle elevates a model from a statistical correlation to a scientifically defensible tool. Mechanistic interpretation provides the biological or physicochemical rationale linking molecular structure to the predicted activity or property, thereby offering transparency, enhancing trust, and allowing for the extrapolation beyond the training set with greater confidence.
Defining Mechanistic Interpretation in (Q)SAR
Mechanistic interpretation refers to the elucidation of the biological, chemical, or physical processes that explain why a specific molecular structure leads to a particular endpoint. It moves beyond the "black box" by connecting molecular descriptors (e.g., logP, HOMO/LUMO energies, polar surface area, presence of toxicophores) to biologically relevant events.
Core Components:
- Biological Pathway Alignment: The descriptor profile of a compound should be logically linked to known molecular initiating events (MIEs) and key events (KEs) in an Adverse Outcome Pathway (AOP) or therapeutic mode-of-action pathway.
- Physicochemical Rationale: For properties like absorption or solubility, descriptors must relate to established physical chemistry principles (e.g., lipophilicity and membrane permeability).
- Domain of Applicability Definition: A mechanistic basis allows for the clear definition of the chemical space where the model is reliable, as compounds sharing the mechanism are likely to be predicted accurately.
Methodologies for Establishing Mechanistic Interpretation
Establishing mechanistic interpretation is a multi-faceted process integrating computational, in chemico, and in vitro data.
Descriptor Analysis and Profiling
- Protocol: Perform statistical correlation (e.g., PLS, decision tree analysis) between all model descriptors and the endpoint. Identify the most influential descriptors. For each top descriptor, conduct a literature review to establish its known mechanistic role in the endpoint (e.g., electrophilicity descriptors for skin sensitization, relating to the MIE of covalent binding to skin proteins).
- Data Requirement: The model's descriptor importance list and comprehensive scientific literature.
Read-Across within the Applicability Domain
- Protocol: For a new query compound, identify its nearest neighbors in the training set using distance metrics (e.g., Euclidean, Mahalanobis). Manually curate and compare the mechanistic profiles (toxicophores, metabolic soft spots, etc.) of the query and its neighbors. Prediction confidence is high only if mechanistic similarity underpins the structural similarity.
- Data Requirement: A well-annotated training set with known mechanisms or toxicophores.
Experimental Validation of the Hypothesized Mechanism
- Protocol: Select representative compounds from different prediction categories (e.g., high-activity, low-activity). Employ targeted in vitro assays designed to probe the specific Key Event predicted by the model. For example, for an endocrine disruption model based on estrogen receptor (ER) binding, confirm predictions using a standardized ER transactivation assay (e.g., OECD TG 455).
- Data Requirement: Compounds, relevant cell lines or biochemical kits, and assay protocols.
Table 1: Summary of Key Methodological Approaches for Mechanistic Interpretation
| Methodology | Primary Objective | Key Output | Typical Quantitative Metrics |
|---|---|---|---|
| Descriptor Analysis | Link model variables to biological/chemical theory | Mechanistic hypothesis for descriptor-endpoint relationship | Descriptor importance weight (from PLS, Random Forest); Correlation coefficient (R²) with endpoint. |
| Read-Across Analysis | Ensure predictions are based on mechanistic similarity, not just statistical proximity | Justification for inclusion within the Applicability Domain | Similarity distance (Tanimoto index, Euclidean distance); Mechanistic alert concordance. |
| In Vitro Assay Validation | Confirm the biological activity predicted by the model | Experimental evidence supporting the mechanistic basis | IC50/EC50 values; Assay-specific positive/negative call rates vs. model prediction. |
| Adverse Outcome Pathway (AOP) Mapping | Frame model predictions within a regulatory-relevant biological narrative | AOP network diagram showing where the model predicts MIEs or KEs | Weight of Evidence (WoE) score for AOP alignment. |
Visualization of Workflow and Pathways
The Scientist's Toolkit: Key Research Reagent Solutions
Table 2: Essential Materials for Mechanistic QSAR Investigation
| Reagent / Material | Provider Examples | Primary Function in Mechanistic Studies |
|---|---|---|
| Direct Peptide Reactivity Assay (DPRA) Kit | Thermo Fisher, Eurofins | In chemico test to quantify covalent binding to peptides, directly probing the Molecular Initiating Event for skin sensitization AOP. |
| AREc32 Cell Line | ATCC, commercial labs | Reporter gene cell line (Luciferase) under control of Antioxidant Response Element. Used to confirm activation of the Keap1-Nrf2 pathway, a key event for many toxicities. |
| Stable Transfected ERα, AR CALUX Assays | PerkinElmer, BioDetection Systems | Cell-based bioassays for specific nuclear receptor activation (Estrogen/Androgen Receptor), validating endocrine disruption mechanisms. |
| Metabolite Generation Systems (e.g., S9, Hepatocytes) | Corning, BioIVT | Used to incubate with test compounds to generate bioactive metabolites, exploring mechanisms involving bioactivation. |
| CYP450 Inhibition Assay Kits (Fluorogenic) | Promega, Thermo Fisher | High-throughput screening to determine if a compound's toxicity or DD mechanism involves inhibition of specific cytochrome P450 enzymes. |
| Reactive Oxygen Species (ROS) Detection Probes (DCFH-DA, DHE) | Abcam, Cayman Chemical | Flow cytometry or fluorescence microscopy probes to validate oxidative stress as a putative mechanism predicted by descriptors related to redox potential. |
| Pan-Assay Interference Compounds (PAINS) Filters | Various computational libraries | Computational toolkits to identify compounds with substructures known to cause assay interference, ensuring mechanistic signals are genuine. |
The integration of computational workflows into modern drug discovery and chemical safety assessment represents a paradigm shift, fundamentally guided by the Organisation for Economic Co-operation and Development (OECD) principles for the validation of Quantitative Structure-Activity Relationship (QSAR) models. These principles—(1) a defined endpoint, (2) an unambiguous algorithm, (3) a defined domain of applicability, (4) appropriate measures of goodness-of-fit, robustness, and predictivity, and (5) a mechanistic interpretation, where possible—provide the essential framework for transforming standalone in silico tools into reliable components of a decision-support system. This technical guide details the methodology for building a validated, integrated workflow that transitions from predictive computation to actionable insight, ensuring regulatory and scientific rigor.
Core Integrated Workflow Architecture
The end-to-end workflow integrates data curation, model application, validation, and interpretation into a cohesive decision-support pipeline.
Diagram Title: Integrated QSAR Workflow with OECD Principles
Detailed Methodologies and Experimental Protocols
Protocol: Chemical Standardization and Descriptor Calculation
Objective: To generate reproducible, high-quality chemical structure data for modeling.
- Input: Chemical structures in SMILES, SDF, or MOL file format.
- Standardization (Knime/PaDEL/RDKit):
- Salts and solvents are removed using a predefined fragmentation protocol.
- Structures are neutralized (if required by the model).
- Tautomers are enumerated and canonicalized to a standard form.
- 3D geometries are generated (e.g., using CORINA or RDKit's ETKDG) and minimized with the MMFF94 force field.
- Descriptor Calculation:
- A predefined set of 2D and 3D molecular descriptors (e.g., topological, electronic, geometrical) is calculated using software such as PaDEL-Descriptor, RDKit, or Dragon.
- Descriptors with zero variance or high pairwise correlation (|r| > 0.95) are removed to reduce dimensionality.
- Output: A standardized dataset in CSV or .arff format.
Protocol: QSAR Model Application and Domain of Applicability (DA) Assessment
Objective: To generate a reliable prediction with a defined confidence metric.
- Model Loading: A pre-validated QSAR model (e.g., a partial least squares (PLS) or random forest model) is loaded. The algorithm and endpoint are documented per OECD Principle 1 & 2.
- Descriptor Scaling: Input descriptor values are scaled identically to the training set (e.g., mean-centering and unit variance).
- Prediction: The scaled descriptors are passed to the model to generate a numerical or categorical prediction (e.g., pLC50, mutagenicity class).
- Applicability Domain Assessment:
- Method (Leverage/Williams Plot): Calculate the leverage (h) for the new chemical using the training set descriptor matrix (X): h = xᵀ(XᵀX)⁻¹x.
- The critical leverage h* is defined as 3p'/n, where p' is the number of model variables + 1, and n is the number of training compounds.
- Decision Rule: If h > h*, the chemical is structurally extrapolated and the prediction is flagged as unreliable.
- Standardized Residuals: Predictions with a standardized residual > 3 standard deviation units are flagged for high prediction error.
Protocol: Internal Validation (Y-Randomization)
Objective: To confirm the model's robustness and lack of chance correlation.
- The original response variable (Y) of the training set is randomly shuffled.
- A new model is built using the original descriptor matrix (X) and the scrambled Y-values.
- This process is repeated 100-200 times.
- The performance metrics (e.g., Q², R²) of the scrambled models are recorded.
- Success Criterion: The performance of the original model must be significantly better (e.g., p < 0.05) than the distribution of performances from the scrambled models.
Data Presentation: Model Performance Metrics
Table 1: Summary of Key Validation Metrics for QSAR Models Aligned with OECD Principle 4
| Metric | Formula | Interpretation | Threshold for Acceptance |
|---|---|---|---|
| R² (Coefficient of Determination) | R² = 1 - (SSres/SStot) | Goodness-of-fit for training data. Proportion of variance explained. | > 0.6 (context-dependent) |
| Q² (LOO-CV) | Q² = 1 - (Σ(yᵢ - ŷᵢ)² / Σ(yᵢ - ȳ)²) | Internal predictivity using Leave-One-Out Cross-Validation. | > 0.5 (typically) |
| RMSE (Root Mean Square Error) | RMSE = √[Σ(yᵢ - ŷᵢ)²/n] | Average magnitude of prediction error. | As low as possible, relative to data range. |
| MAE (Mean Absolute Error) | MAE = Σ|yᵢ - ŷᵢ|/n | Robust measure of average error magnitude. | As low as possible. |
| Sensitivity (for Classification) | TP / (TP + FN) | Ability to identify true positives. | > 0.7 (context-dependent) |
| Specificity (for Classification) | TN / (TN + FP) | Ability to identify true negatives. | > 0.7 (context-dependent) |
| Concordance (Accuracy) | (TP + TN) / Total | Overall correct classification rate. | > 0.75 (context-dependent) |
Mechanistic Interpretation and Pathway Mapping
To satisfy OECD Principle 5, predictions are linked to potential biological mechanisms. For an endocrine disruption endpoint, a simplified Adverse Outcome Pathway (AOP) can be visualized.
Diagram Title: Integrating QSAR into an Adverse Outcome Pathway (AOP)
The Scientist's Toolkit: Research Reagent Solutions
Table 2: Essential Software and Database Tools for QSAR Workflow Integration
| Item/Software | Primary Function | Relevance to Workflow |
|---|---|---|
| KNIME Analytics Platform | Open-source data integration, processing, and visualization. | Core workflow orchestration, linking descriptor calculation, model nodes, and result visualization. |
| RDKit | Open-source cheminformatics toolkit. | Chemical standardization, descriptor calculation, and substructure analysis for mechanistic interpretation. |
| PaDEL-Descriptor | Software for calculating molecular descriptors and fingerprints. | Rapid generation of >1,800 chemical descriptors for model building/application. |
| OECD QSAR Toolbox | Software to identify analogs, fill data gaps, and assess chemical categories. | Critical for defining the applicability domain and read-across justification within the workflow. |
| VEGA (Virtual models for property Evaluation of chemicals within a Global Architecture) | Platform hosting multiple validated QSAR models. | Provides ready-to-use, pre-validated models for endpoints like mutagenicity and toxicity. |
| CompTox Chemistry Dashboard (EPA) | Publicly accessible database of chemical properties, toxicity data, and in vitro bioactivity. | Source of high-quality experimental data for validation and context. |
| ChEMBL / PubChem | Large-scale bioactivity databases. | Sources of training data and experimental benchmarks for model building and validation. |
Decision Support System Output
The final integrated workflow compiles all evidence into a decision report structured as follows:
- Chemical Identifier & Structure
- Prediction & Confidence: Numerical result with confidence interval or class probability.
- Applicability Domain Status: Flag (In/Out) with justification (e.g., leverage value).
- Validation Summary: Reference to model performance metrics (from Table 1).
- Mechanistic Plausibility: Summary of potential AOP linkages (from Diagram 2).
- Data Gap Filling Recommendation: Suggests next steps (e.g., targeted in vitro assay).
- Overall Reliability Assessment: A qualitative classification (e.g., High, Medium, Low) based on the integrated weight of evidence from the preceding steps, directly supporting a "Go/No-Go" or "Test Next" decision in development pipelines.
Common QSAR Validation Pitfalls and How to Optimize Your Models
Within the framework of the OECD principles for Quantitative Structure-Activity Relationship (QSAR) validation, ensuring data quality is paramount. These principles mandate that a QSAR model be associated with: 1) a defined endpoint, 2) an unambiguous algorithm, 3) a defined domain of applicability, 4) appropriate measures of goodness-of-fit, robustness, and predictivity, and 5) a mechanistic interpretation, if possible. The foundation of any reliable model is the underlying data. This guide details the core data quality challenges—gaps, bias, and experimental error—that threaten the integrity of predictive toxicology and chemistry models, directly impacting the validity of QSARs under the OECD framework.
Quantitative Data on Common Data Quality Issues
The following table summarizes the frequency and impact of major data quality issues in public chemical biology databases, as reported in recent literature.
Table 1: Prevalence and Impact of Data Quality Issues in Public Repositories
| Data Quality Issue | Typical Prevalence in Public Repositories | Primary Impact on QSAR Model Performance (R²/Q² reduction) | Common Source |
|---|---|---|---|
| Missing Data (Gaps) | 10-30% of entries for key descriptors | Up to 0.2 points in R² | Incomplete measurements, proprietary data withholding, legacy data entry. |
| Systematic Measurement Bias | Affects 5-15% of assay datasets | 0.15-0.3 points in external validation Q² | Inter-laboratory protocol variance, instrument calibration drift, cell line genetic drift. |
| Random Experimental Error | Present in >95% of experimental data | 0.05-0.1 points in R² | Plate-to-plate variability, pipetting inaccuracy, environmental fluctuations. |
| Structural & Annotation Errors | 2-8% of chemical structures | High impact; model applicability domain corruption | Automated name-to-structure conversion, stereochemistry misassignment. |
| Class Imbalance (Bias) | Varies widely; active:inactive ratios of 1:1000 common in toxicity | Inflated specificity, severely reduced sensitivity | Focus on testing novel actives, under-reporting of negative results. |
Methodologies for Identification and Mitigation
Protocol for Identifying Data Gaps & Imputation Suitability
Objective: Systematically assess missing data patterns and determine appropriate imputation or curation strategies. Workflow:
- Data Profiling: Calculate the percentage of missing values per variable (descriptor) and per compound.
- Pattern Analysis: Use Little's MCAR test to determine if data is Missing Completely At Random (MCAR), Missing At Random (MAR), or Missing Not At Random (MNAR).
- Domain Assessment: For each compound with missing data, evaluate its position relative to the model's preliminary Applicability Domain (AD) using leverage (hat index) and distance-based methods.
- Decision Logic: Impute data only for compounds within the AD where the missing pattern is MCAR or MAR. For MNAR or compounds outside the AD, exclude or flag for experimental follow-up.
- Imputation Validation: Apply multiple imputation (e.g., multivariate imputation by chained equations) and assess the variance introduced across imputed datasets.
Protocol for Detecting and Correcting Systematic Bias
Objective: Identify and adjust for non-random, systematic shifts in experimental data. Workflow:
- Control Reference Analysis: Plot the results of internal controls (e.g., reference compounds, vehicle controls) across different experimental batches, dates, or laboratories using control charts.
- Statistical Process Control: Establish upper and lower control limits (UCL, LCL) at ±3 standard deviations from the mean control response.
- Bias Quantification: For batches where controls fall outside control limits, quantify the mean shift (Δ) and variance inflation.
- Correction Application: Apply a batch correction model (e.g., Combat, mean-centering, or ratio-based normalization) using the control data as anchors. Note: Correction is only valid if the bias is confirmed to be technical, not biological.
- Post-Correction Verification: Re-plot controls to ensure alignment and confirm that biological variance between test groups is preserved.
Diagram Title: Systematic Bias Detection and Correction Workflow (82 chars)
Protocol for Quantifying and Incorporating Experimental Error
Objective: Model random experimental error to inform uncertainty estimates in QSAR predictions. Workflow:
- Replicate Analysis: For assays with replicate measurements, calculate the standard deviation (σ) and standard error of the mean (SEM) for each compound.
- Error Distribution Modeling: Fit the replicate errors to a distribution (e.g., normal, log-normal). Establish a global error model if homoscedasticity holds.
- Error Weighting: In the QSAR regression, implement weighted least squares, where the weight (wi) for each observation is inversely proportional to its variance: wi = 1 / (σi² + σglobal²).
- Uncertainty Propagation: Use error-in-variables models (e.g., Deming regression) if descriptor uncertainty is also significant.
- Predictive Interval Estimation: Generate prediction intervals for new compounds that incorporate both model uncertainty and the estimated experimental error.
Diagram Title: Error Propagation from Data to QSAR Prediction (64 chars)
The Scientist's Toolkit: Research Reagent Solutions
Table 2: Essential Tools for Managing Data Quality
| Tool/Reagent | Function in Addressing Data Quality |
|---|---|
| Certified Reference Materials (CRMs) | Provides an unbiased, traceable standard for calibrating instruments and assays, directly combating measurement bias. |
| Stable, Low-Passage Cell Banks | Minimizes genetic drift and phenotypic variance in cell-based assays, reducing systematic biological bias over time. |
| Internal Standard Compounds (e.g., Stable Isotope Labeled) | Spiked into samples to correct for sample preparation losses and instrument response variability, mitigating random error. |
| Positive/Negative Control Plates | Included in every high-throughput screening batch to statistically monitor for systematic drift and outlier batches. |
| Standardized Solvents & Media | Ensures consistency in compound solubility and cell health, reducing a major source of unexplained variance (noise). |
| Automated Liquid Handlers with Calibration Kits | Reduces pipetting error, a primary source of random experimental error, especially in high-throughput settings. |
| QSAR Software with Applicability Domain & Uncertainty Modules | Enforces OECD principles by automatically flagging predictions for compounds with missing descriptors or high error estimates. |
Adherence to the OECD QSAR validation principles necessitates a rigorous, proactive approach to data quality management. Gaps, bias, and experimental error are not merely nuisances; they are fundamental threats to a model's defined domain, goodness-of-fit, and predictivity. By implementing the systematic protocols outlined here—profiling missing data, statistically controlling for bias, and propagating experimental error—researchers can construct QSAR models on a foundation of reliable data. This ensures that predictions for chemical safety and efficacy are not only statistically sound but also chemically and biologically meaningful, fulfilling the core mandate of the OECD framework for regulatory-ready science.
Navigating the Challenges of Defining a Precise Applicability Domain
The Organisation for Economic Co-operation and Development (OECD) principles for the validation of (Quantitative) Structure-Activity Relationship models provide a seminal framework for regulatory acceptance of in silico predictions. Among the five principles, Principle 3—"a defined domain of applicability"—is uniquely challenging. It mandates that a QSAR model must only be used for making predictions for compounds within its applicability domain (AD). This article, framed within the broader thesis of OECD QSAR validation, provides an in-depth technical guide on the core challenges and methodologies for defining a precise AD—a critical determinant of predictive reliability in computational toxicology and drug development.
Core Methodologies for Defining the Applicability Domain
Defining the AD requires a multi-faceted approach. The following table summarizes the primary methodological categories, their quantitative descriptors, and key strengths and limitations.
Table 1: Core Methodologies for Applicability Domain Definition
| Method Category | Key Descriptors/Measures | Typical Threshold(s) | Main Advantage | Primary Limitation |
|---|---|---|---|---|
| Range-Based | Min/Max of each descriptor in training set. | Descriptor value within [min, max]. | Simple, intuitive, fast to compute. | Assumes uniform distribution; susceptible to outliers. |
| Distance-Based | Mean distance (( \bar{d} )) of k-nearest neighbors in training set; Standardized distance. | ( d{new} \leq \bar{d} + Z \cdot \sigmad ) (e.g., Z=3). | Accounts for data distribution density. | Choice of distance metric and threshold (Z) is critical and often arbitrary. |
| Leverage-Based | Leverage (( h_i )) from the model's Hat matrix. | ( h_i \leq h^* = 3p'/n ), where p'=descriptors, n=samples. | Integrated with model structure; identifies extrapolation in descriptor space. | Limited to linear models; requires model-specific matrix. |
| Probability Density | Multivariate probability density estimation (e.g., Parzen-Rosenblatt). | Probability density ≥ defined cutoff (e.g., 0.01). | Holistic, model-independent view of chemical space coverage. | Computationally intensive; sensitive to kernel bandwidth selection. |
| Consensus | Boolean or weighted combination of multiple methods above. | Defined by rule (e.g., "in-AD" if 3 out of 4 methods agree). | Robust, reduces false positives/negatives from single methods. | Complex to implement and interpret; requires validation. |
Detailed Experimental Protocols for AD Assessment
Protocol for k-Nearest Neighbor (kNN) Distance-Based AD Determination
This is a widely used, robust protocol for defining a distance-based AD.
Objective: To determine if a query compound is within the AD based on its average similarity to its k most similar training compounds.
Materials:
- Training set chemical structures (standardized SMILES).
- Query compound structure(s).
- Molecular descriptor calculation software (e.g., RDKit, PaDEL).
- Statistical computing environment (e.g., R, Python with SciKit-learn).
Procedure:
- Standardization: Apply consistent structure standardization (neutralization, salt stripping, tautomer normalization) to all training and query molecules.
- Descriptor Calculation: Compute a relevant, informative set of molecular descriptors (e.g., ECFP6 fingerprints, DRAGON descriptors) for the entire training set.
- Descriptor Preprocessing: Scale the descriptors (e.g., range scaling or autoscaling) using parameters derived solely from the training set. Apply the same transformation to query compounds.
- Define Parameters: Select the number of neighbors (k, typically 3-5) and a distance metric (e.g., Euclidean, Manhattan, or Tanimoto for fingerprints).
- Calculate Reference Distances: For each training compound i, calculate the mean distance (( di )) to its *k* nearest neighbors within the training set. Compute the overall mean (( \bar{d} )) and standard deviation (( \sigmad )) of these ( d_i ) values.
- Threshold Setting: Define the AD threshold as ( \bar{d} + Z \cdot \sigma_d ), where Z is a user-defined parameter (commonly 0.5, 1, or 2). A stricter Z yields a narrower AD.
- Query Assessment: For a query compound, calculate its mean distance (( dq )) to its *k* nearest neighbors in the training set. If ( dq \leq ) threshold, the query is inside the AD.
Validation: The process should be validated via external test sets or cross-validation to ensure the chosen k and Z yield an AD that reliably encloses compounds with low prediction error.
Protocol for Leverage-Based AD in a PLS Model
This protocol is specific to linear models like Partial Least Squares (PLS) regression.
Objective: To identify query compounds that are influential outliers in the model's descriptor (X) space, indicating extrapolation.
Materials:
- Training set of chemicals with measured response (Y) and calculated descriptors (X).
- Validated PLS regression model.
- Matrix computation library.
Procedure:
- Model Building: Develop a PLS model using the training data: ( Y = X \cdot B + E ), where B contains the regression coefficients.
- Calculate the Hat Matrix: For the PLS model with A latent variables, the Hat matrix is defined as ( H = T(T'T)^{-1}T' ), where T is the score matrix for the training set. The leverage of the i-th training compound is the i-th diagonal element of H, denoted ( h_{ii} ).
- Determine Critical Leverage: The warning leverage ( h^* ) is typically calculated as ( h^* = 3 \cdot (A+1) / n ), where n is the number of training compounds.
- Training Set Diagnostics: Plot the standardized model residuals vs. leverage (Williams plot). Training compounds with ( h_{ii} > h^* ) are structurally influential.
- Query Assessment: Project the query compound into the model's latent space to obtain its score vector ( tq ). Calculate its leverage as ( hq = tq (T'T)^{-1} tq' ). If ( h_q > h^* ), the query is outside the AD in the descriptor space.
Visualizing the AD Definition Workflow and Decision Logic
Title: Decision Workflow for Assessing a Compound's Applicability Domain
The Scientist's Toolkit: Research Reagent Solutions for AD Studies
Table 2: Essential Tools and Materials for AD Method Development and Assessment
| Tool/Reagent Category | Specific Example(s) | Function in AD Studies |
|---|---|---|
| Chemical Standardization | RDKit (Cheminformatics library), OpenBabel, Standardizer (from ChemAxon) | Ensures consistent molecular representation (e.g., neutralizing charges, removing salts) before descriptor calculation, a critical pre-processing step. |
| Descriptor Calculation | PaDEL-Descriptor, RDKit, Dragon (from Talete), Mordred | Generates numerical representations (fingerprints, physicochemical properties) of chemical structures that form the basis for similarity/distance metrics. |
| Modeling & AD Algorithms | Scikit-learn (Python), Caret (R), AMBIT (Taverna workflows), KNIME nodes | Provides implemented algorithms for model building (e.g., PLS, Random Forest) and AD calculation (kNN, PCA-based ranges). |
| Curated Chemical Datasets | Tox21, PubChem BioAssay, ChEMBL, QSAR DataBank (QSARDB) | Provides high-quality, publicly available training and external validation sets with associated bioactivity/toxicity data for method benchmarking. |
| Visualization & Reporting | ggplot2 (R), Matplotlib/Seaborn (Python), Spotfire, Williams/Influence Plots | Creates diagnostic plots (e.g., PCA score plots with AD boundaries, leverage plots) to communicate AD decisions and model coverage. |
Avoiding Overfitting and Ensuring True Predictive Performance
Quantitative Structure-Activity Relationship (QSAR) models are pivotal in modern drug discovery and regulatory science. The Organisation for Economic Co-operation and Development (OECD) established principles for the validation of QSAR models to ensure their reliability for regulatory decision-making. These principles mandate that a model must be associated with: 1) a defined endpoint, 2) an unambiguous algorithm, 3) a defined domain of applicability, 4) appropriate measures of goodness-of-fit, robustness, and predictivity, and 5) a mechanistic interpretation, if possible. This guide delves into the technical strategies to avoid overfitting—a primary threat to model robustness and predictivity—thereby ensuring true predictive performance in alignment with OECD principles.
The Peril of Overfitting: Definitions and Consequences
Overfitting occurs when a model learns not only the underlying signal in the training data but also the noise and random fluctuations. This results in a model with excellent performance on training data but poor generalization to new, unseen data (the test set). In the context of OECD Principle 4, an overfit model fails to provide "appropriate measures of...predictivity," rendering it unreliable for its intended purpose.
Key Indicators of Overfitting:
- A significant gap between cross-validated and training set performance metrics.
- Excessively complex models with a large number of descriptors relative to the number of observations.
- Unrealistically high accuracy on the training set that cannot be replicated on an external test set.
Methodologies to Mitigate Overfitting and Validate Predictivity
Adherence to a rigorous model development and validation workflow is non-negotiable. The following protocols provide a defense against overfitting.
Core Experimental Protocol: The Model Development & Validation Workflow
Objective: To build a QSAR model with validated true predictive performance. Materials: A curated dataset of chemical structures and associated biological activity (e.g., pIC50). Procedure:
- Data Curation & Splitting: Clean the dataset. Before any modeling, split the data into a Training Set (~70-80%) and a completely held-out External Test Set (~20-30%). The test set is not used until the final model evaluation.
- Descriptor Calculation & Reduction: Calculate molecular descriptors/features. Apply feature selection (e.g., Variance Threshold, correlation filtering) on the training set only to reduce dimensionality.
- Model Training with Internal Validation: On the training set, use resampling techniques:
- k-Fold Cross-Validation (k=5 or 10): The training set is split into k folds; the model is trained on k-1 folds and validated on the held-out fold. This is repeated k times.
- Y-Scrambling (for OECD Principle 5): Randomly shuffle the response variable (activity) and attempt to rebuild the model. A truly predictive model should fail under these conditions.
- Hyperparameter Tuning: Use grid/random search within the cross-validation loop on the training set to optimize model parameters without leaking test data.
- Final Model Training: Train the final model with the optimal hyperparameters on the entire training set.
- External Validation: Apply the final model to the External Test Set, which it has never seen. Calculate predictive performance metrics.
- Domain of Applicability (OECD Principle 3): Calculate the applicability domain (e.g., using leverage, distance-based methods) to identify compounds for which predictions are reliable.
Diagram 1: QSAR Model Validation Workflow (Max Width: 760px)
Key Validation Metrics (Quantitative Data)
Performance must be quantified using multiple metrics. The following table summarizes core metrics for regression and classification QSAR models.
Table 1: Key Metrics for QSAR Model Validation
| Metric | Formula / Description | Ideal Value | Purpose (OECD Principle 4) |
|---|---|---|---|
| Regression Metrics | |||
| R² (Training/Test) | Coefficient of Determination | Close to 1, Test ≈ Training | Goodness-of-fit & predictivity |
| Q² (LOO-CV or k-Fold) | Predictive R² from cross-validation | Q² > 0.5, Close to R² | Internal robustness & predictivity |
| RMSE (Root Mean Square Error) | √[Σ(Ŷᵢ - Yᵢ)²/n] | As low as possible | Average prediction error |
| MAE (Mean Absolute Error) | Σ|Ŷᵢ - Yᵢ|/n | As low as possible | Interpretable average error |
| Classification Metrics | |||
| Accuracy | (TP+TN)/(TP+TN+FP+FN) | Close to 1 | Overall correctness |
| Sensitivity/Recall | TP/(TP+FN) | Close to 1 | Ability to find positives |
| Specificity | TN/(TN+FP) | Close to 1 | Ability to find negatives |
| AUC-ROC | Area Under ROC Curve | Close to 1 | Overall ranking performance |
Abbreviations: LOO-CV: Leave-One-Out Cross-Validation; TP: True Positive; TN: True Negative; FP: False Positive; FN: False Negative.
The Scientist's Toolkit: Essential Research Reagents & Solutions
Table 2: Key Tools and Solutions for Robust QSAR Modeling
| Item | Function & Relevance to Avoiding Overfitting |
|---|---|
| Chemical Datasets (e.g., ChEMBL) | High-quality, publicly available sources of bioactivity data for training and external test sets. Essential for unbiased validation. |
| Descriptor Calculation Software (RDKit, PaDEL) | Open-source tools to generate molecular fingerprints and descriptors. Enables reproducible feature engineering. |
| Feature Selection Libraries (scikit-learn) | Provides algorithms (e.g., Recursive Feature Elimination, Variance Inflation Factor) to reduce descriptor space and complexity, mitigating overfitting. |
| Machine Learning Frameworks (scikit-learn, XGBoost) | Offer built-in implementations of cross-validation, hyperparameter tuning grids, and ensemble methods (which reduce overfitting). |
| Y-Scrambling Script | A custom script to randomize activity data, used to test for chance correlation, supporting OECD Principle 5 validation. |
| Applicability Domain Calculator | Software or script to compute leverage, Euclidean distance, or other measures to define the model's reliable prediction domain (OECD Principle 3). |
Advanced Techniques: Regularization and Ensemble Methods
Regularization (e.g., Lasso (L1), Ridge (L2) regression) adds a penalty term to the model's loss function based on the magnitude of coefficients. This discourages complex models, forcing the algorithm to prioritize only the most important descriptors.
Ensemble Methods (e.g., Random Forest, Gradient Boosting) combine predictions from multiple base models (e.g., decision trees). By averaging or voting, they reduce the variance associated with any single model's overfitting to noise.
Diagram 2: Ensemble Method Reduces Overfitting (Max Width: 760px)
True predictive performance in QSAR modeling is not an artifact of excellent training statistics but the result of deliberate, principled strategies to combat overfitting. By rigorously implementing data splitting, internal cross-validation, external testing, and techniques like regularization and ensemble learning, researchers directly satisfy the core tenets of the OECD validation principles. This ensures models are not only statistically sound but also reliable and trustworthy for guiding scientific and regulatory decisions in drug development.
The development and validation of Quantitative Structure-Activity Relationship (QSAR) models are governed by the OECD principles, a cornerstone for regulatory acceptance in chemical safety and drug development. The fifth principle—"a mechanistic interpretation, if possible"—is particularly challenging with modern 'black box' machine learning models (e.g., deep neural networks, complex ensemble methods). This whitepaper provides a technical guide for researchers to extract mechanistic insight from high-performance, yet opaque, models, thereby aligning advanced predictive analytics with the OECD's demand for interpretability and scientific rigor.
Core Strategies for Mechanistic Insight
Post-hoc Interpretability Techniques
These methods analyze a trained model to infer feature importance and decision logic.
- Local Interpretable Model-agnostic Explanations (LIME): Approximates the model locally around a specific prediction with an interpretable surrogate model (e.g., linear regression).
- SHapley Additive exPlanations (SHAP): Roots in cooperative game theory to assign each feature an importance value for a particular prediction, ensuring consistency.
- Partial Dependence Plots (PDPs) & Accumulated Local Effects (ALE): Visualize the marginal effect of one or two features on the model's predicted outcome.
Proximal and Perturbation Experiments
- In Silico Knockouts/Activation: Systematically ablate or fix features or hidden nodes to assess their causal contribution to predictions.
- Adversarial Testing: Applying minimal, meaningful perturbations to input data to probe model sensitivity and identify critical features or potential biases.
Mechanistically-Guided Model Design
- Pathway-/Structure-Informed Architecture: Embedding known biological pathways (e.g., kinase hierarchies) or chemical rules (e.g., functional group interactions) as constraints or layers within a neural network.
- Disentangled Representations: Training models to encode data into separate, semantically meaningful latent variables (e.g., one for molecular weight, another for polarity).
Quantitative Comparison of Interpretation Methods
Table 1: Comparison of Key Model Interpretation Strategies
| Method | Scope (Global/Local) | Model Agnostic? | Provides Causal Insight? | Computational Cost | Key Output |
|---|---|---|---|---|---|
| Permutation Feature Importance | Global | Yes | No | Low | Global feature ranking. |
| SHAP (KernelExplainer) | Local & Global | Yes | No | High | Feature attribution per prediction; can be aggregated. |
| LIME | Local | Yes | No | Medium | Local linear surrogate model coefficients. |
| PDPs | Global | Yes | No | Medium-High | 1D or 2D plot of marginal feature effect. |
| ALE Plots | Global | Yes | No | Medium-High | 1D or 2D plot, robust to correlated features. |
| Attention Weights | Local & Global | No | No | Low | Weight distribution over inputs (e.g., sequence tokens). |
| In Silico Mutagenesis | Local | Yes | Proximal | Medium | Prediction change upon feature perturbation. |
| Causal Discovery Algorithms | Global | Yes | Yes | Very High | Causal graph of features and target. |
Detailed Experimental Protocols
Protocol: SHAP Analysis for a Compound Activity Predictor
Objective: To determine atomic contributions for a deep neural network predicting pIC50. Materials: Trained DNN model, test set of molecular structures (SMILES format), RDKit (v2023.x), SHAP library (v0.44).
- Preprocessing: Standardize all test set molecules using RDKit (sanitize, generate 2D coordinates).
- Background Dataset: Randomly sample 100 molecules from the training set to represent "typical" chemical space.
- Explainer Initialization: Instantiate a
shap.DeepExplainermodel, passing the trained DNN and the background dataset. - SHAP Value Calculation: For each molecule in the test set, compute SHAP values using the explainer. This yields a matrix of contributions for each atom (feature) per prediction.
- Visualization & Analysis: Use
shap.summary_plotto aggregate global importance. For local insights, useshap.force_plotor map atom contributions onto the 2D molecular structure (color-coded).
Protocol: In Silico Pathway Perturbation for a Phenotypic Predictor
Objective: To assess if a CNN model predicting cell viability uses known apoptosis pathway features. Materials: Model inputs (high-content cell image features), known protein targets in apoptosis (e.g., from KEGG PATHWAY: hsa04210).
- Feature Mapping: Manually or via NLP, map a subset of input image features (e.g., nuclear intensity, membrane blebbing) to apoptosis-relevant biological nodes (e.g., "Caspase-3 activity").
- Controlled Perturbation: Create modified input vectors. For the "apoptosis feature group," systematically set values to represent inhibition (low values) and activation (high values), while holding other features at their dataset median.
- Model Query & Analysis: Run the perturbed inputs through the model. Record the predicted viability score.
- Causal Inference: Plot predicted viability against the perturbation level of the apoptosis feature group. A strong negative correlation suggests the model has learned to associate the apoptosis image signature with reduced viability, providing mechanistic plausibility.
Visualizing Interpretation Workflows and Logic
Title: Decision Flow for Selecting Model Interpretation Strategies
Title: Mapping Model Features to a Biological Pathway Hypothesis
The Scientist's Toolkit: Research Reagent Solutions
Table 2: Essential Tools for Mechanistic Interpretation Experiments
| Item / Solution | Function in Interpretation Research | Example / Note |
|---|---|---|
| SHAP Library | Calculates consistent feature attributions for any model. | Use TreeExplainer for tree ensembles, DeepExplainer for DNNs. |
| LIME Package | Creates local, interpretable surrogate models. | Essential for explaining single predictions on text or image data. |
| RDKit | Open-source cheminformatics toolkit. | Used to featurize molecules, calculate descriptors, and visualize SHAP maps. |
| Captum | Model interpretability library for PyTorch. | Provides integrated gradient, layer conductance, and neuron attribution methods. |
| Causal Discovery Toolkits (e.g., causalml, dowhy) | Algorithms to infer causal graphs from observational data. | Tests if model features have plausible causal links to the outcome. |
| Pathway Databases (KEGG, Reactome, GO) | Source of known biological mechanisms. | Provides ground truth for hypothesis generation and validation. |
| Mol2vec / ChemBERTa | Pre-trained molecular representations. | Used as input features or to regularize models toward chemically-meaningful latent spaces. |
| Synthetic Data Generators | Creates data with known ground-truth mechanisms. | Crucial for validating interpretation methods under controlled conditions. |
Best Practices for Documentation and Reporting to Ensure Transparency
In computational toxicology and drug development, Quantitative Structure-Activity Relationship (QSAR) models are pivotal for predicting biological activity and toxicity. The Organisation for Economic Co-operation and Development (OECD) established five validation principles to ensure the regulatory acceptance of QSARs. These principles mandate that a model must have: 1) a defined endpoint, 2) an unambiguous algorithm, 3) a defined domain of applicability, 4) appropriate measures of goodness-of-fit, robustness, and predictivity, and 5) a mechanistic interpretation, if possible. This whitepaper details the documentation and reporting practices required to uphold these principles, thereby ensuring scientific transparency, reproducibility, and regulatory confidence.
Foundational Documentation: The QSAR Model Dossier
A comprehensive model dossier is the cornerstone of transparent reporting. It should be a standalone document that allows for independent verification.
Table 1: Core Components of a QSAR Model Dossier
| Dossier Section | OECD Principle Addressed | Required Content |
|---|---|---|
| 1. Scientific & Administrative Data | Principle 1 | Unique model identifier, submitter details, submission date, and a clear, unambiguous definition of the modeled endpoint (e.g., EC50 for mutagenicity in Ames test). |
| 2. Algorithm & Software | Principle 2 | Exact mathematical formula, software name/version, source code (or executable), and all software dependencies/settings. |
| 3. Chemical Data | Principle 1, 3 | List of all chemicals (with unambiguous identifiers like SMILES/CAS) in training and test sets. Experimental data values, source, and measurement protocols. |
| 4. Descriptors | Principle 2, 3 | List of all calculated descriptors, their mathematical definition, software used for calculation, and any preprocessing (e.g., scaling, normalization). |
| 5. Model Development | Principle 4 | Detailed workflow of model building, variable selection method, final model parameters (e.g., regression coefficients), and internal validation results (e.g., cross-validation R², Q²). |
| 6. Domain of Applicability | Principle 3 | Definition of the applicability domain (AD) method (e.e.g., leverage, PCA, similarity distance). AD thresholds and justification. List of chemicals flagged as outside the AD. |
| 7. Validation & Predictivity | Principle 4, 5 | External test set composition, full set of performance metrics (see Table 2), and an assessment of prediction accuracy within and outside the AD. |
| 8. Mechanistic Interpretation | Principle 5 | Discussion of how critical descriptors relate to the biological endpoint, supported by literature or mechanistic reasoning. |
Quantitative Reporting of Model Performance
Performance metrics must be reported comprehensively for both internal and external validation. The following table standardizes required metrics.
Table 2: Mandatory Performance Metrics for Classification and Regression QSAR Models
| Metric Category | Metric Name | Formula / Definition | Reporting Context |
|---|---|---|---|
| Classification (e.g., Active/Inactive) | Sensitivity (Recall) | TP / (TP + FN) | Training, Cross-Validation, External Test |
| Specificity | TN / (TN + FP) | Training, Cross-Validation, External Test | |
| Balanced Accuracy | (Sensitivity + Specificity) / 2 | Training, Cross-Validation, External Test | |
| Matthews Correlation Coeff. (MCC) | (TP×TN - FP×FN) / √((TP+FP)(TP+FN)(TN+FP)(TN+FN)) | Crucial for imbalanced sets. | |
| Regression (e.g., pIC50) | Coefficient of Determination (R²) | 1 - (SSres / SStot) | Training Set Only |
| Cross-validated R² (Q²) | 1 - (PRESS / SS_tot) | Internal Validation (Required) | |
| Root Mean Square Error (RMSE) | √( Σ(Predi - Obsi)² / N ) | Training, CV, and External Test | |
| Mean Absolute Error (MAE) | Σ |Predi - Obsi| / N | Training, CV, and External Test |
Experimental Protocols for Key Validation Experiments
To support OECD Principle 4, the experimental generation of validation data must be meticulously documented.
Protocol 1: External Validation Set Curation
- Objective: To create an independent test set for unbiased assessment of model predictivity.
- Methodology:
- Prior to model development, the full available dataset is split into a training/calibration set (~70-80%) and a hold-out test set (~20-30%).
- Splitting must be performed using a stratified method (e.g., Kennard-Stone, sphere exclusion, or time-split) to ensure the test set is representative of the chemical and response space of the training set.
- The test set is sealed (not used in any aspect of model training or descriptor selection) until the final model is fixed.
Protocol 2: Y-Randomization (Robustness Check)
- Objective: To confirm the model is not the result of chance correlation.
- Methodology:
- The response values (Y) of the training set are randomly shuffled.
- A new model is built using the same descriptor set and algorithm as the original model, but using the shuffled responses.
- This process is repeated at least 50 times.
- The performance metrics (e.g., R², Q²) of the randomized models are compared to the original. The original model's metrics should be significantly superior.
Visualizing the QSAR Validation Workflow
A standardized workflow ensures all OECD principles are addressed sequentially.
Title: QSAR Model Development & Validation Workflow
The Scientist's Toolkit: Essential Research Reagent Solutions
Table 3: Key Reagents and Tools for QSAR-Supportive Experimental Toxicology
| Tool/Reagent | Provider/Example | Function in Context |
|---|---|---|
| Bacterial Reverse Mutation Assay Kit (Ames Test) | Moltox, Xenometrix | Provides standardized Salmonella typhimurium strains (e.g., TA98, TA100) and cofactors for high-throughput in vitro mutagenicity testing, generating data for OECD Principle 1 endpoint definition. |
| In Vitro Micronucleus Assay Kit | Thermo Fisher (CellSensor), Litron Laboratories | Streamlines the assessment of chromosomal damage in mammalian cells (e.g., TK6 cells) using flow cytometry, a key endpoint for genotoxicity QSAR models. |
| Metabolic Activation System (S9 Fraction) | Corning Life Sciences, Molecular Toxicology | Provides standardized liver homogenate for in vitro assays to simulate mammalian metabolic activation of pro-mutagens/carcinogens, critical for biologically relevant data. |
| CYP450 Inhibition Assay Kit | Promega (P450-Glo), BD Biosciences | Enables high-throughput screening of chemical inhibition against major cytochrome P450 isoforms, generating data for pharmacokinetic and toxicity QSARs. |
| Standardized OECD QSAR Toolbox | OECD (Free Software) | Integrates data, trend analysis, and profiling tools to fill data gaps, identify analogs, and support mechanistic interpretation (OECD Principle 5). |
| Chemical Registry & Database Services | EPA CompTox Chemicals Dashboard, PubChem | Provides authoritative sources for chemical structures, identifiers, and linked experimental properties/toxicity data for model training and testing. |
OECD Validation in Practice: Regulatory Acceptance and Comparative Frameworks
This whitepaper examines the application of the Organisation for Economic Co-operation and Development (OECD) principles for the validation of (Quantitative) Structure-Activity Relationship ((Q)SAR) models within three pivotal regulatory frameworks: the European Union's Registration, Evaluation, Authorisation and Restriction of Chemicals (REACH), the International Council for Harmonisation of Technical Requirements for Pharmaceuticals for Human Use (ICH), and the United States Food and Drug Administration (FDA). Framed within a broader thesis on OECD QSAR validation, the discussion provides a technical guide for researchers and drug development professionals on integrating these internationally recognized principles into regulatory science.
The OECD Principles for QSAR Validation: A Foundation
The OECD principles, established in 2004, provide a scientific benchmark for developing and evaluating QSAR models intended for regulatory use. They are designed to ensure transparency, robustness, and predictive capacity. The five principles are:
- A defined endpoint
- An unambiguous algorithm
- A defined domain of applicability
- Appropriate measures of goodness-of-fit, robustness, and predictivity
- A mechanistic interpretation, if possible
Regulatory Contexts and Application
REACH (European Chemicals Agency - ECHA)
REACH explicitly encourages the use of QSARs and non-testing methods to avoid animal testing, provided they meet the OECD principles. ECHA provides extensive guidance on the documentation required for QSAR-based assessments.
Key Quantitative Data on QSAR Use in REACH Dossiers (2018-2022):
Table 1: QSAR Utilization in REACH Registrations (Summarized Data)
| Metric | 2018 | 2020 | 2022 | Source/Notes |
|---|---|---|---|---|
| Dossiers using (Q)SAR | ~35% | ~40% | ~45% | ECHA Report, 2023 |
| Primary endpoint predicted | Acute toxicity (LD50) | Skin sensitization | Repeated dose toxicity | Trend shift observed |
| Average completeness score | 2.8 / 5 | 3.2 / 5 | 3.5 / 5 | Based on ECHA's 5-point scale for QSAR reporting |
Experimental Protocol for QSAR Submission under REACH:
- Endpoint Definition: Precisely specify the regulatory endpoint (e.g., EC50 for aquatic toxicity).
- Model Selection & Documentation: Choose a model with a defined Applicability Domain (AD). Document the algorithm, training set, and software version.
- Prediction & AD Check: Input the chemical structure. The software must report if the substance falls within the model's AD.
- Results Assessment: Evaluate prediction against the model's performance metrics (e.g., sensitivity, specificity).
- Reporting in IUCLID: Under Section 7.1 (Information on Guidance / Other), select "QSAR" and complete the specific fields (Endpoint, Algorithm, Reliability, etc.) as per the QSAR Reporting Format (QRF).
ICH (M7 Guideline on Genotoxic Impurities)
ICH M7(R2) formally endorses the use of (Q)SAR predictions for assessing the mutagenic potential of impurities. It mandates the use of two complementary (Q)SAR methodologies: one expert rule-based and one statistical-based.
Methodology for ICH M7 Compliant (Q)SAR Assessment:
- Dual Model Application: Perform predictions using two different QSAR systems. Common pairings include:
- Expert System: Derek Nexus (Lhasa Limited)
- Statistical System: Sarah Nexus (Lhasa Limited) or CASE Ultra (MultiCASE).
- Consensus Analysis: Compare predictions.
- Both Negative: Concludes a "negative" call; no further testing for mutagenicity is recommended.
- One Positive, One Negative: Triggers a "Review".
- Expert Review: A scientist reviews the chemical structure, alerts from the expert system, and the underlying reasoning. The review may conclude the prediction is negative based on scientific rationale, otherwise, it is treated as positive.
- Action: For a positive or unresolved review prediction, the impurity must be controlled below the Threshold of Toxicological Concern (TTC) or a compound-specific acceptable limit.
FDA (CDER Perspectives)
The FDA's Center for Drug Evaluation and Research (CDER) applies a flexible, fit-for-purpose approach to QSAR, guided by the OECD principles. Its use spans impurity assessment (aligned with ICH M7), safety evaluation of extractables and leachables, and early drug candidate screening.
FDA's Review Protocol for QSAR Submissions:
- Model Characterization: Reviewers assess the scientific validity of the model, focusing on its Applicability Domain relative to the query compound.
- Transparency Scrutiny: The algorithm and predictive features must be sufficiently transparent to allow scientific judgment.
- Context of Use: The prediction is evaluated within the broader context of the application (e.g., impurity level, patient population, route of administration).
- Integration with Evidence: QSAR predictions are weighed alongside other data (e.g., chemical analogs, in vitro data) in a weight-of-evidence approach.
Comparative Analysis
Table 2: Regulatory Perspectives on OECD QSAR Principles
| OECD Principle | REACH/ECHA Perspective | ICH M7 Perspective | FDA/CDER Perspective |
|---|---|---|---|
| Defined Endpoint | Must align with REACH Annexes. | Specifically mutagenicity (bacterial reverse mutation assay). | Flexible, based on context (e.g., toxicity, pharmacokinetics). |
| Unambiguous Algorithm | Must be documented; proprietary accepted if documented. | Requires two distinct algorithms (expert + statistical). | Prefers transparency; proprietary models evaluated on a case-by-case basis. |
| Domain of Applicability | Critical. Predictions outside the AD are not accepted. | Implicitly covered by the dual system approach and expert review. | Paramount. Predictions for chemicals outside the AD are given little weight. |
| Measures of Predictivity | Requires reported performance metrics (e.g., concordance). | Relies on the documented performance of the two complementary systems. | Assessed during review; model validation data is requested. |
| Mechanistic Interpretation | Encouraged but not always mandatory. | Central to the expert rule-based system and the review step. | Highly valued as part of the weight-of-evidence. |
Visualization of Regulatory QSAR Workflows
Title: ICH M7 (Q)SAR Assessment Decision Tree
Title: OECD Principles Guide Key Regulatory Frameworks
The Scientist's Toolkit: Key Research Reagent Solutions
Table 3: Essential Tools for Regulatory QSAR Analysis
| Item/Category | Example Products/Tools | Function in Regulatory QSAR |
|---|---|---|
| Commercial QSAR Software | Derek Nexus, Sarah Nexus, CASE Ultra, VEGA, OECD QSAR Toolbox. | Provide pre-validated models, defined applicability domains, and standardized reporting formats essential for regulatory submissions. |
| Chemical Structure Drawing & Standardization | ChemDraw, OpenBabel, RDKit. | Ensures accurate, canonical representation of the query molecule, which is critical for reproducible predictions. |
| Applicability Domain Assessment Tool | AMBIT Discovery, In-house scripts using PCA/distance metrics. | Quantifies whether a query compound falls within the chemical space of the model's training set, a core OECD principle. |
| Database of Experimental Data | EPA CompTox Chemicals Dashboard, ECHA CHEM, PubChem. | Used for read-across justification, model training, and validating predictions as part of a weight-of-evidence approach. |
| Reporting Template | ECHA QSAR Reporting Format (QRF), ICH M7 Assessment Summary. | Standardizes the documentation of QSAR predictions to ensure all OECD principles are addressed for reviewer scrutiny. |
Comparing the OECD Framework to Alternative Validation Approaches
Within the broader thesis on OECD principles for Quantitative Structure-Activity Relationship (QSAR) validation, understanding the landscape of validation approaches is critical. This technical guide provides an in-depth comparison of the internationally recognized OECD framework against alternative methodologies, highlighting their application in regulatory and research contexts for drug development and chemical safety assessment.
The OECD framework, established to ensure the regulatory acceptance of (Q)SAR models, is built upon five core principles. These principles provide a structured, top-down approach to validation, emphasizing transparency and regulatory utility.
OECD Principles for QSAR Validation:
- A defined endpoint: Clear specification of the biological, chemical, or toxicological effect being predicted.
- An unambiguous algorithm: A transparent and fully described mathematical procedure.
- A defined domain of applicability: Explicit statement of the chemical structures and properties for which the model is valid.
- Appropriate measures of goodness-of-fit, robustness, and predictivity: Quantitative performance statistics.
- A mechanistic interpretation, if possible: Linking model predictions to biological or chemical theory.
Experimental Protocol for OECD-Compliant Validation:
- Step 1 – Endpoint Curation: Assemble a high-quality dataset from reliable sources (e.g., ECHA databases, published literature). Apply strict criteria for data inclusion, documenting all transformations and uncertainties.
- Step 2 – Algorithm Documentation: Detail every step of model development, including descriptor calculation software, feature selection method, and the final algorithm (e.g., partial least squares regression, random forest code). All software and scripts must be archived.
- Step 3 – Domain Definition: Calculate the model's applicability domain using standardized methods (e.g., leverage, distance-based approaches, ranges of descriptors). Implement an objective metric to flag predictions for chemicals outside this domain.
- Step 4 – Performance Assessment:
- Internal Validation: Use resampling techniques (e.g., 5-fold cross-validation repeated 10 times) to calculate metrics like Q², RMSE, and accuracy.
- External Validation: Predict a completely independent test set (≥20% of original data, held out from the start) to calculate metrics such as the concordance correlation coefficient, sensitivity, and specificity.
- Step 5 – Mechanistic Rationalization: Employ techniques like descriptor importance ranking (from random forest or PLS) or molecular docking studies to provide a plausible biological or physicochemical basis for the model's predictions.
Alternative Validation Approaches
Alternative frameworks often emphasize different aspects of model evaluation, such as probabilistic interpretation, extensive benchmarking, or pragmatic regulatory workflows.
3.1. The “Setubal Principles” (Tropsha's Group) This approach emphasizes rigorous statistical validation and predictive power, often considered more stringent for research use.
- Core Tenet: A model is only valid if it demonstrates predictive power via external validation.
- Key Protocol: Mandates that the correlation coefficient (R²) for the external test set is >0.6, the slope of the regression line through the origin is between 0.85 and 1.15, and performance metrics for the test set are close to those of the training set.
3.2. Bayesian Probabilistic Validation This framework focuses on quantifying prediction uncertainty, providing a probability distribution for each estimate.
- Core Tenet: Validation is about quantifying uncertainty, not just a point estimate.
- Key Protocol: Models are built using Bayesian algorithms (e.g., Gaussian Processes, Bayesian Neural Networks). Validation involves assessing the calibration of prediction intervals—do 95% credible intervals contain the true value ~95% of the time in an external test set?
3.3. Agile/Continuous Validation (Common in Industrial Deployment) Used for high-throughput screening models in early drug discovery, this approach prioritizes speed and iterative improvement.
- Core Tenet: Models are continuously validated against new, real-time experimental data.
- Key Protocol: A model is deployed after basic internal checks. Its predictions for new chemical series are tracked in a live dashboard and compared to new experimental results weekly/monthly. Performance decay triggers automatic model retraining.
Quantitative Comparison of Frameworks
Table 1: Comparison of Core Validation Framework Characteristics
| Aspect | OECD Framework | Setubal Principles | Bayesian Probabilistic | Agile/Continuous |
|---|---|---|---|---|
| Primary Goal | Regulatory acceptance | Statistical rigor & predictivity | Uncertainty quantification | Operational efficiency & speed |
| Key Metric | Defined domain, Transparency | R²test >0.6, slopes ~1 | Calibrated credible intervals | Cycle time, hit-rate improvement |
| Regulatory Focus | High (REACH, ICH) | Low-Medium (Research) | Medium (Emerging) | Low (Internal use) |
| Uncertainty Handling | Qualitative (Domain) | Not explicit | Explicit & quantitative | Implicit (via iteration) |
| Resource Intensity | High | High | Very High | Medium-Low |
| Best Suited For | Hazard identification, Regulatory submission | Academic research, Model development | Safety-critical decisions, Risk assessment | Lead optimization, Virtual screening |
Table 2: Typical Performance Metrics Required Across Frameworks (Illustrative Data)
| Validation Metric | OECD Typical Threshold | Setubal Minimum Threshold | Bayesian Target | Agile Benchmark |
|---|---|---|---|---|
| Internal Q² / R²cv | > 0.6 | > 0.6 | Not Primary | > 0.5 |
| External R² / Accuracy | Reported (No fixed threshold) | R² > 0.6 | Coverage of 95% CI ≈ 0.95 | Improves historical baseline |
| Sensitivity (Binary) | Reported with domain | > 0.7 | Reported with CI | Maintains or improves |
| Specificity (Binary) | Reported with domain | > 0.7 | Reported with CI | Maintains or improves |
| Domain Coverage | Must be defined | Not required | Inherent in uncertainty | Not formally defined |
The Scientist's Toolkit: Research Reagent Solutions
Table 3: Essential Materials and Tools for QSAR Validation Studies
| Item / Solution | Function in Validation | Example Product/Software |
|---|---|---|
| Curated Toxicity Datasets | Provides the gold-standard experimental data for model training and external testing. | EPA CompTox Dashboard, ECHA database, Lhasa Vitic Nexus. |
| Chemical Descriptor Calculation Software | Generates numerical representations of molecules for model building. | Dragon, PaDEL-Descriptor, RDKit (open-source). |
| QSAR Modeling Software | Platform for algorithm development, internal validation, and domain calculation. | SIMCA (PLS), KNIME, R (caret, randomForest packages), Python (scikit-learn). |
| Applicability Domain Tool | Calculates whether a new chemical falls within the model's reliable prediction space. | AMBIT (TOXTREE), Standalone DModX scripts, In-house developed distance metrics. |
| External Test Set | A blinded, representative set of chemicals held back from training to assess true predictivity. | Defined subset (≥20%) of curated dataset, or new, proprietary experimental data. |
| Statistical Analysis Package | Calculates goodness-of-fit, robustness, and predictivity metrics. | R, Python (SciPy, statsmodels), JMP, GraphPad Prism. |
| Mechanistic Reasoning Tools | Aids in providing a mechanistic interpretation (OECD Principle 5). | Molecular docking software (AutoDock Vina), Pathway analysis tools (IPA), Read-across platforms. |
Visualizing the Validation Workflows
Title: OECD QSAR Validation Principle Workflow
Title: Core Tenets of Alternative Validation Approaches
The Organisation for Economic Co-operation and Development (OECD) principles for QSAR validation provide the definitive international standard for developing reliable and regulatory-acceptable models. This case study details a successful QSAR submission for predicting drug-induced liver injury (DILI), a critical preclinical toxicity endpoint, explicitly framed within these principles. The five OECD principles are: 1) a defined endpoint, 2) an unambiguous algorithm, 3) a defined domain of applicability, 4) appropriate measures of goodness-of-fit, robustness, and predictivity, and 5) a mechanistic interpretation, where possible. This whitepaper outlines a project that rigorously adhered to these principles, leading to a model accepted in a regulatory context.
Model Development: Adherence to OECD Principles
Principle 1: Defined Endpoint The endpoint was binary classification of compounds as "DILI-positive" or "DILI-negative," based on a consolidated reference dataset from multiple sources, including the FDA's Liver Toxicity Knowledge Base (LTKB) and published literature.
Principle 2: Unambiguous Algorithm A Random Forest (RF) algorithm was selected. The model hyperparameters were explicitly defined.
Table 1: Final Random Forest Model Hyperparameters
| Hyperparameter | Value | Explanation |
|---|---|---|
Number of Trees (n_estimators) |
500 | Ensures stable predictions. |
Max Tree Depth (max_depth) |
15 | Prevents overfitting. |
Min Samples Split (min_samples_split) |
5 | Controls node splitting. |
| Criterion | Gini Impurity | Used for measuring split quality. |
Principle 3: Defined Domain of Applicability (AD) The AD was defined using the leverage approach (Williams plot) and structural fingerprint similarity (Tanimoto coefficient > 0.7 to the training set).
Principle 4: Validation & Statistical Measures The dataset was split into training (70%) and external test (30%) sets. Model performance was rigorously assessed.
Table 2: Model Performance Metrics on External Test Set
| Metric | Value | OECD Principle Link |
|---|---|---|
| Accuracy | 0.82 | Principle 4 (Predictivity) |
| Sensitivity (Recall) | 0.78 | Principle 4 (Predictivity) |
| Specificity | 0.85 | Principle 4 (Predictivity) |
| Balanced Accuracy | 0.815 | Principle 4 (Predictivity) |
| AUC-ROC | 0.88 | Principle 4 (Goodness-of-fit) |
Principle 5: Mechanistic Interpretation Descriptors were linked to known DILI mechanisms: logP (lipophilicity, relating to mitochondrial dysfunction), presence of reactive functional groups (e.g., anilines), and Topological Polar Surface Area (TPSA, related to bile salt export pump inhibition).
Detailed Experimental Protocol for QSAR Modeling
Step 1: Data Curation & Preparation
- Compiled 850 unique compounds with confirmed human DILI outcomes from public databases.
- Standardized structures: removed salts, neutralized charges, generated canonical tautomers using RDKit.
- Calculated 200 molecular descriptors (RDKit and Mordred packages) and 2048-bit Morgan fingerprints (radius=2).
Step 2: Feature Selection
- Removed low-variance descriptors (variance threshold < 0.01).
- Applied recursive feature elimination (RFE) with a support vector machine (SVM) to reduce dimensionality to 35 key descriptors.
Step 3: Model Training & Internal Validation
- Split data into training/internal test (70/30) using stratified sampling.
- Trained RF model on training set using parameters in Table 1.
- Performed 10-fold cross-validation on the training set to assess robustness.
- Evaluated on the held-out internal test set.
Step 4: External Validation & AD Definition
- Applied model to a completely separate external test set (n=180).
- Calculated leverage (h) for each external compound:
h = xᵢᵀ (XᵀX)⁻¹ xᵢ, wherexᵢis the descriptor vector of compoundiandXis the training set matrix. - Defined AD: compounds with
h ≤ 3(p+1)/n(where p=descriptors, n=training samples) and Tanimoto similarity > 0.7 were considered within AD.
Step 5: Submission Dossier Assembly Documented all steps, datasets, algorithms, validation results, and mechanistic rationale per OECD guidance.
Visualizing the QSAR Development & Validation Workflow
QSAR Development Workflow
OECD Principles to Case Study Activities
The Scientist's Toolkit: Essential Research Reagent Solutions
Table 3: Key Software, Libraries, and Resources
| Tool/Reagent | Provider/Example | Function in QSAR Workflow |
|---|---|---|
| Chemical Database | FDA LTKB, ChEMBL | Sources for curated compounds with associated toxicity endpoints. |
| Cheminformatics Library | RDKit, Mordred | Open-source libraries for structure standardization, descriptor calculation, and fingerprint generation. |
| Machine Learning Framework | scikit-learn (Python) | Provides algorithms (Random Forest, SVM), feature selection methods, and model validation tools. |
| Descriptor Calculation Tool | PaDEL-Descriptor, Dragon | Software for calculating comprehensive sets of molecular descriptors. |
| Applicability Domain Tool | AMBIT, in-house scripts | Software for calculating leverage, similarity, and defining the model's domain. |
| Statistical Analysis Software | R, Python (SciPy, pandas) | For in-depth statistical analysis and visualization of results. |
| QSAR Reporting Tool | QMRF (QSAR Model Reporting Format) | Standardized template for documenting models in line with OECD principles. |
Within the context of regulatory science and Quantitative Structure-Activity Relationship (QSAR) model validation, the OECD Principles for the Validation of QSAR Models have served as the international bedrock for ensuring the reliability of predictions for regulatory use. These principles—a defined endpoint, an unambiguous algorithm, a defined domain of applicability, appropriate measures of goodness-of-fit, robustness, and reliability, and a mechanistic interpretation, if possible—were established in an era of traditional statistical modeling. This whitepaper explores the technical integration of these immutable principles with modern, complex artificial intelligence and machine learning (AI/ML) techniques, providing a framework for researchers and drug development professionals to build trustworthy, next-generation predictive models.
The OECD Principles: A Modern Interpretation for AI/ML
The core challenge lies in mapping the conceptual requirements of the OECD principles onto the opaque, high-dimensional workflows of deep learning and ensemble methods. The table below provides a direct translation.
Table 1: Mapping OECD Principles to AI/ML Implementation
| OECD Principle | Traditional QSAR Interpretation | Modern AI/ML Technical Implementation |
|---|---|---|
| 1. Defined Endpoint | Clear experimental result (e.g., LD50, logP). | Digital endpoint specification: Standardized data schema (e.g., SDF, SMILES), exact protocol ID, units, and uncertainty quantification. |
| 2. Unambiguous Algorithm | Published regression equation or rule set. | Fully versioned, containerized code (Docker/Singularity), with fixed random seeds, published hyperparameters, and public repository (e.g., GitHub) for model architecture. |
| 3. Defined Applicability Domain | Ranges of molecular descriptors in training set. | Multidimensional space defined by: Latent space distance (autoencoders), leverage/hat matrix, prediction uncertainty (e.g., Monte Carlo Dropout, ensemble variance), and structural fingerprints. |
| 4. Goodness-of-Fit & Robustness | R², Q², RMSE, cross-validation. | Extended metrics: Parity plots, calibration curves (for probabilistic output), stringent nested cross-validation, and external validation set performance. |
| 5. Mechanistic Interpretation | Contribution of logP, polar surface area, etc. | Post-hoc explainability: SHAP (SHapley Additive exPlanations), LIME, Integrated Gradients, or attention mechanism visualization from transformers. |
Experimental Protocols for Validated AI/ML-QSAR Models
The following detailed methodology ensures compliance with OECD principles within an AI/ML workflow.
Protocol 1: Curating a Defined Endpoint for Deep Learning
- Source Data from reliable repositories (e.g., ChEMBL, PubChem, regulated study reports).
- Harmonize Endpoints using standardized ontologies (e.g., BioAssay Ontology). Convert all values to consistent units (e.g., nM for IC50).
- Apply Uncertainty Thresholds: Discard data points where experimental uncertainty (e.g., standard deviation reported in triplicate) exceeds ±0.5 log units.
- Stratified Splitting: Partition the cleaned dataset into Training (70%), Validation (15%), and Hold-out Test (15%) sets, ensuring chemical and endpoint value distribution is consistent across splits to avoid bias.
Protocol 2: Establishing the Applicability Domain for a Graph Neural Network
- Train a Variational Graph Autoencoder (VGAE) on the training set molecules to learn a continuous latent molecular representation.
- Calculate Latent Distance: For a new query molecule, encode it and compute the Mahalanobis distance to the centroid of the training set's latent distribution.
- Calculate Structural Similarity: Compute the maximum Tanimoto similarity (using ECFP4 fingerprints) between the query and the training set.
- Define Composite AD Metric: A molecule is inside the AD if:
Mahalanobis Distance < Critical χ² value (95th percentile)ANDMax Tanimoto Similarity > 0.3.
Protocol 3: Quantifying Predictive Uncertainty Using Ensemble Methods
- Train an Ensemble of 100 independently initialized neural networks (differing random seeds) on the same training data.
- Generate Predictions: For each query molecule, collect predictions from all 100 models.
- Calculate Metrics: The mean prediction is the final point estimate. The predictive uncertainty is quantified as the standard deviation of the 100 predictions.
- Calibrate Uncertainty: Ensure that the calculated standard deviation is correlated with prediction error on the validation set. High uncertainty should correlate with high error.
Visualizing the Integrated Workflow
The following diagram, generated using Graphviz DOT language, illustrates the logical workflow for developing an OECD-compliant AI/ML-QSAR model.
Title: Workflow for OECD-Compliant AI/ML-QSAR Model Development
The Scientist's Toolkit: Essential Research Reagent Solutions
Table 2: Key Tools & Libraries for OECD-Aligned AI/ML-QSAR
| Item Name | Type | Function / Purpose |
|---|---|---|
| RDKit | Open-Source Cheminformatics Library | Fundamental for parsing molecules (SMILES/SDF), generating 2D/3D descriptors, fingerprint calculation, and basic molecular operations. |
| DeepChem | Open-Source ML Library | Provides high-level APIs for building deep learning models on chemical data (Graph Neural Networks, Transformers), with built-in dataset splitters and metrics. |
| SHAP / Captum | Explainable AI Library | Quantifies the contribution of each input feature (atom, bond, descriptor) to a model's prediction, addressing the "mechanistic interpretation" principle. |
| Mol2Vec / ChemBERTa | Pre-trained Molecular Representation | Provides transfer learning embeddings, offering a robust starting point for models, especially with limited data. |
| Docker / Singularity | Containerization Platform | Ensures the "unambiguous algorithm" principle by packaging the exact software environment, OS, and code for full reproducibility. |
| Weights & Biases / MLflow | Experiment Tracking Platform | Logs all hyperparameters, code versions, metrics, and model artifacts, creating an auditable trail for the model development process. |
| Uncertainty Toolbox | Python Library | Implements standard metrics (calibration error, sharpness) for evaluating the quality of uncertainty estimates from ML models. |
The integration of OECD principles with modern AI/ML is not a constraint but a rigorous engineering framework that elevates model trustworthiness. By adhering to the protocols and leveraging the toolkit outlined above, researchers can develop complex, high-performing predictive models that simultaneously meet the stringent validation criteria required for scientific and regulatory acceptance. This synergy ensures that the pace of algorithmic innovation is matched by a commensurate commitment to reliability, transparency, and ultimately, safer and more effective drug development.
Conclusion
The OECD principles for QSAR validation provide an indispensable, internationally recognized framework that transforms computational models from research tools into credible assets for decision-making. By adhering to the principles of a defined endpoint, an unambiguous algorithm, a stated applicability domain, appropriate validation, and a mechanistic interpretation, researchers can build models that are not only scientifically robust but also primed for regulatory consideration. As drug discovery embraces more complex AI-driven approaches, these principles remain the bedrock for ensuring transparency, reliability, and ethical application. Future progress lies in adapting this rigorous framework to next-generation models, thereby accelerating safer and more efficient therapeutic development.