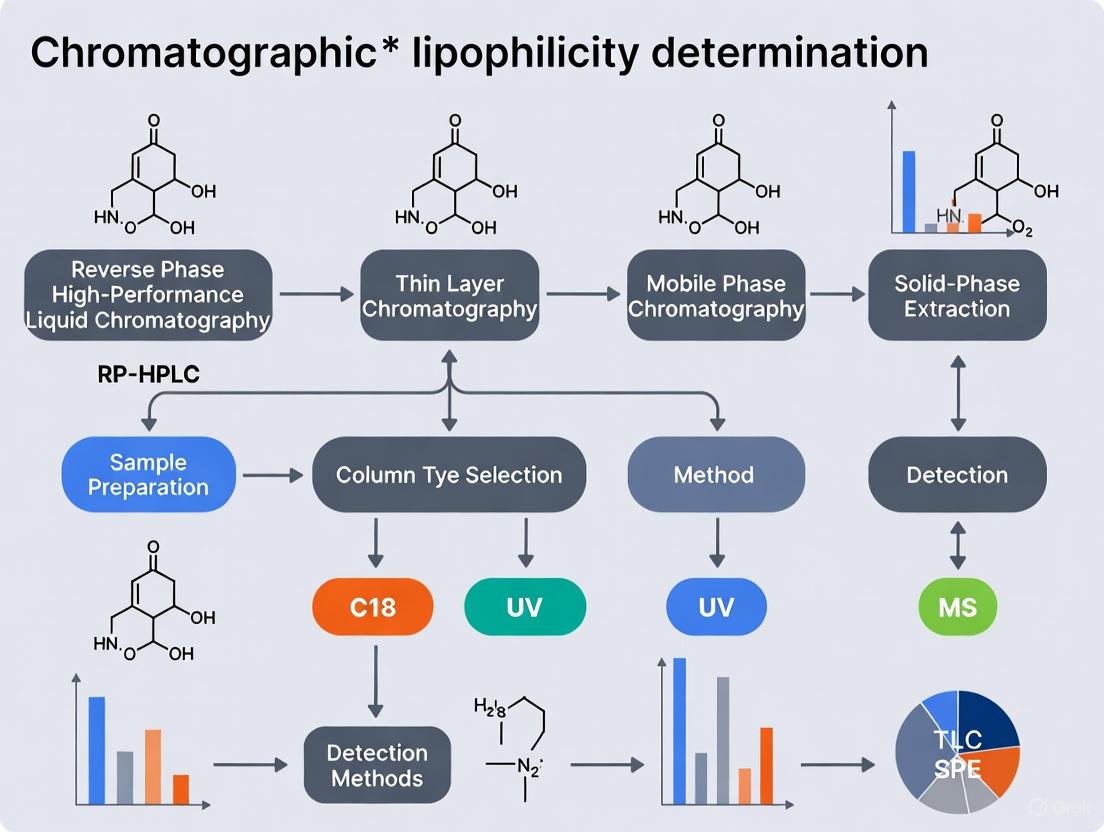
Chromatographic Methods for Lipophilicity Determination in Drug Discovery: A Practical Guide for Researchers
Lipophilicity, quantified as logP and logD, is a fundamental physicochemical property that critically influences the absorption, distribution, metabolism, and excretion (ADME) of potential drug candidates.
Chromatographic Methods for Lipophilicity Determination in Drug Discovery: A Practical Guide for Researchers
Abstract
Lipophilicity, quantified as logP and logD, is a fundamental physicochemical property that critically influences the absorption, distribution, metabolism, and excretion (ADME) of potential drug candidates. This article provides a comprehensive overview of chromatographic techniques—including RP-HPLC, TLC, and GC-MS—for the reliable determination of lipophilicity. Tailored for researchers and drug development professionals, it covers foundational principles, detailed methodologies, troubleshooting for complex compounds, and validation strategies. By integrating experimental and in silico approaches, this guide supports the efficient selection of optimal chromatographic methods to enhance the drug discovery pipeline and reduce late-stage attrition.
Lipophilicity 101: Why logP and logD are Cornerstones of Drug Design
Lipophilicity is a fundamental physicochemical property in drug discovery, critically influencing a compound's solubility, permeability, membrane penetration, and overall absorption, distribution, metabolism, excretion, and toxicity (ADMET) profile [1]. It is most commonly quantified through two key parameters: the partition coefficient (logP) and the distribution coefficient (logD). Within the context of chromatographic method development for lipophilicity assessment, understanding the distinction between these two parameters is essential for designing accurate analytical protocols and interpreting retention data. This application note delineates the theoretical and practical differences between logP and logD, provides detailed experimental protocols for their determination, and situates these methods within modern chromatographic research.
Theoretical Foundations: logP vs. logD
The partition coefficient, logP, describes the ratio of the concentrations of a solute in a mixture of two immiscible solvents at equilibrium, typically 1-octanol and water. Crucially, logP refers only to the neutral, un-ionized form of the compound [2]. It is a constant for a given solute and solvent system, independent of pH.
In contrast, the distribution coefficient, logD, is the ratio of the sum of the concentrations of all forms of the compound (ionized plus un-ionized) in each of the two phases [2]. LogD is therefore pH-dependent and provides a more accurate representation of a compound's lipophilicity under specific physiological or experimental conditions. The most pharmacologically relevant value is typically logD at pH 7.4, the physiological pH of blood serum [1].
The relationship between logP and logD is governed by the compound's acid dissociation constant (pKa) and the pH of the aqueous phase. For a monoprotic acid, the relationship can be expressed as: LogD = logP - log(1 + 10^(pH-pKa)) For a monoprotic base, the relationship is: LogD = logP - log(1 + 10^(pKa-pH)) This theoretical framework is vital for predicting chromatographic behavior, as the ionization state of a molecule directly impacts its interaction with the stationary phase [3].
Table 1: Core Definitions and Differences between logP and logD
| Feature | Partition Coefficient (logP) | Distribution Coefficient (logD) |
|---|---|---|
| Definition | Ratio of concentrations of the un-ionized solute in octanol and water [2]. | Ratio of the sum of all species (ionized + un-ionized) in octanol and water [2]. |
| pH Dependence | Constant; independent of pH. | Variable; highly dependent on the pH of the aqueous phase. |
| Reflects Ionization | No | Yes |
| Typical Reporting | Reported as a single value (e.g., clogP). | Reported with a specified pH (e.g., logD~7.4~) [1]. |
| Physiological Relevance | Limited, as most drugs are ionized at physiological pH. | High, as it accounts for ionization state in biological systems [1]. |
Experimental Determination: Methodologies and Protocols
The Shake-Flask Method (Gold Standard)
The shake-flask method is the gold standard for the direct experimental determination of logP and logD and is recommended by the Organization for Economic Co-operation and Development (OECD) [4].
Protocol for logP Determination:
- Preparation: Saturate 1-octanol with water and water with 1-octanol prior to use to prevent solvent demixing during the experiment.
- Partitioning: Dissolve a known amount of the pure analyte in a suitable volume of the pre-saturated octanol-water system (a common volume ratio is 1:1) in a sealed flask.
- Equilibration: Shake the mixture vigorously for a predetermined period (which can range from 1 to 24 hours) at a constant temperature to reach partitioning equilibrium [4].
- Separation: Allow the phases to separate completely, often by centrifugation, to break any emulsions.
- Analysis: Carefully separate the two phases and quantify the concentration of the analyte in each phase using a suitable analytical technique, most often High-Performance Liquid Chromatography (HPLC) due to its wide applicability and low detection limits [4].
- Calculation: Calculate logP as the logarithm (base 10) of the ratio of the analyte concentration in the octanol phase to the concentration in the aqueous phase.
Protocol for logD Determination: The procedure for logD is identical to that for logP, with one critical modification: the aqueous phase is a buffer of specific pH (e.g., phosphate buffer for pH 7.4) instead of pure water [1]. The concentration measured in the aqueous phase will include all ionized and un-ionized species, yielding the distribution coefficient at that pH.
Limitations: The shake-flask method is labor-intensive, requires relatively large amounts of pure compound, and is not well-suited for compounds with very high or very low logP values due to analytical detection limits [4]. It is also not suitable for surface-active or unstable compounds.
Chromatographic Methods
Chromatographic methods offer a robust, viable, and resource-sparing alternative for lipophilicity estimation [5]. These methods correlate a compound's retention time or capacity factor with its lipophilicity.
Protocol for RP-HPLC Determination of Lipophilicity Parameters:
- Column Selection: Use a reversed-phase column. The C18 stationary phase is most widely used due to its strong hydrophobic interactions [6]. C8, phenyl, or specialized phases like Immobilized Artificial Membrane (IAM) can also be used for comparative profiling [7] [8].
- Mobile Phase: Utilize a binary mixture of water and a water-miscible organic modifier (e.g., methanol or acetonitrile). The pH of the aqueous component must be carefully controlled using a buffer when determining logD; for logD~7.4~, a phosphate buffer at pH 7.4 is standard [7].
- Calibration: Construct a calibration curve by analyzing a series of standard compounds with known logP or logD values under isocratic conditions. The logarithm of the retention factor (logk) is plotted against the known lipophilicity values of the standards [7].
- Analysis: Inject the analyte and measure its retention time under the same isocratic conditions.
- Calculation: Calculate the retention factor (logk) for the analyte and use the calibration curve to interpolate its logP or logD value.
This method is particularly valuable for high-throughput estimation and requires minimal compound consumption [5] [9].
Table 2: Comparison of Key Experimental Methods for Lipophilicity Determination
| Method | Principle | Throughput | Sample Consumption | Key Advantages | Key Limitations |
|---|---|---|---|---|---|
| Shake-Flask | Direct partitioning between octanol and water [4]. | Low | High (mg) | Gold standard; direct measurement [4]. | Labor-intensive; slow; emulsion formation [4]. |
| Slow-Stirring | Partitioning under slow stirring to prevent emulsions [4]. | Very Low | High | More accurate for logP > 4.5 [4]. | Very long equilibration time (days) [4]. |
| RP-HPLC | Correlation of retention time with lipophilicity of standards [5] [7]. | High | Low (µg) | Fast, robust, suitable for impure compounds [5]. | Indirect method; requires a calibration set. |
| VALLME | Vortex-assisted liquid-liquid microextraction [4]. | Medium | Low (µg) | Rapid equilibration (~2 min) [4]. | Requires optimization of extraction parameters. |
The Scientist's Toolkit: Essential Reagents and Materials
Table 3: Research Reagent Solutions for Lipophilicity Determination
| Reagent/Material | Function/Application |
|---|---|
| 1-Octanol (n-Octanol) | The standard lipophilic solvent in shake-flask and slow-stirring methods [2]. |
| Buffer Solutions (e.g., Phosphate) | To maintain a specific pH in the aqueous phase for logD determination (e.g., pH 7.4) [1]. |
| Reverse-Phase HPLC Columns (C18, C8) | The stationary phase for chromatographic lipophilicity estimation; C18 is most common [6]. |
| Immobilized Artificial Membrane (IAM) Columns | Specialized stationary phase designed to mimic cell membranes, providing biomimetic retention data [7]. |
| HPLC-grade Organic Modifiers (Methanol, Acetonitrile) | Components of the mobile phase in RP-HPLC methods [6]. |
| Standard Compounds with Known logP/logD | Used to create calibration curves for chromatographic methods (e.g., in the HPLC protocol) [7]. |
Workflow and Relationship Visualization
The following diagram illustrates the logical decision-making process for selecting the appropriate lipophilicity parameter and determination method based on the research objective and compound properties.
Lipophilicity Assessment Workflow
A precise understanding of the distinction between logP and logD is non-negotiable in modern drug discovery and chromatographic research. While logP describes the intrinsic hydrophobicity of a neutral molecule, logD provides a pH-responsive and physiologically relevant measure of lipophilicity. The shake-flask method remains the benchmark for direct measurement, but chromatographic techniques, particularly RP-HPLC, have emerged as powerful, high-throughput tools for lipophilicity estimation within a drug development setting. The choice of method and parameter should be guided by the specific research question, the physicochemical properties of the compounds under investigation, and the required throughput, as outlined in the provided protocols and workflows.
The Critical Role of Lipophilicity in ADMET Properties and Drug-Likeness
Lipophilicity is a fundamental physicochemical property defined as the affinity of a molecule or a moiety for a lipophilic environment [10]. It is most commonly measured by a compound's distribution behavior in a biphasic system, typically n-octanol and water, and is quantitatively expressed as the partition coefficient (logP) for neutral compounds or the distribution coefficient (logD) for ionizable compounds at specific pH values [10]. According to the pH-partition hypothesis, the absorption of ionizable drugs occurs where the local pH provides the maximum concentration of the non-ionized form relative to the ionized form concentration [11]. This property represents a delicate balance between two major contributions: hydrophobicity, which relates to the tendency of non-polar compounds to prefer a non-aqueous environment, and polarity, which encompasses electrostatic interactions and hydrogen bonding capabilities [10].
In pharmaceutical research and development, lipophilicity serves as a critical parameter that profoundly influences a compound's pharmacokinetic and pharmacodynamic profiles [12]. It governs a drug molecule's partition into various lipids and protein phases, thereby reducing the free drug concentration at the active site [13]. A proper balance between specific binding potency and nonspecific partition of compounds is therefore of paramount importance in the design of developable, effective drug molecules [13]. The essential relationship between lipophilicity and key ADMET properties is visualized in the following diagram.
The significant impact of lipophilicity on drug disposition has made it a central component in various developability criteria, including oral absorption, central nervous system penetration, and overall pharmacokinetic parameters [13]. As noted in recent literature, the number of publications on lipophilicity and partition coefficient has quadrupled or even increased fivefold in the past two decades, reflecting the growing recognition of its importance in drug discovery and development [10].
Lipophilicity Determination Methods: Experimental and Computational Approaches
The accurate determination of lipophilicity parameters remains a critical activity in pharmaceutical research, with methods broadly categorized into experimental techniques and computational approaches. Each methodology offers distinct advantages and limitations, making them suitable for different stages of the drug discovery and development process.
Experimental Methods for Lipophilicity Assessment
Experimental methods for lipophilicity determination include classical techniques such as the shake-flask method and modern chromatographic approaches. The shake-flask method (SFM), based on liquid-liquid extraction using the n-octanol/water system, represents the gold standard for lipophilicity measurement [10]. This method, recommended by the Organization for Economic Co-operation and Development (OECD), allows direct measurement of partition coefficients and offers accurate results with minimal sample requirements [12]. However, it has several limitations: it is relatively time-consuming, requires high compound purity, is unsuitable for unstable compounds, and has a limited measurement range of -2 < logP < 4 [14].
Chromatographic techniques have increasingly replaced classical methods due to their higher throughput, reduced sample requirements, and broader applicability. Reversed-phase high-performance liquid chromatography (RP-HPLC) and reversed-phase thin-layer chromatography (RP-TLC) are the most widely used indirect methods for experimentally determining lipophilicity [12]. Both chromatographic methods require smaller sample amounts and relatively shorter analysis times compared to the classical shake-flask method, with obtained results being highly repeatable and accurate within ±1 unit relative to shake-flask values [12].
Computational Methods for Lipophilicity Prediction
Computational approaches for predicting lipophilicity have gained significant traction in early drug discovery due to their speed and cost-effectiveness [12]. Numerous software platforms and algorithms are available for in silico prediction of logP values, including iLOGP, XLOGP3, WLOGP, MLOGP, SILCOS-IT, and those implemented in SwissADME and pkCSM platforms [12]. These computational tools apply various algorithms based on structural, atomistic, topological, electrotopological, or other considerations on drawn chemical structures [10]. The performance of these predictive models continues to improve with advances in machine learning and the availability of large, high-quality experimental datasets [15].
Table 1: Comparison of Lipophilicity Determination Methods
| Method | Prediction Range (logP) | Speed | Sample Requirements | Key Advantages | Key Limitations |
|---|---|---|---|---|---|
| Shake-flask | -2 to 4 | Slow | High purity, moderate amount | Direct measurement, accurate results | Time-consuming, limited range, requires pure compounds |
| RP-HPLC | 0 to 6 | Rapid | Small amount, low purity | Automated, broad range, high throughput | Requires calibration, indirect measurement |
| RP-TLC | Extended range | Rapid | Minimal amount, low purity | Simple equipment, low cost, high transfer rate | Less automated than HPLC |
| Computational | Broad | Very rapid | None needed | Fast, cost-effective, no compound needed | Accuracy depends on algorithm and compound class |
Detailed Experimental Protocols for Lipophilicity Determination
RP-HPLC Method for Lipophilicity Screening
Reversed-phase high-performance liquid chromatography provides an automated platform for rapid lipophilicity assessment of compounds during early drug discovery stages. The following protocol outlines two established RP-HPLC methods for lipophilicity determination.
Materials and Equipment:
- HPLC system with UV detection capability
- C18 reversed-phase column (e.g., 150 mm × 4.6 mm, 5 μm particle size)
- Reference compounds with known logP values (e.g., 4-acetylpyridine, acetophenone, chlorobenzene, ethylbenzene, phenanthrene, triphenylamine)
- Mobile phase: Methanol or acetonitrile mixed with aqueous buffer
- Test compounds dissolved in appropriate solvent
Method 1: Rapid Screening Protocol [14]
- System Calibration: Inject selected reference compounds into the chromatographic system to obtain retention times. Calculate capacity factors (k) using the formula: ( k = (tR - t0)/t0 ), where ( tR ) is the retention time of the compound and ( t_0 ) is the column dead time.
- Standard Curve Generation: Plot the logarithms of the capacity factors (log k) against their respective known logP values to establish a standard equation: logP = a × log k + b.
- Sample Analysis: Inject test compounds under identical chromatographic conditions and calculate their capacity factors.
- LogP Determination: Substitute the capacity factors of test compounds into the standard equation to determine their logP values.
Method 2: Enhanced Accuracy Protocol [14]
- Follow steps 1-2 as in Method 1, but perform analyses using three different mobile phase compositions with varying organic modifier content (e.g., 60%, 70%, and 80% methanol).
- For each reference and test compound, establish the relationship between log k and methanol content (φ) using the equation: log k = Sφ + log kw, where log kw is the y-intercept representing the capacity factor in the absence of organic modifier.
- Generate the standard curve by plotting log kw values against known logP values: logP = a × log kw + b.
- Determine log kw for test compounds and calculate their logP values using the standard equation.
Table 2: Reference Compounds for HPLC Lipophilicity Calibration [14]
| Compound Name | logP Value | Typical Retention Time (min) |
|---|---|---|
| 4-Acetylpyridine | 0.5 | ~2.5 |
| Acetophenone | 1.7 | ~4.2 |
| Chlorobenzene | 2.8 | ~7.8 |
| Ethylbenzene | 3.2 | ~9.5 |
| Phenanthrene | 4.5 | ~15.3 |
| Triphenylamine | 5.7 | ~27.1 |
Method 1 is particularly suitable for early screening stages where rapid analysis of large compound libraries is required, typically achieving analysis within 30 minutes per sample [14]. Method 2, while more time-consuming (2-2.5 hours per compound), provides higher accuracy and is recommended for later stages of drug development where precise logP values are critical for lead optimization [14].
RP-TLC Method for Lipophilicity Assessment
Reversed-phase thin-layer chromatography offers a simple, cost-effective alternative for lipophilicity determination, especially suitable for laboratories with limited analytical resources.
Materials and Equipment:
- TLC chambers
- RP-TLC plates (RP-2, RP-8, or RP-18 stationary phases)
- Organic modifiers (acetone, acetonitrile, 1,4-dioxane, methanol)
- TRIS buffer (pH 7.4) or other appropriate aqueous buffers
- Detection system (UV lamp or appropriate staining reagents)
Experimental Protocol [12] [11]:
- Mobile Phase Preparation: Prepare mobile phases with varying concentrations of organic modifier in aqueous buffer (e.g., 40-80% v/v acetone in TRIS buffer, pH 7.4).
- Sample Application: Spot test compounds and appropriate standards on RP-TLC plates using capillary tubes or automated applicators.
- Chromatogram Development: Develop chromatograms in saturated TLC chambers until the mobile front reaches a predetermined distance (typically 8-10 cm).
- Detection and Measurement: Visualize spots under UV light or using appropriate detection methods and measure the migration distance of each compound.
- Data Calculation: Calculate the RM value using the formula: ( RM = \log(1/RF - 1) ), where ( R_F ) is the retention factor (distance traveled by compound divided by distance traveled by solvent front).
- Lipophilicity Determination: Plot RM values against organic modifier concentration for each compound. The extrapolated value to 0% organic modifier (RM0) serves as the chromatographic lipophilicity parameter, which can be correlated with logP.
The RP-TLC method has demonstrated excellent correlation with traditional shake-flask measurements while offering advantages of simplicity, minimal mobile phase consumption, high throughput, and low operational costs [11]. It can be applied to compounds with increased lipophilicity and is relatively insensitive to sample impurities [11].
Advanced Biomimetic Chromatography Approaches
Beyond traditional reversed-phase methods, advanced chromatographic techniques utilizing biomimetic stationary phases have been developed to better simulate biological partition processes. These approaches provide lipophilicity parameters that often correlate more closely with in vivo distribution behavior.
Immobilized Artificial Membrane (IAM) Chromatography utilizes stationary phases coated with phospholipid analogs that mimic cell membranes [10] [13]. The retention data from IAM chromatography have been shown to model membrane permeability and blood-brain barrier distribution more accurately than traditional octanol-water partition coefficients [13].
Human Serum Albumin (HSA) and α1-Acid Glycoprotein (AGP) Chromatography employ stationary phases with immobilized plasma proteins to assess drug-protein binding, which significantly influences drug distribution and free concentration in plasma [10] [13]. The binding constants derived from these chromatographic systems (KHSA and KAGP) show excellent correlation with measured plasma protein binding and can reliably rank molecules even in the high binding region (above 95% bound) [13].
The experimental workflow for comprehensive lipophilicity assessment using multiple chromatographic approaches is illustrated below.
The Scientist's Toolkit: Essential Research Reagents and Materials
Successful implementation of lipophilicity determination protocols requires specific reagents and materials optimized for each methodology. The following table summarizes key research solutions for comprehensive lipophilicity assessment.
Table 3: Essential Research Reagents and Materials for Lipophilicity Determination
| Category | Specific Items | Function/Application | Notes |
|---|---|---|---|
| Chromatographic Phases | RP-18, RP-8, RP-2 TLC plates | Stationary phases with varying hydrophobicity for RP-TLC | RP-18 most hydrophobic; suitable for wide lipophilicity range [16] |
| C18 HPLC columns | Standard reversed-phase columns for HPLC lipophilicity screening | 150-250 mm length; 4.6 mm internal diameter recommended [14] | |
| IAM HPLC columns | Biomimetic phases for membrane partitioning studies | Mimics phospholipid bilayer environment [13] | |
| HSA/AGP HPLC columns | Protein-coated phases for protein binding assessment | Predicts plasma protein binding behavior [13] | |
| Organic Modifiers | Methanol | Mobile phase modifier for RP-HPLC and RP-TLC | Does not affect hydrogen bond formation in water [14] |
| Acetonitrile | Alternative mobile phase modifier | Different selectivity compared to methanol | |
| Acetone, 1,4-dioxane | Organic modifiers for RP-TLC systems | Used in TRIS buffer (pH 7.4) for physiological relevance [12] | |
| Buffer Systems | TRIS buffer (pH 7.4) | Aqueous component for physiologically relevant measurement | Mimics physiological pH conditions [12] |
| Phosphate buffers | Alternative buffer systems for specific pH requirements | pH range 3-8 for logD determination | |
| Reference Standards | 4-Acetylpyridine (logP 0.5) | Low lipophilicity calibrant | Essential for calibration curve establishment [14] |
| Acetophenone (logP 1.7) | Moderate lipophilicity calibrant | Mid-range reference standard [14] | |
| Phenanthrene (logP 4.5) | High lipophilicity calibrant | Validates method for highly lipophilic compounds [14] | |
| Triphenylamine (logP 5.7) | Very high lipophilicity calibrant | Extends measurable range to logP ~6 [14] | |
| Software Tools | SwissADME | Web tool for computational logP prediction and ADME screening | Freely available; multiple algorithm options [12] |
| pkCSM | Platform for pharmacokinetic prediction | Includes lipophilicity and ADMET parameters [12] | |
| Chemaxon | Commercial software for logP and molecular property prediction | High performance in blind challenges [15] |
Lipophilicity remains a central consideration in drug design and development, with profound influences on ADMET properties and overall drug-likeness. The critical role of this physicochemical parameter necessitates accurate, reliable determination methods that can be implemented throughout the drug discovery pipeline. Chromatographic techniques, particularly RP-HPLC and RP-TLC, provide robust platforms for lipophilicity assessment that balance throughput, accuracy, and practical feasibility. These methods have largely replaced classical approaches like the shake-flask method in routine applications, though computational predictions continue to gain prominence for early-stage screening.
The establishment of standardized protocols for lipophilicity determination, as detailed in this application note, enables researchers to obtain consistent, comparable data across different compounds and projects. Furthermore, the development of biomimetic chromatographic approaches has enhanced our ability to predict biological distribution behavior more accurately, supporting more informed decisions in lead optimization candidate selection. As drug discovery continues to evolve with new modalities such as PROTACs and other complex molecules, chromatographic methods for lipophilicity determination will remain essential tools for balancing potency with developability in the pursuit of innovative therapeutics.
Lipinski's Rule of Five and the Optimal logP Range for Oral Drugs and BBB Penetration
Lipinski's Rule of Five (RO5) stands as a fundamental principle in drug discovery, providing a crucial framework for predicting the oral bioavailability of potential drug candidates. Formulated by Christopher Lipinski in 1997, this rule evaluates "drug-likeness" based on key physicochemical properties that significantly influence a compound's absorption and permeability [17]. The rule stipulates that poor absorption or permeation is more likely when a molecule violates more than one of the following criteria: Molecular Weight (MW) ≤ 500, calculated logP (ClogP) ≤ 5, Hydrogen Bond Donors (HBD) ≤ 5, and Hydrogen Bond Acceptors (HBA) ≤ 10 [18] [17] [19]. The name "Rule of Five" derives from the thresholds being multiples of five.
Among these parameters, lipophilicity, quantified as the octanol-water partition coefficient (logP), is particularly critical. It serves as a key determinant in a drug's performance, influencing its solubility, absorption, membrane permeability, distribution, and metabolism [20]. This application note explores the optimal logP ranges for oral drugs and those targeting the central nervous system (CNS), all within the context of chromatographic methods for lipophilicity determination.
Key Principles and Parameters
Lipinski's Rule of Five and Its Role in Drug Discovery
The Rule of Five serves as an early-stage filter in drug discovery to identify compounds with a high probability of exhibiting good oral bioavailability. It was established based on the observation that most orally administered drugs are relatively small and moderately lipophilic molecules [17]. The rule focuses on properties that impact a drug's pharmacokinetics in the human body, particularly its absorption, distribution, metabolism, and excretion (ADME) characteristics [18] [17]. It is vital to note that the RO5 predicts "drug-likeness," not pharmacological activity [17]. Adherence to these guidelines helps in maintaining a balance of physicochemical properties, thereby reducing attrition rates in later, more costly clinical development stages [17] [21].
Defining logP and logD: Partitioning vs. Distribution
Understanding lipophilicity requires a clear distinction between two key metrics:
- logP: The partition coefficient is a constant defined as the ratio of the concentration of a compound in its neutral (unionized) form in an organic phase (typically n-octanol) to its concentration in an aqueous phase (water) [20] [22]. It is a fixed value for a given compound under standard conditions.
- logD: The distribution coefficient is a pH-dependent measure that accounts for the distribution of all forms of a compound (ionized, partially ionized, and unionized) between the organic and aqueous phases at a specified pH, most commonly physiological pH (7.4) [22].
For compounds with no ionizable groups, logP and logD at pH 7.4 (logD7.4) are identical. However, for ionizable compounds, which represent a large proportion of drug molecules, logD provides a more accurate and physiologically relevant picture of lipophilicity, as it accounts for the ionization state of the drug in biological environments [22] [7]. Experimental determination of logD7.4 is often performed using reversed-phase high-performance liquid chromatography (RP-HPLC) with a standard curve based on compounds with known partition coefficients [7].
The Critical Role of logP/logD in Bioavailability and BBB Penetration
Lipophilicity is a primary driver of passive diffusion across biological membranes, including the gastrointestinal tract and the blood-brain barrier (BBB) [18] [20]. For oral bioavailability, a molecule must possess sufficient aqueous solubility to dissolve in the GI fluids and adequate lipophilicity to permeate the intestinal epithelial cells [21]. An optimal logP balances these often opposing properties; excessively low logP limits permeability, while excessively high logP compromises solubility and increases the risk of metabolic sequestration and toxicity [21] [20].
The BBB presents an even greater challenge, as it is a highly selective barrier that restricts the passage of most molecules from the bloodstream into the brain [23]. Passive diffusion across the BBB is strongly influenced by a molecule's size and lipid solubility [18] [23]. Consequently, logP is a foundational parameter in models predicting BBB permeability (BBBP) [24] [23].
Optimal logP/logD Ranges for Oral and CNS Drugs
Extensive research has established target ranges for logP and logD to optimize drug performance for different therapeutic goals.
Table 1: Optimal logP and logD Ranges for Different Drug Types
| Drug Type | Target logP / logD Range | Rationale and Key Considerations |
|---|---|---|
| General Oral Drugs | logP < 5 (per RO5) [17]; Optimal logP 1.35–1.8 [20] or 1–3 [21] | Balances aqueous solubility and intestinal membrane permeability. A logP between 1 and 3 is generally considered favorable for oral bioavailability [21]. |
| CNS-Targeting Drugs | logP ~2 [20]; logP 1.5–2.7 [19] | Ensures sufficient lipophilicity to cross the BBB via passive diffusion while avoiding excessive retention in lipid membranes. Optimal BBB penetration is postulated to be within logP 1.5–2.7 [19]. |
| Sub-lingual Drugs | logP > 5 [20] | High lipophilicity favors rapid absorption through the sublingual mucosa. |
| Lead-like Compounds (Rule of 3) | logP ≤ 3 [17] | Provides "chemical space" for medicinal chemists to optimize potency and selectivity while maintaining drug-likeness in the final candidate. |
For CNS drugs, the target logP is slightly higher than for general oral drugs to facilitate BBB penetration, but it is still within a narrow range to prevent non-specific binding and poor solubility [20] [19]. The parameter logD at physiological pH (logD7.4) is often a more reliable predictor than logP, as it reflects the compound's true lipophilic character in the blood [22]. For instance, a study on 1,3,4-thiadiazol-2-yl)-benzene-1,3-diols determined that the logD7.4 parameter provided a more accurate assessment of their lipophilic character at physiological pH, which is critical for predicting their behavior in vivo [7].
Experimental Protocols for Lipophilicity Determination
Accurate determination of lipophilicity is paramount. While in silico methods are valuable for high-throughput screening, experimental validation using chromatographic techniques remains the gold standard.
Protocol: Determination of log kw Using Reversed-Phase HPLC
This protocol describes the measurement of the chromatographic hydrophobicity index (log kw) using isocratic RP-HPLC, a widely accepted approach for lipophilicity assessment [7].
1. Principle: The retention time of a analyte on a non-polar stationary phase is directly related to its lipophilicity. The log kw parameter is derived by extrapolating the retention factor (k) to 0% organic modifier, representing partitioning into a purely aqueous mobile phase [7].
2. Materials and Equipment:
- HPLC System with UV-Vis or DAD detector
- Chromatography Data System for data acquisition and analysis
- RP-HPLC Columns: C18 (octadecyl) is the most common [7]. Other columns such as C8 (octyl), IAM (Immobilized Artificial Membrane), cholesterol-bonded, and biphenyl-bonded phases can provide complementary biomimetic information [7].
- Mobile Phase: High-purity water and organic modifier (HPLC-grade Methanol or Acetonitrile)
- Analytes: Compounds of interest, dissolved in a suitable solvent (e.g., DMSO, methanol)
- Void Time Marker: A non-retained compound (e.g., uracil or sodium nitrate)
3. Procedure:
- Step 1: System Equilibration. Equilibrate the HPLC column with a mobile phase containing a specific percentage of organic modifier (e.g., 70% MeOH) until a stable baseline is achieved.
- Step 2: Void Time Determination. Inject the void time marker and record its retention time (t₀).
- Step 3: Analyte Injection. Inject the analyte solution and record its retention time (tᵣ). Ensure each run is replicated.
- Step 4: Calculate Retention Factor. For each mobile phase composition, calculate the retention factor: k = (tᵣ - t₀) / t₀.
- Step 5: Repeat with Different Mobile Phones. Repeat steps 1-4 using at least 4-5 different isocratic mobile phases with varying percentages of organic modifier (e.g., 60%, 70%, 80%, 90% MeOH).
- Step 6: Extrapolate to log kw. Plot the log k values against the volume fraction of organic modifier (%MeOH or %ACN). The y-intercept (at 0% organic modifier) of the resulting line is the log kw value.
Protocol: Determination of logD7.4 Using a Standard Curve
This protocol uses the log kw values obtained from a C18 column to calculate the physiologically relevant logD7.4 via a calibration curve [7].
1. Principle: A linear relationship (Collander equation) exists between the extractively determined logP/logD values of standard compounds and their chromatographically determined log kw values [7].
2. Materials and Equipment:
- All materials from Protocol 4.1.
- Standard Compounds: A minimum of 6 compounds with known, experimentally determined logP or logD7.4 values that span a wide lipophilicity range.
3. Procedure:
- Step 1: Measure log kw of Standards. Using the C18 column and a consistent mobile phase system (e.g., MeOH/H₂O), determine the log kw value for each standard compound following Protocol 4.1.
- Step 2: Construct Standard Curve. Plot the known logP/logD7.4 values of the standard compounds against their measured log kw values. Perform linear regression to obtain the equation: logD7.4 = A × log kw + B.
- Step 3: Measure log kw of Unknowns. Determine the log kw value for the test compound(s) under the exact same chromatographic conditions.
- Step 4: Calculate logD7.4. Use the equation from the standard curve to calculate the logD7.4 of the test compound(s).
Workflow Visualization
The following diagram illustrates the logical relationship between molecular properties, their determination, and the ultimate goal of designing bioavailable drugs.
The Scientist's Toolkit: Essential Reagents and Materials
Table 2: Key Research Reagents and Materials for Lipophilicity Determination
| Item | Function/Description | Application Notes |
|---|---|---|
| C18 (Octadecyl) HPLC Column | The standard reversed-phase column; separation is based primarily on hydrophobic interactions. | Officially recognized by IUPAC and OECD for lipophilicity assessment. Most common choice for log kw and logD7.4 determination [7] [25]. |
| IAM (Immobilized Artificial Membrane) HPLC Column | Silica surface modified with immobilized phosphatidylcholine groups to mimic cell membranes. | Retention results from hydrophobic, ion-pairing, and H-bonding interactions. Provides superior biomimetic properties for predicting passive membrane transport [7] [24]. |
| Methanol (MeOH) & Acetonitrile (ACN) | HPLC-grade organic modifiers used in the mobile phase. | MeOH is most common for lipophilicity studies. ACN can be used as an alternative to change selectivity. |
| Phosphate Buffer (pH 7.4) | Used to adjust the aqueous component of the mobile phase to physiological pH. | Essential for accurate logD7.4 determination, as it ensures the analyte is in its correct ionization state [22]. |
| logP/logD Standard Compounds | A set of compounds with known, experimentally determined partition/distribution coefficients. | Used to construct a standard curve for converting chromatographic retention (log kw) to logP or logD7.4 [7]. |
| Uracil or Sodium Nitrate | A non-retained compound used to determine the column's void time (t₀). | Critical for the accurate calculation of the retention factor (k). |
Lipinski's Rule of Five, with its emphasis on molecular weight, hydrogen bonding, and particularly lipophilicity (logP), remains a cornerstone of rational drug design. For oral drugs, adhering to an optimal logP range of approximately 1–3, and a more specific range of 1.5–2.7 for CNS-active drugs, dramatically increases the likelihood of achieving sufficient bioavailability and BBB penetration. The distinction between logP and the pH-dependent logD is critical for ionizable compounds. The experimental protocols outlined herein, utilizing robust and biomimetic chromatographic methods like RP-HPLC and IAM-HPLC, provide researchers with reliable tools to quantify these essential parameters, thereby guiding the successful development of new therapeutic agents.
Lipophilicity, a key physicochemical property, is fundamentally defined as the affinity of a molecule or a moiety for a lipophilic environment [10]. In medicinal chemistry and drug discovery, this parameter is conventionally expressed as the decimal logarithm of the partition coefficient (log P), which represents the ratio of the concentrations of a solute at equilibrium between a non-aqueous phase (typically n-octanol) and an aqueous phase (water) [26] [27]. For ionizable compounds, the distribution coefficient (log D) provides a more accurate descriptor at a specific pH, as it accounts for all forms of the compound—both neutral and ionized [26] [10]. Lipophilicity stands as a pivotal determinant in the pharmacokinetic and pharmacodynamic profiles of potential drug candidates. It profoundly influences membrane permeability, solubility, distribution within the body, and the interaction with biological targets [26]. Poor characteristics related to lipophilicity are frequently associated with drug failure, inefficacy, toxicity, and escalated development costs [26]. Consequently, the accurate determination of this property is not merely beneficial but compulsory in the early stages of the drug discovery process [28].
The methods for assessing lipophilicity have evolved significantly, transitioning from classical techniques to more sophisticated, high-throughput instrumental analyses. This evolution is driven by the necessity to obtain reliable data rapidly for vast compound libraries. The following table summarizes the core definitions that underpin this field of study.
Table 1: Fundamental Descriptors of Lipophilicity
| Term | Mathematical Expression | Description |
|---|---|---|
| Partition Coefficient (log P) | ( \log P = \log \frac{[C]o}{[C]w} ) | Describes the distribution of the neutral form of a compound between n-octanol and water [26] [10]. |
| Distribution Coefficient (log D) | ( \log D{\text{acids}} = \log P - \log(1 + 10^{pH-pKa}) ) ( \log D{\text{bases}} = \log P - \log(1 + 10^{pKa-pH}) ) | Describes the distribution of all forms of a compound (neutral and ionized) at a specified pH [26] [10]. |
The Evolution of Measurement Methodologies
The Gold Standard: Shake-Flask Method
The shake-flask method (SFM) is widely recognized as the classical and reference technique for lipophilicity determination [10] [27]. This direct method involves dissolving the analyte in a biphasic system of n-octanol and water (or buffer), which are pre-saturated with each other to prevent phase volume changes. The mixture is shaken vigorously to facilitate partitioning, allowed to reach equilibrium, and then separated [10]. The concentration of the compound in each phase is subsequently quantified, most reliably using liquid chromatography (LC) due to its low detection limit and wide applicability [27]. The SFM is prized for its accuracy and directness, making it the benchmark against which other methods are validated [28]. An excellent equivalence has been found between log P values obtained by shake-flask and potentiometry, another direct method [28] [29].
However, the SFM has notable constraints. It is a time-consuming and labor-intensive process, ill-suited for the high-throughput demands of modern early-stage drug discovery [28] [14]. Its effective measurement range is generally limited to -2 < log P < 4, as highly lipophilic compounds have immeasurably low solubility in the aqueous phase, while very hydrophilic compounds present the reverse challenge [14] [10]. The method also demands high compound purity and is unsuitable for unstable compounds [14].
The Chromatographic Revolution
The limitations of the SFM spurred the adoption of chromatographic techniques, which offer indirect, efficient, and robust means of lipophilicity estimation. The underlying principle is the strong correlation between a compound's retention in a chromatographic system and its lipophilicity [26] [27]. In these systems, the hydrophobic stationary phase simulates the n-octanol environment, while the aqueous-organic mobile phase represents the aqueous environment [26]. The retention factor (k) is used to derive a lipophilicity index.
Reversed-Phase High-Performance Liquid Chromatography (RP-HPLC) has been particularly impactful. The Organisation for Economic Co-operation and Development (OECD) endorses RP-HPLC as a preferred method, especially for compounds challenging to measure with SFM [26]. The general procedure involves:
- Injecting reference compounds with known log P values to obtain their retention times and calculate capacity factors (k) [14] [30].
- Plotting the log k (or a related parameter) of the standards against their known log P values to establish a standard calibration equation [14] [30].
- Injecting the test compound under the same conditions, calculating its log k, and determining its log P via the standard equation [14] [30].
RP-HPLC provides several advantages over SFM: higher speed of measurement, milder operating conditions, small sample volume, lower purity requirements, and a broader detection range that can be expanded to compounds with log P > 6 [14] [30]. The main trade-off is slightly reduced accuracy compared to the gold standard, making it exceptionally convenient for screening purposes where high-throughput is essential [28] [29].
Reverse-Phase Thin-Layer Chromatography (RP-TLC) offers another green and practical approach. It is the simplest chromatographic technique for determining the lipophilicity of organic molecules, requiring minimal solvent consumption [31] [26]. The parameter RMW, derived from the retention factor Rf, is often interpreted as a log P value [31]. Its advantages include simplicity, low cost, and the ability to analyze several samples simultaneously under various mobile phase compositions [31] [26].
Table 2: Comparison of Primary Lipophilicity Determination Methods
| Method | Measurement Range (log P) | Key Advantages | Key Limitations / Interferences |
|---|---|---|---|
| Shake-Flask | -2 to 4 [14] | Gold standard; accurate; minimal sample requirement [14] | Time-consuming; requires high purity; unsuitable for unstable compounds [14] |
| RP-HPLC | 0 to 6+ [14] | High-throughput; broad range; low purity requirement; rapid [14] [30] | Less accurate than SFM; requires reference compounds and method development [28] |
| RP-TLC | Varies with system | Simple; low cost; green; high parallelism [31] [26] | Less accurate than HPLC; different lipophilicity scale [31] |
| In Silico | Broad | Extremely fast; cost-effective; no physical sample needed [14] | Accuracy depends on algorithm; can be inaccurate for complex structures [14] [27] |
The following workflow diagram illustrates the evolutionary path and decision-making process in selecting the appropriate method for lipophilicity assessment.
Application Notes: Establishing Robust RP-HPLC Methods
Method 1: Rapid Screening for Early Discovery
For early-stage drug screening where speed is critical, a rapid RP-HPLC method can be established. This approach uses a direct correlation between the logarithm of the capacity factor (log k) and the known log P of reference compounds [14]. The critical steps are:
- Reference Compound Selection: A set of 6 compounds with known log P values, covering a wide lipophilicity range (e.g., from 4-acetylpyridine, log P 0.5, to triphenylamine, log P 5.7), is analyzed [14].
- Chromatographic Analysis: The compounds are injected under isocratic or gradient conditions, and their retention times are recorded to calculate the capacity factor, k [14].
- Calibration Curve: A standard equation, log P = a × log k + b, is generated by plotting log k against the reference log P values. A linear correlation coefficient (R²) of ≥ 0.97 is considered acceptable for screening purposes [14].
This method allows for the analysis of compounds with log P values below 6 within 30 minutes, providing an efficient tool for ranking a large number of compounds [14].
Method 2: High-Accuracy Determination for Late-Stage Development
In later stages of drug development, more accurate log P values are required. A second, more refined RP-HPLC method can be employed to eliminate the interference from organic modifiers in the mobile phase, which can affect the pKa of ionic compounds and their retention behavior [14]. The key differentiator of this method is the use of log k_w, the theoretical capacity factor in a purely aqueous mobile phase.
- Multiple Gradient Analysis: The same reference compounds are analyzed under at least three different mobile phase gradients with varying methanol content (φ) [14].
- Determination of log kw: For each compound, an equation is established: log k = Sφ + log kw. The intercept of this line provides the log k_w value [14].
- High-Accuracy Calibration: A new standard equation is generated: log P = a × log k_w + b. This method has demonstrated a superior correlation coefficient (R² = 0.996), yielding more accurate lipophilicity values, albeit at the cost of longer run times (2-2.5 hours per compound) [14].
Table 3: Example Reference Compounds for RP-HPLC Calibration
| Compound Name | Reported log P |
|---|---|
| 4-Acetylpyridine | 0.5 |
| Acetophenone | 1.7 |
| Chlorobenzene | 2.8 |
| Ethylbenzene | 3.2 |
| Phenanthrene | 4.5 |
| Triphenylamine | 5.7 |
Data sourced from [14]
The Scientist's Toolkit: Essential Research Reagents and Materials
The experimental determination of lipophilicity, whether by classical or chromatographic methods, relies on a set of core materials and reagents.
Table 4: Essential Research Reagents and Materials for Lipophilicity Determination
| Item | Function/Application |
|---|---|
| n-Octanol and Water | The standard solvent system for shake-flask and potentiometric methods, simulating the partitioning between lipid and aqueous environments [10]. |
| Reference Compounds | A series of compounds with known, reliably measured log P values (e.g., 4-acetylpyridine, acetophenone, triphenylamine) essential for constructing calibration curves in chromatographic methods [14]. |
| RP-HPLC Column | A reversed-phase column (e.g., C8, C18) with a non-polar stationary phase that interacts with analytes based on their lipophilicity [14]. |
| HPLC-grade Organic Modifiers | Methanol or acetonitrile used in the mobile phase for RP-HPLC. Methanol is often preferred as it does not significantly affect hydrogen bond formation in water [14]. |
| RP-TLC Plates | Plates coated with non-polar stationary phases (e.g., RP-2, RP-8, RP-18F254) used for simple and rapid lipophilicity assessments [31]. |
| Buffers | Aqueous buffer solutions used to control pH in shake-flask (for log D) and in mobile phases for chromatographic methods to ensure consistent ionization states [28] [14]. |
The journey in lipophilicity measurement has evolved from the foundational shake-flask method to sophisticated, high-throughput chromatographic techniques. While the shake-flask procedure remains the gold standard for its directness and accuracy, the imperative for speed and efficiency in modern drug discovery has solidified the role of RP-HPLC as an indispensable tool. Its ability to rapidly and reliably profile vast compound libraries, especially those with high lipophilicity like PROTACs, makes it ideal for early screening [14]. The synergy between these methods—using in silico predictions for initial filtering, RP-HPLC for high-throughput ranking, and shake-flask for definitive validation of key candidates—represents the current best practice. This multi-faceted approach ensures that lipophilicity, a parameter critically intertwined with the success or failure of a drug candidate, is accurately characterized to guide the rational design of compounds with optimal pharmacokinetic and pharmacodynamic profiles.
A Practical Guide to HPLC, TLC, and GC-MS Methods for Lipophilicity Assessment
Lipophilicity, typically expressed as the logarithm of the n-octanol/water partition coefficient (Log P), is a fundamental physicochemical parameter that profoundly influences the absorption, distribution, metabolism, excretion, and toxicity (ADMET) profiles of drug candidates [14] [27]. By front-loading lipophilicity screening into discovery programs, researchers can prioritize lead compounds with more favorable drug-like properties, thereby reducing attrition rates in later clinical stages [14] [32]. While the shake-flask method remains the gold standard for direct Log P determination, Reversed-Phase High-Performance Liquid Chromatography (RP-HPLC) has emerged as a superior indirect method, offering significant advantages in speed, reproducibility, and broad dynamic range [14] [33].
The Organisation for Economic Co-operation and Development (OECD) has formally recognized the HPLC method in Test Guideline 117, validating its use for determining the n-octanol/water partition coefficient [34]. This endorsement solidifies RP-HPLC's position as a core analytical technique in modern medicinal chemistry and drug development pipelines.
Theoretical Foundation and OECD Guidelines
Defining Lipophilicity Parameters
Lipophilicity is quantitatively expressed through two primary parameters:
- Log P: The partition coefficient logarithm for a compound existing entirely in its non-ionized form between organic and aqueous phases [14].
- Log D: The distribution coefficient logarithm accounting for all ionized and non-ionized species of a compound at a specific pH, making it pH-dependent [14] [27].
The OECD Guideline 117 specifies that the HPLC method covers a Log Pow range of 0 to 6, which can be expanded to 0-10 in exceptional cases [34]. The fundamental principle relies on the correlation between a compound's hydrocarbon-water partition coefficient and its retention on a chromatographic column with a non-polar stationary phase, where hydrophilic chemicals elute first and lipophilic chemicals last [34].
The Chromatographic Basis for Log P Determination
In RP-HPLC, the retention behavior of a compound is quantified by its capacity factor (k), calculated as: k = (tR - t0) / t0 where tR is the compound's retention time and t0 is the column dead time [33]. The logarithm of this factor (log k) exhibits a linear relationship with the Log P values of reference compounds, forming the basis for interpolation of unknown Log P values [14] [34].
Establishing RP-HPLC Methods for Lipophilicity Determination
Core Methodologies: A Two-Tiered Approach
Research applications commonly employ two refined RP-HPLC approaches tailored to different development stages:
Table 1: Comparison of RP-HPLC Methods for Log P Determination
| Parameter | Method 1 (Rapid Screening) | Method 2 (High Accuracy) | Shake-Flask Method |
|---|---|---|---|
| Standard Equation | Log P = a × log k + b | Log P = a × log kw + b | Not Applicable |
| Correlation Coefficient (R²) | 0.970 | 0.996 | NA |
| Run Time per Compound | Within 0.5 hours | 2-2.5 hours | ~4 hours |
| Cost/Speed | Low/Fast | High/Slow | High/Slow |
| Application Scenario | Early screening (>30 compounds), time constraints | Late-stage development, no time constraints | No time constraints, limited compound log P range |
| Predictive Ability | Moderate | High | High (Gold Standard) |
Method 1 (Rapid Screening): Designed for early discovery where throughput is crucial, this approach uses a direct correlation between Log P and log k obtained under isocratic or gradient conditions [14]. The method can detect compounds with Log P values below 6 within 30 minutes, making it ideal for ranking large compound libraries [14].
Method 2 (High Accuracy): For late-stage development requiring higher accuracy, this method addresses the interference from organic modifiers by replacing log k with log kw (the theoretical capacity factor in the absence of organic modifier) [14]. The log kw value is obtained by extrapolating from retention times measured at multiple organic modifier concentrations using the equation: log k = Sφ + log kw, where φ represents the organic modifier concentration [14].
Critical Method Development Considerations
Reference Compound Selection
The OECD guidelines emphasize selecting at least six reference compounds with well-established partition coefficients covering the range of values to be determined [35]. A recommended set includes compounds from 4-acetylpyridine (Log P 0.5) to triphenylamine (Log P 5.7) [14]. The reference substances must be chosen to ensure an appropriate distribution of lipophilicity across the calibration range.
Stationary Phase Selection
While traditional C18 silica-based columns are widely used, alternative stationary phases offer advantages for specific applications:
- Polystyrene-divinylbenzene (PRP-1) columns: Exhibit no irreversible binding of polar solutes, are chemically inert across pH 1-13, and provide improved separation of basic compounds [32].
- Cyanopropyl columns: Used for estimating soil adsorption coefficients, containing both lipophilic and polar moieties [36].
Mobile Phase Optimization
Methanol is often the optimal modifier as it doesn't affect hydrogen bond formation in water and can interact with the stationary phase to form a monolayer, providing hydrogen bonding effects similar to n-octanol [14]. For compounds susceptible to ionization, buffered mobile phases are essential, with common buffers including ammonium acetate at various pH levels (4.5, 7.2, 9.8) to control ionization state [32].
Experimental Protocols
Protocol 1: Rapid Log P Screening (Method 1)
Application: Early-stage drug screening of >30 compounds with time constraints.
Materials and Equipment:
- HPLC system with UV or diode array detector
- C18 column (e.g., 150 mm × 4.6 mm, 5 μm)
- Reference compounds (Table 2)
- Mobile phase: Methanol/water or acetonitrile/water mixtures
- Test compounds dissolved in appropriate solvent
Procedure:
- Prepare mobile phase with optimized isocratic or gradient conditions.
- Inject reference compounds individually or as a mixture to determine retention times.
- Calculate capacity factors (k) for each reference compound: k = (tR - t0)/t0, where t0 is determined using an unretained compound like sodium nitrate.
- Generate calibration curve by plotting known Log P values of reference compounds against their log k values.
- Establish linear regression equation: Log P = a × log k + b.
- Inject test compounds under identical chromatographic conditions.
- Calculate Log P for test compounds by interpolating their log k values using the standard curve.
Protocol 2: High-Accuracy Log P Determination (Method 2)
Application: Late-stage development requiring high accuracy, absence of time constraints.
Procedure:
- Select reference compounds as in Protocol 1.
- Run each reference compound under at least three different isocratic mobile phase conditions with varying organic modifier concentrations (φ).
- Plot log k versus φ for each compound and determine the y-intercept (log kw) via linear regression.
- Generate calibration curve by plotting known Log P values of reference compounds against their log kw values.
- Establish linear regression equation: Log P = a × log kw + b.
- For test compounds, determine retention times at multiple organic modifier concentrations and calculate log kw by extrapolation to 0% organic modifier.
- Calculate accurate Log P by substituting log kw into the standard equation.
The Scientist's Toolkit: Essential Research Reagents and Materials
Table 2: Key Research Reagent Solutions for RP-HPLC Log P Determination
| Reagent/Material | Function/Application | Specification Notes |
|---|---|---|
| Reference Compounds | Calibration standard establishment | 6+ compounds covering log P range 0.5-5.7; high purity (>98%) [14] |
| C18 Chromatographic Column | Stationary phase for compound separation | Standard dimensions: 150 mm × 4.6 mm, 5 μm particle size [14] |
| Methanol (HPLC Grade) | Mobile phase modifier | Optimal for hydrogen bonding similar to n-octanol [14] |
| Acetonitrile (HPLC Grade) | Alternative mobile phase modifier | Useful for different selectivity; commonly used in gradient methods [32] |
| Ammonium Acetate Buffer | Aqueous mobile phase component | Typically 25-50 mM; pH adjustable (4.5, 7.2, 9.8) [32] |
| Polystyrene-divinylbenzene (PRP-1) Column | Alternative stationary phase | For basic compounds; wide pH stability (1-13) [32] |
Data Validation and Method Comparison
Validation Against Reference Methods
In comparative studies, RP-HPLC Method 1 demonstrated that 85% of tested compounds showed Log P values consistent with literature values (differences within 0.5 log units) [14]. For the three compounds with greater discrepancies, Method 2 provided data consistent with literature values, confirming its superior accuracy for problematic compounds [14].
Advantages Over Alternative Methods
Table 3: Comprehensive Comparison of Log P Determination Methods
| Method | Prediction Range (log P) | Speed | Sample Purity Requirements | Reproducibility | Key Limitations |
|---|---|---|---|---|---|
| RP-HPLC (Method 1) | 0-6 | Rapid (≤0.5 h/sample) | Low | High | Moderate accuracy |
| RP-HPLC (Method 2) | 0-6 | Slow (2-2.5 h/sample) | Low | Very High | Time-consuming |
| Shake-Flask Method | -2 to 4 | Slow (~4 h/sample) | High | High | Limited range, impure/degradable compounds problematic [14] |
| Computer Simulation | Broad | Rapid | N/A | Variable | Prediction accuracy depends on algorithm and substructure coverage [14] |
The insensitivity to impurities makes RP-HPLC particularly valuable for early-stage compounds that may not be highly purified [32]. Additionally, the method requires very little compound material, and the Log P of multiple compounds in a mixture can theoretically be obtained from a single injection if adequate separation is achieved [32].
Application in Drug Discovery and Development
The integration of RP-HPLC-based lipophilicity measurements has proven particularly valuable in specific application areas:
Natural Products Drug Discovery
The application of a fast-gradient HPLC method using a PRP-1 column has enabled lipophilicity estimation for marine natural products, facilitating the generation of drug-like natural product screening libraries [32]. This approach demonstrated good correlation between experimentally determined and software-calculated Log P values, though discrepancies were observed for halogen-containing compounds [32].
Specialized Compound Classes
RP-HPLC has distinct advantages for challenging compound classes:
- Highly lipophilic compounds (Log P > 5): Traditional methods struggle with aqueous phase solubility limitations, while RP-HPLC can be adapted to measure Log P values up to 6 and beyond [14].
- PROTACs and new modalities: The method is suitable for complex new modalities with high lipophilicity [14].
- Ionizable compounds: Using appropriate pH control and measurement protocols, both Log P and Log D can be determined [33] [27].
RP-HPLC has firmly established itself as an indispensable tool for lipophilicity determination in modern drug development. Its recognition in OECD Guideline 117 confirms its regulatory acceptance and scientific validity. The two-tiered approach—with a rapid screening method for early discovery and a high-accuracy method for late-stage development—provides researchers with flexible strategies to balance throughput and precision according to project needs.
The method's broad dynamic range, insensitivity to impurities, minimal sample requirements, and reproducibility make it particularly suited for contemporary drug discovery paradigms that emphasize early physicochemical profiling. As drug modalities continue to evolve toward more complex structures, the adaptability of RP-HPLC through stationary and mobile phase manipulation will ensure its continued relevance as a workhorse technique for lipophilicity assessment.
In the pursuit of efficient drug design, the determination of lipophilicity stands as a critical physicochemical parameter that profoundly influences a compound's absorption, distribution, metabolism, excretion, and toxicity (ADMET) profile [31] [14]. Chromatographic methods, particularly reversed-phase techniques, have emerged as powerful tools for rapid and accurate lipophilicity assessment. Within these methodologies, the choice of organic modifier in the mobile phase—predominantly methanol, acetonitrile, and 1,4-dioxane—represents a fundamental experimental decision that directly impacts the accuracy, reproducibility, and predictive capability of the results. This application note delineates the distinct properties and effects of these three common modifiers, providing structured protocols and data to guide researchers in selecting the optimal modifier for robust lipophilicity determination within drug development pipelines.
Modifier Properties and Solvation Characteristics
The efficacy of an organic modifier in reversed-phase chromatography is governed by its ability to modulate solute retention through a complex interplay of nonspecific (dipolarity/polarizability) and specific (hydrogen-bonding) solvent-solvent and solvent-solute interactions. Table 1 summarizes the key physicochemical and solvation parameters of methanol, acetonitrile, and 1,4-dioxane.
Table 1: Properties of Common Chromatographic Modifiers
| Property | Methanol | Acetonitrile | 1,4-Dioxane |
|---|---|---|---|
| Chemical Class | Alcohol | Nitrile | Cyclic Ether |
| Dielectric Constant | High | High | Low (~2.2) [37] |
| Kamlet-Taft π* | High Dipolarity/Polarizability [38] | High Dipolarity/Polarizability [38] | Lower Dipolarity/Polarizability |
| Kamlet-Taft α (HBD Acidity) | Strong HBD [38] | Very Weak HBD | Very Weak HBD |
| Kamlet-Taft β (HBA Basicity) | Moderate HBA [38] | Strong HBA [38] | Moderate HBA |
| Preferential Solvation | Can form solvent complexes [38] | Can form solvent complexes [38] | Can form solvent complexes [38] |
| Key Solvation Mechanism | Hydrogen Bond Donation/Acceptance | Strong Dipolarity & HBA | Low Polarity, Hydrophobic Environment |
| Impact on Stationary Phase | Forms monolayer, simulates n-octanol H-bonding [14] | Different deactivating effect vs. methanol [14] | Significantly alters system α values [38] |
The solvation behavior of these modifiers in aqueous mixtures is complex. Studies using solvatochromic probes have demonstrated that mixtures often exhibit non-ideal behavior, where the probe experiences preferential solvation by one component or even a solvent "complex" rather than a simple combination of the two bulk solvents [38]. For instance, the addition of small amounts of 1,4-dioxane to methanol/water mixtures causes a significant variation in the π* parameter, whereas in dioxane-rich mixtures, a large effect on the hydrogen-bond donor acidity (α) is observed [38]. This preferential solvation directly influences a solute's retention behavior and must be considered when developing chromatographic methods.
Application in Lipophilicity Determination
Reversed-Phase High-Performance Liquid Chromatography (RP-HPLC)
RP-HPLC is a mainstay technique for log P determination, prized for its speed, broad application range (log P 0–6), and mild operating conditions [14]. The fundamental relationship is described by:
log P = a × log k + b
where k is the chromatographic capacity factor [14]. For higher accuracy, the organic modifier's influence can be accounted for by measuring the retention factor k at different modifier concentrations (φ) to extrapolate to a value in pure water, log kw:
log k = Sφ + log kw followed by log P = a × log kw + b [14]
Methanol is often considered an optimal modifier because it "does not affect the formation of hydrogen bonds in water and can interact with the stationary phase of the column to form a monolayer, providing hydrogen bonding effects similar to n-octanol" [14]. This makes it particularly suitable for generating bio-relevant lipophilicity data.
Reversed-Phase Thin-Layer Chromatography (RP-TLC)
RP-TLC serves as a simple, high-throughput alternative for lipophilicity estimation. The parameter RMW is interpreted as a log P value [31]. The technique employs non-polar stationary phases (e.g., RP-18, RP-8, RP-2) and the same organic modifiers—acetone, acetonitrile, methanol, and 1,4-dioxane—to create the mobile phase [31]. The choice of modifier and its volume fraction directly control the migration of analytes, allowing for the determination of lipophilicity parameters for diverse chemical structures, including neuroleptics and their potential new derivatives [31].
Experimental Protocols
RP-HPLC for Lipophilicity Determination (Log P)
This protocol is adapted from established methodologies for the rapid determination of lipophilicity [14].
Materials and Equipment
- HPLC System: Equipped with a pump, autosampler, and UV/Vis or MS detector.
- Column: C18 reversed-phase column (e.g., 150 mm x 4.6 mm, 5 μm).
- Mobile Phase: A: Water or aqueous buffer. B: Organic modifier (Methanol, Acetonitrile, or 1,4-Dioxane).
- Reference Compounds: A series of compounds with known log P values (see Table 2 for an example set).
- Test Compounds: Dissolved in a suitable solvent compatible with the mobile phase.
Procedure: Method 1 (Rapid Screening)
- System Calibration: Separately inject each reference compound under a consistent, isocratic mobile phase condition (e.g., 60% Organic Modifier B).
- Calculate Capacity Factors: For each reference, calculate the capacity factor, k = (tR - t0)/t0, where tR is the compound's retention time and t0 is the column void time.
- Generate Standard Curve: Plot the known log P values of the reference compounds against the logarithms of their calculated k values. Perform linear regression to obtain the standard equation: log P = a × log k + b [14].
- Analyze Test Compound: Inject the test compound under the identical chromatographic conditions.
- Determine log P: Calculate the log k for the test compound and use the standard equation to determine its log P value.
Procedure: Method 2 (High-Accuracy Determination)
- Multi-Condition Analysis: For each compound (reference and test), perform injections using at least three different isocratic mobile phase compositions (e.g., 50%, 60%, and 70% Organic Modifier B).
- Determine log kw: For each compound, plot log *k versus the volume fraction of the organic modifier, φ. Extrapolate the resulting line to φ = 0 (pure water) to obtain the intercept, log kw [14].
- Generate Standard Curve: Plot the known log P values of the reference compounds against their log kw values. Perform linear regression to obtain the standard equation: log P = a × log k*w + b [14].
- Determine log P: Calculate the log kw for the test compound and use this new standard equation to determine its highly accurate log P value.
RP-TLC for Lipophilicity Estimation
This protocol outlines the use of RP-TLC for estimating the lipophilicity of neuroleptics and other active substances [31].
Materials and Equipment
- TLC Plates: RP-18F~254~, RP-8F~254~, or RP-2F~254~.
- Mobile Phase: Binary mixtures of an organic modifier (Methanol, Acetonitrile, or 1,4-Dioxane) with water or buffer.
- Chromatography Chamber: Saturated with mobile phase vapor.
- Detection System: UV lamp or appropriate derivatization agent.
Procedure
- Sample Application: Spot solutions of test and standard compounds onto the baseline of the TLC plate.
- Chromatogram Development: Develop the chromatogram in a chamber saturated with the chosen mobile phase.
- Measure RF Values: After development and drying, measure the migration distance of each spot and the solvent front. Calculate the R~F~ value for each compound (R~F~ = distance traveled by compound / distance traveled by solvent front).
- Calculate R~M~ Value: Calculate the R~M~ value using the formula: R~M~ = log (1/R~F~ - 1).
- Determine Lipophilicity: The R~M~W value, which is the R~M~ value extrapolated to 0% organic modifier (or obtained from the relationship between R~M~ and modifier concentration), is interpreted as the experimental lipophilicity index [31].
Comparative Data and Modifier Selection
The choice of modifier can lead to systematic differences in determined lipophilicity. Table 2 provides a comparative overview of the three modifiers to guide selection.
Table 2: Modifier Comparison for Lipophilicity Determination
| Aspect | Methanol | Acetonitrile | 1,4-Dioxane |
|---|---|---|---|
| Typical Application | Gold standard for log P prediction; excellent for H-bonding analytes [14]. | High efficiency & resolution; often used for complex mixtures. | Used for specific selectivity, particularly for non-polar compounds. |
| Retention Strength (on C18) | Strong | Weaker than methanol | Very Strong |
| Viscosity in H~2~O Mixtures | Higher (can cause higher backpressure) | Lower | Moderate |
| UV Cutoff | ~205 nm | ~190 nm | ~215 nm |
| Bio-Relevance | High (simulates n-octanol H-bonding) [14]. | Moderate | Low |
| Advantages | - Better simulation of n-octanol/water system.- Often provides superior correlation with log P [14].- Low UV cutoff. | - Lower viscosity.- High efficiency (sharp peaks).- Different selectivity. | - Useful for dissolving very non-polar compounds.- Offers unique selectivity. |
| Disadvantages | - Higher backpressure.- Can strongly absorb on C18, changing column characteristics. | - Can give different retention order vs. methanol.- May not correlate as well with log P for some compound classes. | - High UV cutoff limits detection.- Toxic [37].- Weaker eluter for many polar compounds. |
The Scientist's Toolkit: Essential Research Reagents
Table 3: Key Reagents for Lipophilicity Determination via Chromatography
| Reagent / Material | Function / Explanation |
|---|---|
| C18 Reversed-Phase Column | The standard stationary phase for RP-HPLC, providing a non-polar surface for hydrophobic interactions. |
| RP-18F~254~ TLC Plates | The standard stationary phase for RP-TLC, offering a hydrophobic surface for lipophilicity estimation. |
| Methanol (HPLC Grade) | The preferred organic modifier for log P determination due to its hydrogen-bonding properties that mimic the n-octanol/water system [14]. |
| Reference Compound Set | A series of compounds with known, precisely measured log P values, used to construct the calibration curve (e.g., 4-Acetylpyridine, Acetophenone, Chlorobenzene, etc.) [14]. |
| n-Octanol and Water | Used for the shake-flask method, the gold standard for validating chromatographically-derived log P values [14]. |
Workflow and Decision Pathway
The following diagram summarizes the logical process for selecting and applying a modifier in chromatographic lipophilicity determination.
Figure 1: Experimental pathway for lipophilicity determination, highlighting the critical decision point of modifier selection.
The strategic selection of an organic modifier—methanol, acetonitrile, or 1,4-dioxane—is a critical determinant of success in chromatographic lipophilicity determination. Methanol stands out for its superior ability to mimic the n-octanol/water partitioning system, often yielding log P values with high biological relevance [14]. Acetonitrile offers practical advantages in efficiency, while 1,4-dioxane provides a tool for modulating selectivity, particularly in TLC applications [31] [38]. By understanding the distinct solvation properties and practical implications of each modifier, as detailed in this application note, researchers can make informed decisions that enhance the reliability and predictive power of lipophilicity data, thereby accelerating rational drug design and development.
Within drug discovery, accurately predicting a compound's behavior in a living system is a fundamental challenge. Traditional reversed-phase chromatography using C18 stationary phases has long been used to estimate lipophilicity, a property crucial for understanding a drug's absorption, distribution, metabolism, excretion, and toxicity (ADMET) [39]. However, the C18 surface, while valuable, is a poor mimic of the complex biological environment a drug encounters in vivo [40].
Biomimetic chromatography addresses this limitation by employing stationary phases that incorporate key biological molecules, such as immobilized artificial membranes (IAM) and human serum albumin (HSA) [40] [41]. These phases are designed to mimic the drug's interactions with phospholipid membranes and plasma proteins, providing chromatographic data with superior biological relevance. This application note, framed within a broader thesis on chromatographic methods for lipophilicity determination, details the principles, protocols, and applications of IAM and HSA stationary phases for researchers and drug development professionals.
The Biomimetic Toolbox: IAM and HSA
Biomimetic chromatography uses stationary phases containing proteins and phospholipids to simulate the biological environment where drug molecules distribute. The mobile phases are typically aqueous-organic mixtures buffered to a physiological pH of 7.4, further enhancing the biomimetic conditions [40]. The core premise is that a compound's calibrated retention on these phases reveals its affinity for proteins and phospholipids, which can be leveraged to model distribution and other key pharmacokinetic parameters [40] [13].
The two primary types of biomimetic stationary phases are:
- Immobilized Artificial Membranes (IAM): These phases contain phospholipids (most commonly phosphatidylcholine) covalently bound to a silica support [40] [41]. They model the dynamic partition of compounds into cell membranes, a critical step for passive diffusion, permeability, and access to intracellular targets [13] [42].
- Human Serum Albumin (HSA): HSA is the most abundant protein in human blood plasma [42]. Stationary phases with immobilized HSA are used to model plasma protein binding [40] [13]. Since only the unbound fraction of a drug is pharmacologically active, understanding HSA binding is essential for predicting efficacy and volume of distribution [13].
The following workflow illustrates the typical process for utilizing biomimetic chromatography in early drug development:
Key Advantages over Traditional Methods
Biomimetic chromatography offers several distinct advantages over the traditional shake-flask method for determining octanol/water partition coefficients (log P) [40] [14]:
- Biological Relevance: IAM and HSA phases provide a more realistic simulation of in vivo conditions compared to the octanol/water system or C18 phases, as they incorporate charged groups and offer shape selectivity [40].
- High-Throughput and Efficiency: Automated HPLC systems with gradient elution can characterize hundreds of thousands of compounds rapidly, generating data on lipophilicity, protein binding, and phospholipid binding in a single run [40] [13].
- Minimal Sample Requirements: The technique requires only small quantities of compound and is tolerant of impurities, as separation occurs during the analysis [40] [14].
- Reduced Animal Testing: By providing more predictive in vitro data, biomimetic chromatography helps prioritize the most promising compounds, reducing the number of animal experiments in the drug discovery process [40].
Experimental Protocols
This section provides detailed methodologies for characterizing compounds using IAM and HSA stationary phases.
Protocol 1: Measuring Phospholipid Binding Using IAM Phases
This protocol determines a compound's affinity for phospholipid membranes, which is instrumental in predicting permeability and volume of distribution [40] [13].
- Principle: A compound's retention on an IAM stationary phase is proportional to its distribution into the phospholipid layer. The retention factor (log k) or Chromatographic Hydrophobicity Index (CHI) is used to model membrane partitioning [13] [41].
- Equipment and Reagents:
- HPLC System: Capable of gradient elution.
- Column: IAM.PC.DD2 or IAM.PC.MG (e.g., 100 x 4.6 mm, 10 µm).
- Mobile Phase A: 50 mM ammonium acetate or phosphate-buffered saline (PBS), pH 7.4.
- Mobile Phase B: Acetonitrile.
- Void Time Marker: Sodium citrate, potassium iodide, or L-cystine [41].
- Procedure:
- System Equilibration: Equilibrate the column with 100% Mobile Phase A at a flow rate of 1.0 mL/min.
- Gradient Elution: Inject the sample (dissolved in DMSO or mobile phase) and run a fast linear gradient from 0% B to 100% B over 10-20 minutes.
- Data Analysis:
- Data Interpretation: Higher log k or CHI values indicate stronger binding to phospholipids. This data can predict blood-brain barrier penetration and intestinal permeability [40] [42].
Protocol 2: Determining Plasma Protein Binding Using HSA Phases
This protocol estimates a compound's binding to human serum albumin, a key parameter influencing free drug concentration and volume of distribution [13].
- Principle: The retention time of a compound on an HSA-bonded column is proportional to its affinity for the protein. The calibrated retention is converted to percent HSA binding or binding constant (log K) [13].
- Equipment and Reagents:
- HPLC System: Capable of gradient elution.
- Column: ChiralPak HSA (e.g., 100 x 4.0 mm).
- Mobile Phase A: 50 mM phosphate buffer, pH 7.4.
- Mobile Phase B: Isopropanol (preferred for protein phases to elute strongly bound compounds) [13].
- Procedure:
- System Equilibration: Equilibrate the column with 100% Mobile Phase A.
- Gradient Elution: Inject the sample and run a linear gradient from 0% B to 30-40% B over 10-15 minutes.
- Data Analysis:
- Measure the gradient retention time.
- Convert the retention time to percent HSA binding using a calibration curve constructed from reference compounds with known protein binding data [13].
- Data Interpretation: High retention and binding values indicate extensive plasma protein binding, which can reduce a drug's efficacy and alter its pharmacokinetic profile [13].
Applications and Data Correlation
The data obtained from IAM and HSA chromatography are not standalone metrics; their power is unlocked through the development of quantitative retention-activity relationships (QRARs) that predict in vivo outcomes [41].
Table 1: Key Applications of Biomimetic Chromatographic Data
| Biomimetic Measurement | Primary Application | Correlation with In Vivo/Physicochemical Properties |
|---|---|---|
| IAM Retention (log k/CHI) | Modeling passive permeability, distribution into tissues [40] [13] | Blood-brain barrier distribution, human volume of distribution (Vd) [40] [13] |
| HSA Binding (%) | Predicting plasma protein binding (PPB) [13] | Human and rat volume of distribution, drug efficiency [40] |
| Combined IAM & HSA Data | Comprehensive pharmacokinetic profiling [42] | Improved Vd models; positively charged compounds bind more to IAM, negatives to HSA [13] |
| Extended Biomimetic Phases | Specialized distribution and toxicity | Sphingomyelin (SPH) for nerve tissue; Phosphatidylethanolamine (PE) for lung tissue; prediction of phospholipidosis and cardiotoxicity [40] |
The following diagram synthesizes how interactions on biomimetic phases translate to predictions of a drug's journey in the body:
Advanced screening platforms now combine these phases. For instance, comprehensive two-dimensional liquid chromatography (LCxLC) with HSA in the first dimension and IAM in the second has been developed to simultaneously emulate the blood and intestinal mucosa compartments, providing a powerful tool for profiling intestinal absorption potential [42].
The Scientist's Toolkit: Research Reagent Solutions
Successful implementation of biomimetic chromatography relies on specific materials and reagents. The following table details the essential components.
Table 2: Essential Research Reagents and Materials for Biomimetic Chromatography
| Item | Function/Description | Examples & Notes |
|---|---|---|
| IAM HPLC Column | Models drug partitioning into phospholipid bilayers. | IAM.PC.DD2 (Regis Technologies); IAM.PC.MG. Select based on phospholipid type (e.g., PC, PE, SPH) for specific tissues [40] [41]. |
| HSA HPLC Column | Models drug binding to human serum albumin. | ChiralPak HSA (Chiral Technologies, Daicel) [40] [13]. |
| Biomimetic Mobile Phase Buffers | Provides physiological pH (7.4) and ionic strength. | 50 mM ammonium acetate (MS-compatible) or phosphate-buffered saline (PBS) [40] [41]. |
| Organic Modifiers | Elutes compounds from biomimetic stationary phases. | Acetonitrile (for IAM); Isopropanol (for HSA to elute strongly bound compounds) [13] [41]. |
| Void Time Markers | Determines the column dead time (t₀) for calculating k. | L-cystine, potassium iodide, or sodium citrate (select based on column and pH) [41]. |
| Calibration Compound Sets | Converts retention times to binding/distribution data. | A set of 10-15 drugs with known log P, %HSA binding, and IAM retention [14] [13]. |
Biomimetic chromatography with IAM and HSA stationary phases represents a significant advancement over traditional lipophilicity measurements. By providing a more physiologically relevant environment, these techniques deliver data that reliably predicts complex in vivo distribution processes, including permeability, plasma protein binding, and volume of distribution.
Integrating these high-throughput, information-rich profiles into the early stages of drug discovery enables a more efficient and rational selection of candidate molecules. This approach reduces late-stage attrition and guides the design of compounds with optimal ADMET properties, ultimately accelerating the development of safer and more effective therapeutics. For researchers focused on chromatographic methods for lipophilicity determination, mastering these biomimetic tools is indispensable for bridging the gap between in vitro analysis and in vivo outcome.
Lipophilicity, quantitatively expressed as the partition coefficient (log P), is a fundamental physicochemical property in drug development. It significantly influences a compound's absorption, distribution, metabolism, excretion, and toxicity (ADMET) profile [43]. Chromatographic techniques, particularly Reversed-Phase Thin-Layer Chromatography (RP-TLC) and High-Performance Liquid Chromatography (HPLC), are established tools for its determination. This application note details modern, high-throughput, and sustainable protocols for both methods, aligning with the principles of Green Analytical Chemistry (GAC) [44]. The drive towards sustainability in analytical chemistry emphasizes reducing hazardous solvent consumption and energy use, making these efficient protocols not only faster but also more environmentally responsible [44].
Experimental Protocols
High-Throughput Fast Gradient HPLC for Lipophilicity Screening
This protocol is designed for the rapid determination of lipophilicity for a large number of new chemical entities (NCEs) and is ideal for early-phase drug development.
2.1.1 Materials and Reagents
- Analytes: Standard solutions of compounds with known log P values for calibration (e.g., caffeine, acetaminophen) and the test drug candidates.
- Mobile Phase: LC-MS grade water with 0.1% formic acid (Mobile Phase A) and LC-MS grade acetonitrile (Mobile Phase B). Note: Formic acid is chosen for its MS compatibility and volatile nature, reducing environmental impact compared to non-volatile buffers [45] [44].
- Column: Short reversed-phase column (e.g., C18, 50 mm x 4.6 mm, 2.7 µm superficially porous particles). Superficially porous particles provide high efficiency at lower backpressures, enabling faster flow rates [46] [47].
2.1.2 Step-by-Step Procedure
- System Equilibration: Equilibrate the HPLC system with a mobile phase of 5% B at a flow rate of 1.5 mL/min for 1.0 minute.
- Scouting Gradient Run: Inject a test mixture of all analytes. Apply a fast, broad linear gradient from 5% to 100% B over 2.0 minutes.
- Data Analysis from Scouting Run: Determine the approximate organic modifier concentration (%B) at which the peak of interest elutes. The retention time (tR) is used to calculate the chromatographic hydrophobicity index (CHI).
- Isocratic Method Derivation (Optional): For maximum speed in potency assays, an isocratic method can be derived from the scouting run. Adjust the %B to achieve a retention factor (k) between 1 and 2 for the main analyte, resulting in run times of less than 2 minutes [45].
- High-Throughput Analysis: For ultimate throughput, employ a segmented flow injector or an autosampler with an overlapped injection cycle. This approach can achieve analysis times of 1 second per sample, allowing a 96-well plate to be analyzed in under 1.6 minutes [47].
The workflow for this method is summarized in the following diagram:
Green RP-TLC for Lipophilicity Determination
RP-TLC offers a remarkably low-solvent, high-throughput, and "green" alternative for lipophilicity screening, with the ability to analyze multiple samples simultaneously on a single plate [48] [43] [49].
2.2.1 Materials and Reagents
- Stationary Phase: Commercial RP-18 WF254s TLC plates.
- Mobile Phase: Binary mixtures of a water-miscible organic solvent (e.g., methanol or acetone) and water. Note: Methanol is generally preferred over acetonitrile for its lower toxicity and better green chemistry profile [44] [49].
- Analytes: Standard and sample solutions (0.5-1 mg/mL) dissolved in a volatile, semi-polar solvent like dichloromethane or methanol.
2.2.2 Step-by-Step Procedure
- Plate Pre-treatment: Pre-wash the RP-TLC plates by developing them in methanol to remove impurities. Activate the plates by heating in an oven at 110-120°C for 20-30 minutes [49].
- Sample Application: Using a capillary or automated applicator, apply samples as narrow bands (preferred for superior resolution) 8 mm from the bottom edge of the plate. A typical application volume is 0.5-2 µL [49].
- Chromatogram Development: Place the mobile phase (e.g., methanol-water mixtures in varying ratios) in a twin-trough chamber with a saturating pad. Allow 20 minutes for chamber saturation. Develop the plate until the solvent front has migrated 60-70 mm from the origin [48] [49].
- Drying and Visualization: After development, dry the plate thoroughly in a fume hood to remove solvent vapors. Visualize under UV light (254 nm or 366 nm) or using appropriate derivatization reagents [48] [49].
- Densitometric Analysis: Scan the plates with a TLC scanner to measure the retention factor, RF (distance traveled by substance / distance traveled by solvent front).
- Lipophilicity Calculation: Measure RF values for each compound in at least 5 different mobile phase compositions. The lipophilicity parameter (RMW) is determined by extrapolating the RM value (RM = log(1/RF - 1)) to zero organic modifier concentration using the Soczewiński-Wachtmeister equation: RM = RMW + bφ, where φ is the volume fraction of the organic modifier [43].
The workflow for the RP-TLC method is outlined below:
Results and Data Analysis
Comparative Method Performance
The following table summarizes the key characteristics of the two described methods, highlighting their suitability for different application scenarios.
Table 1: Comparison of Fast Gradient HPLC and RP-TLC for Lipophilicity Determination
| Parameter | Fast Gradient HPLC | RP-TLC |
|---|---|---|
| Throughput | Very High (1 s/sample with advanced injector) [47] | Extremely High (Multiple samples in parallel per plate) [48] |
| Typical Analysis Time | 1-2 minutes per sample (conventional); <2 min for a 96-well plate (segmented flow) [45] [47] | ~20 minutes for 10-20 samples (developed simultaneously) [49] |
| Solvent Consumption | Low (µL to mL per sample) [45] | Very Low (mL per entire plate) [48] [44] |
| Green Chemistry Score | Good (with solvent reduction and green solvent choices) [44] | Excellent (minimal solvent use, single-use plate) [48] [44] |
| Key Lipophilicity Parameter | Chromatographic Hydrophobicity Index (CHI) or log k | RMW (from Soczewiński-Wachtmeister eq.) [43] |
| Ideal Application | Rapid, automated screening of large compound libraries; hyphenation with MS [46] [47] | Low-cost, high-throughput initial screening; analysis of complex or impure samples without cleanup [48] [43] |
Lipophilicity Data for Drug Compounds
RP-TLC has been successfully applied to determine the lipophilicity of various drug classes. The table below presents exemplary RMW data, which serves as a robust chromatographic descriptor for lipophilicity.
Table 2: Exemplary Lipophilicity Data (RMW) for Selected Drugs Determined by RP-TLC [43]
| Drug Class | Compound Name | Approximate RMW (Methanol-Water) | Notes |
|---|---|---|---|
| Antiparasitic | Metronidazole | ~0.08 | Confirms highly hydrophilic nature [43] |
| Antiparasitic | Ornidazole | ~0.33 | Moderately hydrophilic |
| Antiparasitic | Tinidazole | ~0.35 | Moderately hydrophilic |
| NSAIDs | Ketoprofen | ~1.74 | Medium lipophilicity |
| NSAIDs | Indomethacin | ~2.62 | High lipophilicity |
| NSAIDs | Phenylbutazone | ~2.71 | High lipophilicity |
The Scientist's Toolkit
Table 3: Essential Research Reagent Solutions and Materials
| Item | Function & Application | Green & High-Throughput Considerations |
|---|---|---|
| Short C18 Column (e.g., 50 mm x 4.6 mm, 2.7 µm) | Core HPLC separation media; enables fast gradients and high flow rates, reducing analysis time. [45] [46] | Reduces solvent consumption per analysis. Smaller particle sizes enhance efficiency. |
| RP-18 WF254s TLC Plates | Stationary phase for RP-TLC; allows parallel separation of numerous samples. F254 indicates UV indicator for detection. [43] [49] | Single-use plates prevent cross-contamination, eliminating the need for column cleaning and saving time/solvents. [48] |
| Methanol (MeOH) & Acetonitrile (ACN) | Primary organic modifiers for RP-HPLC and RP-TLC mobile phases. | Methanol is often preferred over acetonitrile in a green context due to its lower toxicity and easier biodegradability. [44] |
| Segmented Flow / Droplet Microfluidic Injector | Advanced injection system that overcomes autosampler cycle time limitations. [47] | Enables ultra-high-throughput (1 s/sample), drastically increasing lab productivity and reducing operational costs. |
| Formic Acid (0.1%) | Common mobile phase additive in HPLC; improves peak shape and facilitates electrospray ionization in LC-MS. [45] | A volatile additive, it is more environmentally friendly and MS-compatible than non-volatile buffers (e.g., phosphate). |
| Automated TLC Sampler | Instrument for applying samples as precise bands onto TLC plates. | Improves reproducibility and throughput compared to manual spotting, aligning with high-throughput goals. [48] |
Discussion
The choice between Fast Gradient HPLC and RP-TLC for lipophilicity determination is not a matter of superiority but of strategic application. RP-TLC excels in maximum sample throughput and minimal solvent consumption per sample, making it an ideal first-line tool for screening large compound sets with minimal resource expenditure [48] [43]. Its single-use nature and high matrix tolerance are significant advantages. Fast Gradient HPLC, particularly when coupled with advanced injection technologies and mass spectrometry, provides unparalleled analysis speed, automation, and rich analytical data for each sample, which is crucial for informed decision-making in late-stage drug development [46] [47].
Both methods align with the growing imperative for sustainable analytical practices [44]. The significant reduction in solvent use and waste generation by these high-throughput protocols directly supports the principles of Green Sample Preparation (GSP) and Circular Analytical Chemistry (CAC), moving the field away from a linear "take-make-dispose" model [44].
Lipophilicity, the physicochemical property defining a molecule's affinity for a lipophilic environment, is a critical determinant of a drug candidate's pharmacokinetic and pharmacodynamic profile [31]. It directly influences absorption, distribution, metabolism, and excretion (ADME), impacting a compound's ability to reach its molecular target and its eventual toxicity [50] [51] [52]. In neuroleptic drugs, which act on the central nervous system, optimal lipophilicity is essential for blood-brain barrier penetration, making its accurate assessment vital during early-stage drug design and development [31].
Chromatographic methods offer significant advantages over the traditional "shake-flask" technique. They are less laborious, require smaller amounts of compound, and provide high-throughput analysis, making them indispensable in modern pharmaceutical research [50] [53]. This application note details a hybrid approach, combining computational and chromatographic techniques, for reliable lipophilicity profiling of neuroleptics and other complex molecules, framed within a broader research context on chromatographic method development.
Case Study: Lipophilicity Determination of Selected Neuroleptics
Background and Objective
Classical neuroleptics, such as fluphenazine, triflupromazine, trifluoperazine, flupentixol, and zuclopenthixol, are chemically diverse heterocyclic compounds containing nitrogen [31]. While effective, their long-term use can cause adverse effects, driving the need for rapid methods to analyze the ADMET profiles of both existing drugs and new candidate molecules [31]. A recent study aimed to assess and compare a hybrid procedure utilizing both computational methods and experimental reverse-phase thin-layer chromatography (RP-TLC) for the rapid estimation of the lipophilicity of these neuroleptics and their potential new derivatives [31] [16].
Experimental Protocol: A Hybrid Approach
The following workflow outlines the comprehensive hybrid strategy employed for lipophilicity profiling.
Computational logP Prediction
- Objective: To obtain theoretical lipophilicity parameters (logP) using diverse algorithms.
- Software & Platforms: Utilize multiple software platforms and algorithms to predict logP values. The study employed: AlogPs, ilogP, XlogP3, WlogP, MlogP, milogP, logPsilicos-it, logPconsensus, logPchemaxon, and logPACD/Labs [31] [16].
- Procedure:
- Draw the chemical structures of the target neuroleptics (e.g., fluphenazine, triflupromazine) and their derivatives using a molecular editing tool.
- Input the structures into each software platform.
- Record the calculated logP value from each algorithm.
- Note: The use of multiple algorithms is crucial due to the significant variations that can arise from different calculation methodologies (atomic, fragment-based, property-dependent) [53] [52].
Experimental RP-TLC Determination
- Objective: To determine the experimental lipophilicity parameter (RₘW) using Reverse-Phase Thin-Layer Chromatography.
- Materials:
- Chromatographic Procedure:
- Prepare solutions of the studied compounds in a volatile solvent at a concentration of 2 µM/mL.
- Spot the solutions on the RP-TLC plates.
- Develop the plates in a chromatographic chamber saturated with vapor from the mobile phase. Use a series of mobile phase compositions with varying volumes of organic modifier (e.g., 50:50, 55:45, 60:40, 65:35, 70:30 acetone-TRIS buffer) [52].
- After development and drying, detect the spots under UV light (254 nm).
- Calculate the retention factor (R𝐹) for each compound: R𝐹 = Distance traveled by compound / Distance traveled by solvent front.
- Calculate the Rₘ value: Rₘ = log(1/R𝐹 - 1).
- Data Analysis:
- For each compound and chromatographic system, plot Rₘ values against the concentration (C) of the organic modifier in the mobile phase.
- The Rₘ value extrapolated to zero organic modifier concentration (Rₘ⁰) is interpreted as a lipophilicity index.
- The specific hydrophobic surface area (b) is derived from the slope of the Rₘ vs. C plot [52].
Key Research Reagent Solutions
Table 1: Essential materials and reagents for lipophilicity profiling.
| Item | Function/Description | Application in Protocol |
|---|---|---|
| RP-18F₂₅₄ Plates | Non-polar stationary phase; octadecyl-silylated silica gel. | Primary matrix for partitioning in RP-TLC; simulates interaction with biological membranes [31]. |
| Acetone / Acetonitrile | Organic modifiers for mobile phase. | Adjusts elution strength of mobile phase to modulate compound retention [31] [52]. |
| TRIS Buffer (pH 7.4) | Aqueous component of mobile phase. | Maintains physiologically relevant pH during analysis [52]. |
| AlogPs / XlogP3 Software | Algorithms for calculating partition coefficient (logP). | Provides in silico lipophilicity estimates for initial screening and comparison [31]. |
Results and Discussion
The hybrid approach provided a robust dataset for comparing the lipophilicity of the neuroleptics. The results confirmed that RP-TLC is an efficient tool for lipophilicity prediction, with the Rₘ⁰ parameter serving as a reliable experimental index [31].
Table 2: Comparison of lipophilicity determination methods for neuroleptics and other complex molecules.
| Compound Class | Key Computational Findings | Key Chromatographic Findings | Overall Conclusion |
|---|---|---|---|
| Neuroleptics [31] | Significant variation in calculated logP values across different algorithms. | Optimal chromatographic conditions identified using RP-2, RP-8, RP-18 plates and acetone/acetonitrile/1,4-dioxane modifiers. | Hybrid method provides a confident proposal for optimal conditions. Topological indices correlate with lipophilicity. |
| Antifungal Isoxazolones [50] | PCA indicated other features beside lipophilicity affect antifungal activity. | Chromatographic approach (RP-TLC, RP-HPLC, MEKC) was ranked as the best method for lipophilicity assessment. | Structure with lowest lipophilicity in the series retained biological activity, ideal for further development. |
| Quaternary (Fluoro)Quinolones [53] | Huge discrepancies in calculated logP (e.g., -5.08 to 3.57 for the same compound). | New hybrid quinolones were less lipophilic than parent compounds. RP-TLC data suitable for QRAR models. | Experimental approach is necessary for this charged antibiotic class; computational methods unreliable alone. |
Furthermore, the study demonstrated for the first time the application of selected topological indices (e.g., Wiener, Gutman, Randić) in determining the lipophilicity and ADMET parameters of neuroleptics [31]. These indices, calculated based on the molecular graph's distance and adjacency matrices, showed significant correlations with the lipophilicity factors, providing an additional computational tool for predicting the properties of newly designed derivatives.
Broader Applications and Protocol Validation
The methodology outlined for neuroleptics is applicable to other complex molecules. For instance, in a study on antifungal isoxazolo[3,4-b]pyridine-3(1H)-ones, chemometric analyses confirmed that chromatographic methods should be considered the best approach for lipophilicity assessment, outperforming computational methods alone [50]. Similarly, for quaternary (fluoro)quinolones, significant discrepancies between calculated logP values highlighted the necessity of experimental verification, particularly for permanently charged molecules [53]. Chromatographic data successfully established Quantitative Retention-Activity Relationship (QRAR) models to predict antimicrobial activity.
This application note demonstrates that a hybrid approach, integrating multiple in silico models with robust RP-TLC protocols, provides a reliable and efficient strategy for lipophilicity profiling. For neuroleptics and other complex molecules, particularly those with charged groups or specific heterocyclic systems, experimental chromatographic determination remains essential to validate and complement computational predictions. This comprehensive profiling is crucial for guiding the rational design of new drug candidates with optimized ADMET properties.
Solving Common Challenges: Ion Pairing, High logP, and Data Accuracy
In drug discovery, lipophilicity is a fundamental physicochemical property that profoundly influences a compound's absorption, distribution, metabolism, excretion, and toxicity (ADMET). For ionizable compounds—which constitute approximately 95% of pharmaceuticals—lipophilicity cannot be described by a single value but is highly dependent on the ionization state of the molecule, which in turn is governed by the pH of the environment [54]. The distribution coefficient (logD) incorporates this pH-dependent ionization, providing a more physiologically relevant measure of lipophilicity compared to the partition coefficient (logP), which describes only the neutral species [54] [55]. Chromatographic techniques, particularly reversed-phase liquid chromatography (RPLC), have emerged as powerful tools for determining these lipophilicity parameters, as the retention mechanisms directly reflect the partitioning behavior of compounds between aqueous and hydrophobic phases, mimicking biological barriers [26]. This application note details the critical theoretical relationships and provides robust experimental protocols for investigating and applying the interconnected effects of pH, pKa, and lipophilicity in chromatographic analysis.
Theoretical Foundations
Defining logP, logD, and pKa
- logP: The partition coefficient (logP) is the logarithm of the ratio of the concentration of a neutral compound in n-octanol to its concentration in water. It is a constant for a given molecule, independent of pH [26] [56].
- logD: The distribution coefficient (logD) is the logarithm of the ratio of the sum of the concentrations of all species of a compound (both ionized and unionized) in n-octanol to the sum in water. Unlike logP, logD is pH-dependent [56].
- pKa: The acid dissociation constant (pKa) describes the pH at which half of the molecules of a functional group are ionized. It determines the ionization state of a compound at a given pH [54] [55].
The Mathematical Relationship Between logD, logP, and pKa
For ionizable compounds, logD can be theoretically calculated from logP and pKa. The equations differ for acids and bases [55] [26]:
- For monoprotic acids:
logD = logP - log(1 + 10^(pH - pKa)) - For monoprotic bases:
logD = logP - log(1 + 10^(pKa - pH))
These equations show that when the pH is far from the pKa (favoring the neutral form), logD approximates logP. Conversely, when the pH favors ionization, logD decreases [55]. The following table summarizes how pH relative to pKa affects the ionization state and lipophilicity of acidic and basic compounds.
Table 1: The Impact of pH on Ionization State and logD for Acids and Bases
| Compound Type | pH << pKa | pH = pKa | pH >> pKa |
|---|---|---|---|
| Acid | Predominantly neutral (protonated)logD ≈ logP | 50% ionizedlogD = logP - log(2) | Predominantly ionized (deprotonated)logD ≈ logP - (pH - pKa) |
| Base | Predominantly ionized (protonated)logD ≈ logP - (pKa - pH) | 50% ionizedlogD = logP - log(2) | Predominantly neutral (deprotonated)logD ≈ logP |
Chromatographic Retention as a Surrogate for Lipophilicity
Chromatographic retention models the partitioning of analytes between a mobile phase and a stationary phase. For neutral compounds, retention primarily correlates with logP. For ionizable compounds, retention becomes a function of logD, which is controlled by the mobile phase pH and the analyte's pKa [26]. The fundamental relationship can be described as:
Retention = f(logD(pH, pKa))
This principle is leveraged in techniques like Ion-Pair Reversed-Phase Liquid Chromatography (IP-RPLC), where an ion-pairing reagent is added to the mobile phase to modulate the retention of charged analytes. The reagent's lipophilic tail and charged head-group can form neutral "ion pairs" with oppositely charged analytes, allowing their separation on standard reversed-phase columns [57]. The retention mechanism can be explained by several models, including the ion-pairing model (complex forms in mobile phase) and the ion-exchange model (reagent adsorbs to stationary phase, creating a dynamic ion-exchange surface) [57].
Experimental Protocols
Protocol 1: Determining logD and pKa via Potentiometric Titration
This method determines pKa and logP/logD by monitoring pH changes during a titration, from which logD at any pH can be calculated.
Research Reagent Solutions:
- n-Octanol: High-purity grade, pre-saturated with aqueous buffer.
- Buffer Solutions: A series of standardized buffers covering a broad pH range (e.g., 1-12).
- Titrants: Standardized solutions of potassium hydroxide (KOH) and hydrochloric acid (HCl).
- Ion-Pairing Reagents (Optional): Trifluoroacetic acid (for bases) or tetraalkyl ammonium salts (for acids) to study ion-pairing effects [57].
Procedure:
- Sample Preparation: Dissolve a precise amount of the analyte in a mixture of n-octanol and aqueous buffer, pre-saturated with each other.
- Titration: Place the sample in a jacketed titration vessel maintained at constant temperature (e.g., 25°C). Stir continuously.
- Data Acquisition: Titrate the solution with standardized KOH or HCl while monitoring the pH with a calibrated combination electrode.
- Data Analysis: Use specialized software to analyze the titration curve. The software will fit the data to determine the macroscopic pKa values and the partition coefficients for the neutral and ionic species.
- logD Calculation: Once pKa and logP are known, the logD profile across the entire pH range can be generated using the equations in Section 2.2.
Protocol 2: Investigating pH-Dependent Retention Using Reversed-Phase HPLC
This protocol uses chromatographic retention times at different pH values to construct a logD profile.
Research Reagent Solutions:
- Mobile Phase Buffers: Prepare a series of buffers (e.g., phosphate, acetate) covering the pH range of 2 to 8 (considering column stability). Use the same buffer strength and organic modifier concentration for all pH levels.
- Stationary Phase: A reversed-phase C18 column certified for use over the intended pH range.
- Organic Modifier: HPLC-grade acetonitrile or methanol.
- Reference Compounds: A set of uncharged compounds with known logP values for system calibration.
Procedure:
- System Equilibration: For each pH condition, equilibrate the HPLC system with the respective mobile phase until a stable baseline is achieved.
- Sample Injection: Inject the analyte and record the retention time (tₐ). Also, inject an unretained marker to determine the column dead time (t₀).
- Retention Factor Calculation: Calculate the retention factor (k) at each pH:
k = (tₐ - t₀) / t₀. - Profile Generation: Plot log(k) versus pH. The resulting curve will mirror the compound's logD-pH profile, showing decreased retention in pH regions where the compound is ionized.
- Data Fitting: Fit the plotted data to the appropriate logD equation (from Section 2.2) to extract apparent pKa and logP values. Note: These are "chromatographic pKa" values and may differ slightly from potentiometric values due to the chromatographic environment.
Protocol 3: Measuring Lipophilicity of Charged Molecules via Ion-Pair Chromatography
For permanently charged or highly polar ions, standard RPLC offers little retention. IP-RPLC is used to make these analytes amenable to reversed-phase separation.
Research Reagent Solutions:
- Ion-Pairing Reagents:
- For Cations: Alkylsulfonates (e.g., sodium hexanesulfonate) or alkylsulfates.
- For Anions: Tetraalkylammonium salts (e.g., tetrabutylammonium phosphate) or trialkylamines.
- Mobile Phase: Consists of an aqueous buffer at a controlled pH, containing the ion-pairing reagent (typically 0.5-20 mM), and an organic modifier (e.g., acetonitrile).
- Stationary Phase: Standard C8 or C18 column.
Procedure:
- Reagent Selection: Choose an ion-pairing reagent with a charge opposite to that of your analyte and a hydrocarbon chain length that provides adequate retention.
- System Equilibration: Equilibrate the column with the mobile phase containing the ion-pairing reagent. This process can be slow; ensure baseline stability before proceeding.
- Separation Optimization: Inject the analyte and adjust key parameters to optimize separation:
- Ion-Pair Reagent Concentration: Higher concentrations generally increase retention of oppositely charged analytes.
- Organic Modifier: Increase gradient to elute strongly retained peaks.
- Mobile Phase pH: Adjust to ensure the analyte and reagent are in their ionized states.
- LogD Estimation: The retention time of the ion-paired complex under optimized conditions can be correlated with its effective lipophilicity.
Data Presentation and Analysis
The following table provides a comparative overview of key parameters and their experimental determination methods, crucial for data interpretation.
Table 2: Key Physicochemical Parameters and their Chromatographic Correlates
| Parameter | Definition | pH Dependence | Primary Chromatographic Correlate |
|---|---|---|---|
| logP | Partition coefficient of the neutral species | No | Retention factor (k) in RPLC at a pH where the compound is fully neutral. |
| pKa | pH at which 50% of a group is ionized | No (constant for a group) | pH at the inflection point in a plot of retention factor (k) vs. mobile phase pH. |
| logD | Distribution coefficient of all species | Yes | Retention factor (k) in RPLC at a specific pH. |
| Chromatographic Hydrophobicity Index | Measured retention in a standardized system | Yes | Elution time or volume under defined conditions; a direct experimental proxy for logD. |
Visualizing the Workflow and Relationships
The following diagram illustrates the logical and experimental workflow for determining lipophilicity parameters, integrating the concepts and protocols described.
The Scientist's Toolkit
Table 3: Essential Research Reagent Solutions for logD and pKa Studies
| Reagent / Material | Function / Application | Key Considerations |
|---|---|---|
| n-Octanol & Buffer | Solvent system for shake-flask and potentiometric logD determination. | Must be pre-saturated with each other to avoid phase volume changes [26]. |
| HPLC Buffers (e.g., Phosphate, Acetate) | Control pH in the mobile phase for RPLC studies. | Must have low UV cutoff and be compatible with MS detection if used. Buffer capacity must be sufficient. |
| Ion-Pairing Reagents (e.g., TFA, Alkylamines, Alkylsulfonates) | Modulate retention of charged analytes in IP-RPLC. | Choice of reagent (chain length, concentration) and pH is critical for optimal retention and selectivity [57] [58]. |
| C18/C8 Stationary Phases | The hydrophobic surface for reversed-phase separations. | Select a column stable across the desired pH range. |
| pH Meter and Electrode | Accurate measurement of pH in buffers and during titrations. | Requires regular calibration with standard buffers for reliable results. |
A thorough understanding of the interplay between pH, pKa, and lipophilicity is indispensable in modern drug discovery. logD provides a more accurate and physiologically relevant measure of lipophilicity compared to logP. Chromatographic methods, ranging from simple pH-dependent RPLC to more specialized techniques like IP-RPLC, offer robust, high-throughput experimental pathways to characterize these critical parameters. The protocols and frameworks outlined in this application note provide researchers with the tools to accurately determine logD profiles, thereby enabling better prediction of a compound's ADMET properties and ultimately guiding the optimization of drug candidates with favorable pharmacokinetic profiles.
Strategies for Accurately Profiling Highly Lipophilic Compounds (logP > 5)
Lipophilicity, quantified as the partition coefficient (log P), is a fundamental physicochemical property that significantly influences the absorption, distribution, metabolism, and excretion (ADME) of potential drug candidates [26]. For highly lipophilic compounds (log P > 5), accurate lipophilicity determination becomes particularly challenging yet critically important. These compounds often suffer from poor aqueous solubility, which can lead to unreliable results with traditional methods and increased risk of pharmacokinetic failure during drug development [14] [59]. This application note, situated within a broader thesis on chromatographic methods for lipophilicity determination, outlines robust strategies and detailed protocols for the accurate profiling of highly lipophilic compounds. We focus on leveraging reversed-phase liquid chromatography (RPLC) techniques, which offer distinct advantages for analyzing challenging, lipophilic molecules [14] [13].
Key Methodologies for Lipophilicity Determination
The determination of log P for highly lipophilic compounds requires methods that extend beyond the capabilities of the traditional shake-flask technique, which is often limited to a log P range of approximately -2 to 4 and is poorly suited for compounds with extremely low water solubility [14] [59]. Chromatographic methods, particularly RPLC, have emerged as powerful alternatives due to their rapidity, insensitivity to impurities, and wider applicable range [14] [26].
Table 1: Comparison of Log P Determination Methods for Highly Lipophilic Compounds
| Method | Principle | Typical Log P Range | Key Advantages | Key Limitations |
|---|---|---|---|---|
| Shake-Flask [14] | Direct partitioning between n-octanol and water | -2 to 4 | Considered the gold standard; accurate results | Time-consuming; requires high purity and solubility; limited range |
| Computational Prediction [14] [59] | In silico calculation based on algorithms | Broad (theoretical) | Fast and cost-effective | Accuracy depends on the model and training set; can vary significantly between software |
| RP-TLC [31] | Partition between a non-polar stationary phase and a mobile phase | Varies with system | Simple, rapid; multiple samples can be run simultaneously | Less precise than HPLC methods |
| RP-HPLC (Isocratic/Gradient) [14] [13] | Partition between a hydrophobic stationary phase and a mobile phase | 0 to 6+ | Rapid; handles impure samples; broad applicable range; automatable | Requires calibration with standards; may be influenced by specific molecular conformations [59] |
| RP-HPLC (with log kw) [14] | Extrapolation of retention time to 0% organic modifier | 0 to 6+ | Higher accuracy; accounts for the effect of organic modifier | More complex and time-consuming than simple gradient methods |
For highly flexible compounds, it is crucial to note that different RPLC methods might yield varying log P values. These discrepancies can arise because chromatographic conditions (e.g., isocratic vs. gradient mode, methanol/water ratio) may stabilize specific molecular conformations in solution, each with its own apparent lipophilicity [59]. Therefore, RPLC methods should be considered a tool for estimating a range of log P for such flexible, highly lipophilic molecules [59].
Detailed Experimental Protocols
Protocol 1: Rapid RP-HPLC Screening Method (Method 1)
This protocol is designed for high-throughput log P estimation in early drug discovery, providing a good balance between speed and accuracy for ranking compounds [14].
3.1.1 Research Reagent Solutions Table 2: Essential Materials for RP-HPLC Protocols
| Item | Function/Description |
|---|---|
| HPLC System | Quaternary low-pressure gradient system capable of running gradients, with a UV or diode array detector. |
| C18 Column | Reversed-phase column (e.g., 150 mm x 4.6 mm, 5 µm particle size). |
| Reference Compounds | A set of compounds with known log P values for calibration. See Table 3 for examples. |
| Mobile Phase A | 25 mM Ammonium acetate buffer (pH 7.2) or water. |
| Mobile Phase B | Acetonitrile (HPLC grade). |
| Test Compounds | Highly lipophilic compounds (log P > 5) dissolved in an appropriate solvent like DMSO or acetonitrile. |
3.1.2 Procedure
- System Preparation: Equilibrate the HPLC system and the C18 column with a mobile phase of 70:30 (v/v) Water/Acetonitrile.
- Calibration:
- Inject the individual reference compounds (Table 3) and record their retention times (tR).
- Calculate the capacity factor for each standard: log k = log[(tR - t0) / t0], where t0 is the column dead time, typically determined by injecting an unretained compound like sodium nitrate [32].
- Plot the known log P values of the standards against their calculated log k values.
- Perform linear regression to obtain the standard equation: log P = a × log k + b [14].
- Sample Analysis:
- Inject the test compound and record its retention time under the same chromatographic conditions.
- Calculate the log k value for the test compound.
- Substitute this log k value into the standard equation to determine its log P.
3.1.3 Critical Notes
- This method can typically determine log P values for compounds with retention times corresponding to log P below 6 within 30 minutes [14].
- The correlation coefficient (R²) of the standard curve should be ≥ 0.97 to ensure reliability [14].
Protocol 2: High-Accuracy RP-HPLC Method (Method 2)
This protocol is recommended for later stages of development where greater accuracy is required. It eliminates the direct effect of the organic modifier on retention by extrapolating to 0% organic solvent [14].
3.2.1 Procedure
- System Preparation: Use the same system and column as in Protocol 1.
- Calibration with Multiple Gradients:
- For each reference compound, perform injections using at least three different isocratic mobile phases or gradient programs with varying methanol (or acetonitrile) content (φ) [14].
- For each compound, plot the log k values obtained against the organic modifier concentration (φ).
- The intercept of this plot is the log kw value, which is the theoretical capacity factor in a pure aqueous mobile phase [14].
- Standard Curve Generation:
- Plot the known log P values of the reference standards against their determined log kw values.
- Perform linear regression to obtain the high-accuracy standard equation: log P = a × log kw + b [14].
- Sample Analysis:
- Determine the log kw value for the test compound by following the same multi-gradient procedure.
- Substitute the log kw value into the new standard equation to calculate an accurate log P.
3.2.3 Critical Notes
- This method is more time-consuming (can take 2-2.5 hours per compound) but offers significantly improved predictive ability, with R² values potentially exceeding 0.99 [14].
- Methanol is often preferred as the organic modifier because it does not significantly affect hydrogen bonding in water and can form a monolayer on the stationary phase, providing interactions more similar to n-octanol [14].
Table 3: Example Reference Compounds for Calibration [14]
| Compound Name | Reported Log P |
|---|---|
| 4-Acetylpyridine | 0.5 |
| Acetophenone | 1.7 |
| Chlorobenzene | 2.8 |
| Ethylbenzene | 3.2 |
| Phenanthrene | 4.5 |
| Triphenylamine | 5.7 |
Workflow and Data Analysis
The following diagram illustrates the strategic decision-making process for profiling highly lipophilic compounds, integrating the protocols described above.
Strategic Workflow for Profiling Highly Lipophilic Compounds
Data Interpretation and Reporting
For highly lipophilic and flexible compounds, a single log P value may be insufficient. As observed in a study on phenylalkanoic acids and pro-perfumes, different RPLC methods can yield log P variations due to conformational changes induced by the chromatographic conditions [59]. In such cases, it is scientifically rigorous to report a range of log P values obtained from different methods, providing a more realistic representation of the compound's behavior [59].
Accurate lipophilicity profiling of highly lipophilic compounds (log P > 5) is essential for de-risking drug discovery and development. While the shake-flask method has limitations for these compounds, RP-HPLC provides a robust, reliable, and efficient alternative. The two detailed protocols offered here cater to different stages of the research pipeline: a rapid method for high-throughput screening and a more accurate, time-intensive method for advanced development. Researchers should be aware that molecular flexibility can lead to a range of apparent log P values, and reporting this range can be more informative than a single number. By integrating these chromatographic strategies, scientists can significantly improve the quality of their physicochemical property data, leading to better-informed candidate selection and optimization.
Lipophilicity, quantified as the partition coefficient (Log P) or distribution coefficient (Log D), is a fundamental physicochemical property in drug discovery and development. It significantly influences a compound's absorption, distribution, metabolism, and excretion (ADME) profile, ultimately affecting its biological activity and potential for success as a therapeutic agent [26]. Accurate determination of lipophilicity is therefore crucial, and liquid chromatography, particularly reversed-phase high-performance liquid chromatography (RP-HPLC and RP-UHPLC), has become a cornerstone technique for its reliable and high-throughput measurement [26] [6]. This application note, framed within broader thesis research on chromatographic methods for lipophilicity determination, provides detailed protocols and guidelines for optimizing two critical chromatographic parameters: mobile phase pH and column selection. These factors directly impact the reliability of lipophilicity measurements by controlling the ionization state of analytes and the nature of their interaction with the stationary phase.
Theoretical Background and Relevance
Chromatographic determination of lipophilicity is based on the correlation between a compound's retention factor (logk) and its Log P [26] [6]. The process involves a dynamic equilibrium of the analyte between a mobile aqueous phase and a hydrophobic stationary phase, mimicking its partitioning between biological aqueous environments and lipid membranes [26]. The mobile phase pH is a critical parameter because it determines the ionization state of ionizable compounds. A shift in pH can dramatically alter a molecule's apparent lipophilicity, as charged species are significantly less lipophilic than their neutral forms. This is formally described by the distribution coefficient (Log D), which accounts for the pH-dependent ionization [26].
Similarly, column selection, specifically the chemistry of the stationary phase, dictates the primary mechanisms of interaction (e.g., hydrophobic, π-π, dipole-dipole) and the overall retention and selectivity of the separation [60] [6]. The correct combination of pH and stationary phase is essential for generating accurate, reproducible, and predictive lipophilicity data that can be effectively used in Quantitative Structure-Retention Relationship (QSRR) studies and for forecasting a compound's behavior in biological systems [6].
Experimental Protocols
Protocol 1: Systematic Scouting of Mobile Phase pH
This protocol describes a method for evaluating the lipophilicity of ionizable compounds across a relevant pH range to determine the optimal chromatographic conditions and estimate the Log D.
I. Materials and Equipment
- HPLC/UHPLC System: Equipped with a quaternary or binary pump, autosampler, column thermostat, and diode-array detector (DAD) or mass spectrometer (MS).
- Columns: A single, robust reversed-phase column (e.g., C18 with high pH stability) [60].
- Mobile Phase A: Aqueous buffers (e.g., 20-50 mM phosphate or ammonium formate/acetate) at various pH values (e.g., pH 2.5, 4.0, 7.0, 9.0, 10.5). Note: Ensure the buffer pH is adjusted before adding organic solvent.
- Mobile Phase B: Organic modifier (e.g., acetonitrile or methanol).
- Analytes: Standard solutions of test compounds (e.g., 0.1-1.0 mg/mL in a compatible solvent).
II. Procedure
- Buffer Preparation: Precisely prepare and pH-adjust the aqueous buffers for Mobile Phase A. Filter through a 0.22 µm membrane.
- System Setup: Equilibrate the LC system and the selected column with the initial mobile phase (e.g., pH 2.5 buffer and organic modifier).
- Gradient Elution Method:
- Detection: UV-Vis or MS as appropriate.
- Column Temperature: 25-40°C.
- Injection Volume: 1-10 µL.
- Use a linear gradient from 5% to 95% Mobile Phase B over 10-20 minutes.
- Data Acquisition: Inject the analyte mixture and record the chromatograms. Repeat the analysis using the same gradient profile but with Mobile Phase A at different pH values.
- Data Analysis:
- Calculate the retention factor (logk) for each analyte at each pH. The capacity factor is typically calculated as k = (tR - t0)/t0, where tR is the analyte retention time and t0 is the column dead time.
- Plot logk versus pH for each analyte. The resulting curve will show a plateau region for the neutral form and a shift where the compound ionizes.
- The retention time of the neutral species (from the plateau) can be used to estimate Log P, while the shift allows for pKa estimation [26].
Protocol 2: Evaluating Stationary Phase Selectivity for Lipophilicity Determination
This protocol assesses how different stationary phases influence the retention and lipophilicity assessment of a diverse set of compounds.
I. Materials and Equipment
- HPLC/UHPLC System: As in Protocol 1.
- Columns: A set of columns with different stationary phases (e.g., C18, C8, Phenyl, HILIC, Biphenyl) [60] [6].
- Mobile Phase: A fixed binary mixture (e.g., Acetonitrile/Water or Methanol/Water) with a constant, analyte-appropriate pH buffer.
- Analytes: A mixture of standard compounds with varied functionalities (acidic, basic, neutral, aromatic).
II. Procedure
- System Equilibration: Equilibrate the first column (e.g., C18) with the isocratic mobile phase composition determined to provide reasonable retention (e.g., 50% acetonitrile). The exact composition may require preliminary scouting.
- Isocratic Analysis:
- Run the analyte mixture under isocratic conditions.
- Record the retention times for all analytes.
- Column Comparison: Repeat the isocratic analysis using the same mobile phase composition on each different stationary phase column.
- Data Analysis:
- For each column, calculate the logk value for every analyte.
- Construct a table comparing logk values across all columns for all analytes.
- Perform linear regression analysis to correlate the chromatographic logk from each column with computational Log P values (e.g., ConsensusLog P from software like SwissADME) [6]. The stationary phase yielding the highest correlation coefficient (R²) for a given class of compounds is often optimal for lipophilicity determination.
The following workflow integrates these protocols into a coherent strategy for method development:
Results and Data Presentation
Recent studies highlight how different stationary phases can be selected based on the analyte's chemical properties.
Table 1: Influence of Stationary Phase on Lipophilicity Assessment of Different Compound Classes
| Analyte Class | Studied Compounds | Stationary Phases Tested | Key Finding | Source |
|---|---|---|---|---|
| Steroid Derivatives | Androstane-3-oxime derivatives | C18, C8, Phenyl | C18 provided the strongest retention and best correlation with in silico LogP for these lipophilic compounds. The Phenyl phase offered alternative selectivity via π-π interactions. | [6] |
| Neuroleptics | Fluphenazine, Trifluoperazine, etc. | RP-TLC: RP-2, RP-8, RP-18 | RP-18 phases provided the most reliable lipophilicity parameters (RMW) for these pharmaceuticals compared to less hydrophobic phases. | [31] [61] |
| Small Molecules / Peptides | General purpose, basic compounds | C18, Biphenyl, HILIC | Biphenyl phases offer mixed-mode retention (hydrophobic, π-π) for isomer separation. Inert C18 phases improve peak shape for metal-sensitive/chelating analytes. | [60] |
The Scientist's Toolkit: Essential Research Reagents and Materials
Selecting the right materials is fundamental to success. The following table details key solutions and tools used in this field.
Table 2: Key Research Reagent Solutions for Lipophilicity Determination by LC
| Item | Function / Description | Examples & Selection Criteria |
|---|---|---|
| Stationary Phases | The solid support that interacts with analytes, defining retention and selectivity. | C18: Gold standard for general lipophilicity [6]. Phenyl: For compounds with aromatic rings via π-π interactions [6]. Biphenyl: Enhanced π-π and dipole interactions for isomers [60]. Inert Columns: With passivated hardware for metal-sensitive analytes [60]. |
| Organic Modifiers | A component of the mobile phase that controls elution strength. | Acetonitrile: Strong eluting strength, low viscosity. Methanol: Weaker eluting strength, alternative selectivity. 1,4-Dioxane/Acetone: Used in RP-TLC for lipophilicity measurement [31]. |
| Aqueous Buffers | A component of the mobile phase that controls pH and ionic strength. | Ammonium Formate/Acetate (pH ~3-5): For MS compatibility. Phosphate Buffers (pH ~2-8): For wide UV transparency. Ammonium Bicarbonate (pH ~7-9): For neutral to basic pH. |
| In silico Tools | Software for predicting properties and planning experiments. | SwissADME, pkCSM: For predicting Log P and other ADME parameters to guide experiments and validate results [26]. ACD/Labs, ChemAxon: Provide various algorithms (e.g., AlogPs, XlogP3) for Log P prediction [31]. |
Discussion and Concluding Remarks
Optimizing chromatographic conditions for lipophilicity determination is a multi-faceted process. The experimental data and protocols presented here underscore that there is no single "one-size-fits-all" condition. The choice of mobile phase pH is paramount for ionizable compounds, as it directly controls the ionization state and thus the measured Log D. A systematic scouting across a physiologically relevant pH range is recommended to fully characterize a compound's lipophilic profile [26].
The selection of the stationary phase should be guided by the chemical nature of the analytes. While C18 columns remain the most popular and robust choice for a wide range of applications [6], alternative phases like phenyl or biphenyl can provide superior selectivity for specific compound classes, particularly those containing aromatic systems, by leveraging π-π interactions [60] [6]. Furthermore, the trend towards inert (biocompatible) column hardware is crucial for analyzing metal-sensitive compounds, such as phosphorylated molecules or certain chelating pharmaceuticals, as it prevents analyte adsorption and recovery issues [60].
In conclusion, a rational, two-pronged approach involving initial pH scouting followed by stationary phase evaluation, as outlined in the provided protocols and workflow, provides a robust framework for developing reliable chromatographic methods for lipophilicity determination. This strategy ensures the generation of high-quality data that can be effectively correlated with in silico predictions, thereby strengthening drug discovery and development pipelines.
Chromatographic methods are indispensable in modern drug discovery and development, playing a critical role in the determination of key physicochemical parameters such as lipophilicity. The reliability of these methods, however, hinges on successfully mitigating common analytical pitfalls including carryover, reproducibility issues, and recovery problems. Within the specific context of lipophilicity determination—a fundamental property influencing drug absorption, distribution, metabolism, and toxicity—these analytical challenges can significantly compromise data quality and subsequent decision-making. This application note provides detailed protocols and strategies to identify, troubleshoot, and resolve these critical issues, with a specific focus on enhancing the reliability of chromatographic methods for lipophilicity assessment in pharmaceutical research.
Understanding and Mitigating Carryover
Carryover occurs when analyte residues from a previous injection are detected in subsequent chromatographic runs, leading to inaccurate quantification and potential misinterpretation of data. In lipophilicity studies, where precise quantification is essential for determining partition coefficients, carryover can significantly skew log P and log D values.
The primary sources of carryover include contaminated autosampler components (such as needles, injection valves, and seals), adsorption of analytes to system components, and incomplete elution from the chromatographic column [62] [63]. Highly lipophilic compounds, which are frequently encountered in lipophilicity determination, are particularly prone to adsorption and carryover due to their strong interaction with hydrophobic surfaces.
Experimental Protocols for Identification and Mitigation
Protocol 1: Systematic Assessment of Carryover
- Blank Injection Analysis: Following the injection of a high-concentration standard solution, perform three consecutive injections of a blank solvent (e.g., the mobile phase).
- Chromatographic Comparison: Overlay the chromatograms of the blank injections. Any peaks appearing in the first blank injection that correspond to the analytes of interest indicate carryover.
- Quantification: Calculate the carryover percentage as:
(Peak Area in Blank / Peak Area of High Standard) × 100%. A value exceeding 0.1% typically necessitates corrective action.
Protocol 2: Mitigation via Autosampler Maintenance and Wash Optimization
- Needle Wash Optimization: Implement a rigorous needle wash procedure using a strong solvent (e.g., a mixture of acetonitrile and isopropanol) in addition to the standard wash solvent. Ensure the wash solvent is compatible with the sample solvent to prevent precipitation [62].
- Seal and Valve Maintenance: Regularly inspect and replace autosampler rotor seals and syringe needles according to the manufacturer's schedule. For methods involving lipophilic compounds, a more frequent maintenance cycle may be required.
- Flush Protocol: After analyzing high-concentration samples or highly lipophilic compounds, execute a system flush with a strong solvent gradient to ensure complete elution of retained analytes from the column and system [64].
Table 1: Common Sources and Mitigation Strategies for Carryover
| Source | Impact on Data | Mitigation Strategy |
|---|---|---|
| Contaminated Autosampler Needle | False peaks in blanks, inaccurate quantification | Implement a stronger needle wash solvent; perform regular maintenance |
| Adsorption in Flow Path | Reduced recovery, inconsistent peak areas | Use a co-solvent or modifier in the mobile phase; passivate the system |
| Incomplete Column Elution | Peak broadening, retention time shifts, ghost peaks | Incorporate a column cleaning step with strong solvents; use a guard column |
Ensuring Method Reproducibility
Reproducibility is the cornerstone of reliable chromatographic analysis, especially for lipophilicity determination where consistent retention times are critical for accurate log k or log kw calculations. Non-reproducibility can manifest as retention time shifts, peak area variability, and changes in peak shape.
Troubleshooting Retention Time Shifts
Retention time instability is a common challenge that can be systematically diagnosed and resolved. The following workflow provides a logical guide for troubleshooting.
Protocol 3: Diagnostic Steps for Retention Time Shifts Follow the logical pathway in the diagram above. Key experimental checks include:
- Mobile Phase Consistency: Verify that the mobile phase is prepared volumetrically with high-purity solvents and buffers. Use a pH meter to confirm buffer pH after preparation [64] [65]. For isocratic methods, premixing the mobile phase can eliminate compositional errors from pump mixing.
- Flow Rate Verification: Collect the mobile phase effluent from the column outlet in a graduated vessel over a measured time (e.g., 10 minutes) to confirm the set flow rate matches the delivered volume [64].
- System Pressure Test: Install a blank nut in place of the column and run the method at the standard flow rate. Compare the observed pressure to the system's specification or historical data; significantly different or fluctuating pressure indicates a potential pump issue or system blockage [64].
Mobile Phase Optimization for Reproducibility
The mobile phase is a critical factor influencing reproducibility. The following table summarizes key parameters to control.
Table 2: Mobile Phase Optimization for Enhanced Reproducibility
| Parameter | Impact on Reproducibility | Best Practice Protocol |
|---|---|---|
| Buffer Concentration & pH | Insufficient buffer capacity leads to pH shifts, altering ionization and retention times of ionizable compounds. | Use buffer concentrations ≥ 20 mM. Precisely adjust pH and re-measure after organic solvent addition [64] [65]. |
| Organic Modifier | Evaporation changes composition; different solvent grades contain varying UV-absorbing impurities. | Use high-purity HPLC solvents. Cover solvent reservoirs to minimize evaporation. Use solvent bottle liners if available [64]. |
| Dissolved Gases | Causes baseline noise and unstable flow rates in pumps and detectors. | Implement online degassing or sparge mobile phases with helium. Use vacuum filtration, which also degasses [65]. |
| Preparation Technique | Manual preparation introduces analyst-to-analyst variability. | Use automated dispensers and pipettes for volumetric measurements. Create detailed Standard Operating Procedures (SOPs) [66]. |
Addressing Recovery Issues
Reccovery problems, where the measured analyte concentration is less than the known amount, directly impact the accuracy of lipophilicity calculations. This is particularly critical in the shake-flask method, where the concentration in both aqueous and organic phases must be accurately quantified [27] [14].
- Adsorption: Loss of analyte, especially lipophilic or charged compounds, to container walls, filters, and system tubing [62].
- Incomplete Solubilization: Precipitated or poorly dissolved analyte in the sample solution [63].
- Chemical Instability: Degradation of the analyte during sample preparation or analysis.
- Incomplete Extraction: Inefficient partitioning in shake-flask methods or solid-phase extraction protocols.
Protocols for Recovery Assessment and Improvement
Protocol 4: Standard Recovery Assessment
- Sample Preparation: Prepare a standard solution of the analyte at a known concentration.
- System Passage: Inject the solution directly onto the HPLC system ("Neat Standard"). Then, subject an aliquot of the same solution to the entire sample preparation process (e.g., filtration, liquid-liquid extraction).
- Quantification and Calculation: Inject the processed sample ("Processed Standard") and compare the peak area to the neat standard. Calculate percentage recovery:
(Peak Area of Processed Standard / Peak Area of Neat Standard) × 100%.
Protocol 5: Mitigating Adsorption and Improving Recovery
- Container Selection: Use low-adsorption polypropylene tubes instead of glass or standard plastic. Pre-rinse all containers and filters with a solution containing the analyte or a competitive agent [27].
- Mobile Phase Modifiers: For highly lipophilic compounds, add modifiers to the mobile phase or sample solvent to compete for adsorption sites. For basic compounds, use alkylamines like triethylamine. For acidic compounds, use acetic or formic acid [62].
- Sample Solvent Strength: Ensure the sample is dissolved in a solvent that is weaker than or equal to the mobile phase in elution strength to prevent peak distortion and on-column focusing issues, which can affect integration and apparent recovery.
Application in Lipophilicity Determination
The principles and protocols outlined above are directly applicable to chromatographic methods for determining lipophilicity, such as the Reversed-Phase High-Performance Liquid Chromatography (RP-HPLC) method which correlates retention factor (log k) with the octanol-water partition coefficient (log P) [27] [14].
Detailed Protocol: RP-HPLC for Log P Determination (Method 1)
This protocol is based on the OECD guidelines and is suited for high-throughput screening in early drug discovery [14].
Objective: To rapidly estimate the log P of test compounds using a calibrated RP-HPLC method.
Experimental Workflow: The following diagram illustrates the end-to-end workflow for this protocol, highlighting critical steps that require careful control to mitigate the analytical pitfalls discussed in this note.
Materials and Reagents:
- Reference Compounds: A set of at least 6 compounds with known log P values covering a wide lipophilicity range (e.g., from 4-acetylpyridine, log P 0.5, to triphenylamine, log P 5.7) [14].
- Chromatographic System: HPLC system with a C18 column, isocratic pump, autosampler, and UV detector.
- Mobile Phase: Acetonitrile or methanol and a phosphate buffer (e.g., 20 mM, pH 7.0). The exact ratio is optimized to achieve good separation of the reference compounds.
Procedure:
- System Equilibration: Equilibrate the column with the selected mobile phase (e.g., 70:30 methanol:20 mM phosphate buffer, pH 7.0) at a constant temperature (e.g., 25°C) and stable flow rate (e.g., 1.0 mL/min) until a stable baseline is achieved.
- Analysis of Reference Compounds: Inject each reference compound individually. Record the retention time (tR). Also, record the void time (t0) using a non-retained compound like uracil or sodium nitrate.
- Calculate Capacity Factors: For each reference compound, calculate the capacity factor:
k = (t_R - t_0) / t_0. Then, calculate the logarithm (log k). - Construct Calibration Curve: Plot the known log P values of the reference compounds against their calculated log k values. Perform linear regression to obtain the standard equation:
log P = a × log k + b. The correlation coefficient (R²) should be ≥ 0.97 [14]. - Analysis of Test Compound: Under the exact same chromatographic conditions, inject the test compound and calculate its log k.
- Determine log P: Substitute the log k of the test compound into the standard equation to determine its log P.
Critical Considerations for Lipophilicity Methods:
- Reproducibility: For a log P method, retention time reproducibility is paramount. Strict adherence to the protocols in Section 3 is necessary. Any shift in tR will directly alter the calculated log k and final log P.
- Carryover: A robust autosampler wash cycle is essential to prevent a high-concentration sample from affecting the log k calculation of a subsequent low-concentration sample or blank.
- Recovery: While indirect in this method, poor recovery due to adsorption or insolubility could lead to an inability to detect the analyte or a peak area too low for accurate integration, thus failing the analysis.
The Scientist's Toolkit: Essential Reagents and Materials
Table 3: Key Research Reagent Solutions for Lipophilicity Determination
| Item | Function / Application |
|---|---|
| Certified Reference Materials | High-purity, certified log P standards (e.g., acetophenone, chlorobenzene, phenanthrene) for constructing and validating the RP-HPLC calibration curve [14]. |
| HPLC-Grade Solvents & Buffers | High-purity solvents (acetonitrile, methanol) and buffers (phosphate, acetate) for mobile phase preparation to ensure minimal baseline noise and reproducible retention times [65]. |
| Characterized C18 Columns | Reproducible reversed-phase columns from a reliable manufacturer. Using columns from the same lot is ideal for multi-site or long-term studies [67]. |
| Low-Adsorption Vials & Filters | Polypropylene autosampler vials and syringe filters (e.g., 0.45 µm) designed to minimize surface adsorption of lipophilic analytes, thereby improving recovery [27]. |
| System Suitability Test Mix | A mixture of compounds with known chromatographic behavior to verify column performance, autosampler precision, and detector sensitivity before initiating a batch analysis [64]. |
| Column Cleaning & Regeneration Solvents | Strong solvents (e.g., high-content organic, acid, or base washes as per column manufacturer's guidelines) for removing strongly retained compounds and restoring column performance [62] [64]. |
Successfully mitigating carryover, reproducibility, and recovery issues is not merely a technical exercise but a fundamental requirement for generating reliable and meaningful chromatographic data in lipophilicity research. By implementing the systematic troubleshooting workflows, detailed experimental protocols, and best practices outlined in this application note, scientists and drug development professionals can significantly enhance the quality and trustworthiness of their analytical results. A rigorous, proactive approach to method development and instrument maintenance is the most effective strategy for avoiding these common analytical pitfalls.
Benchmarking Performance: Validating Chromatographic Data Against Gold Standards
Correlating Chromatographic Retention with Shake-Flask logP Values
Lipophilicity, a fundamental molecular property, significantly influences the absorption, distribution, metabolism, excretion, and toxicity (ADMET) of drug candidates [68] [14]. It is most frequently quantified as the partition coefficient (logP), representing the equilibrium distribution of a compound between an organic phase, typically n-octanol, and an aqueous phase [4] [14]. The gold standard for its experimental determination is the shake-flask method [4] [14]. However, this direct approach can be labor-intensive, time-consuming, and require relatively pure compounds and substantial material [4] [14].
In parallel, reversed-phase high-performance liquid chromatography (RP-HPLC) provides an indirect, high-throughput alternative for lipophilicity assessment by relating a compound's retention time (or a derived capacity factor) to its logP [5] [14]. Establishing a robust correlation between chromatographic retention and shake-flask logP values allows researchers to leverage the speed and efficiency of HPLC for reliable lipophilicity estimation, which is particularly valuable in the early stages of drug discovery [14]. This Application Note details protocols for establishing and validating such a correlation, framed within the broader context of chromatographic methods for lipophilicity determination research.
Theoretical Foundation and Correlation Principle
The correlation between chromatographic retention and shake-flask logP is rooted in the similar physicochemical principles governing both processes. In the shake-flask method, partitioning occurs between two liquid phases: n-octanol and water [68]. In RP-HPLC, separation is based on partitioning between a mobile aqueous phase and a hydrophobic stationary phase [5] [14]. In both systems, more lipophilic compounds exhibit a stronger affinity for the non-polar environment (n-octanol or stationary phase).
The retention factor ((k)) in chromatography is calculated as (k = (tR - tM)/tM), where (tR) is the retention time of the analyte and (tM) is the column dead time [14]. A linear relationship is often established between the logarithm of the retention factor (log (k)) and the reference shake-flask logP for a set of standard compounds [14]. For greater accuracy, particularly across different chromatographic conditions, the extrapolated retention factor in 100% aqueous mobile phase (log (kw)) can be used, which eliminates the interference of organic modifiers [14]. The general form of the calibration model is:
[ \text{logP} = a \times \text{log } k_w + b ]
where (a) and (b) are the slope and intercept determined by linear regression [14]. This calibration equation then allows for the prediction of logP for unknown compounds based on their measured retention times.
Experimental Protocols
Protocol A: Shake-Flask logP Determination (Gold Standard)
This protocol, adapted from Andrés et al., is designed to determine logD at pH 7.4 using minimal drug substance [68] [69].
Research Reagent Solutions
- n-Octanol (water-saturated): Organic phase mimicking lipid membranes. Pre-saturate with buffer to prevent phase volume shifts [68].
- Phosphate Buffer (0.1 M, pH 7.4, n-octanol saturated): Aqueous phase simulating physiological pH. Pre-saturate with n-octanol to ensure stable partitioning [68].
- Drug Stock Solution: Prepare in DMSO or a suitable solvent at a known concentration. Using DMSO solutions aligns with common practices in pharmaceutical compound libraries [68].
- HPLC Mobile Phases: Use appropriate buffered aqueous and organic (e.g., acetonitrile, methanol) phases for analyte quantification [68].
Procedure
- System Preparation: Select one of four specific procedures and an octanol-to-water volume ratio (e.g., 0.02, 0.2, 2) based on the predicted lipophilicity and solubility of the drug to ensure measurable concentrations in both phases [68].
- Partitioning: In a vial or test tube, combine the buffered aqueous phase and n-octanol phase with the drug substance. The total volume is typically 1-2 mL [68].
- Equilibration: Vigorously stir or vortex the mixture to ensure thorough contact between phases. Centrifuge at 13,500 rpm for 5 minutes to achieve complete phase separation [68] [70].
- Quantification: Carefully separate the phases. Analyze the concentration of the analyte in each phase, preferably using a calibrated HPLC or UPLC system with UV detection. To minimize error, the procedure can be designed to analyze only the aqueous phase, with the octanol concentration determined by mass balance [68].
- Calculation: Calculate the distribution coefficient (logD) using the formula: [ \text{logD} = \log\left(\frac{C{\text{octanol}}}{C{\text{water}}}\right) ] where (C) is the equilibrium concentration in the respective phase. For ionizable compounds, this value is the pH-dependent logD, with logD7.4 being of high physiological relevance [68]. Perform the experiment in triplicate and average the results [70].
Protocol B: HPLC-based logP Determination and Correlation
This protocol outlines the establishment of a correlation model using RP-HPLC and its application for logP prediction [5] [14].
Research Reagent Solutions
- HPLC Reference Standards: A minimum of 6 compounds with known, experimentally determined shake-flask logP values covering a wide lipophilicity range (e.g., logP 0.5 to 5.7). Examples include 4-acetylpyridine, acetophenone, chlorobenzene, ethylbenzene, phenanthrene, and triphenylamine [14].
- HPLC Mobile Phase A: Aqueous buffer (e.g., phosphate).
- HPLC Mobile Phase B: Organic modifier (Methanol is often preferred as it mimics the hydrogen-bonding properties of n-octanol [14]).
- Test Compound Solutions: Prepare unknowns at a suitable concentration in a compatible solvent.
Procedure: Single-Point Isocratic Method (Rapid Screening)
- Chromatographic Setup: Use a reversed-phase C18 column. Establish isocratic elution conditions with a mobile phase composition that provides adequate retention for the standard compounds [14].
- System Calibration: Inject each reference standard. Record the retention time ((tR)) and the dead time ((tM)). Calculate the capacity factor ((k)) for each standard. Plot log (k) against the known logP values of the standards and perform linear regression to obtain the calibration equation [14].
- Validation: Ensure the correlation coefficient (R²) of the calibration curve is strong (e.g., >0.97) [14].
- Unknown Prediction: Inject the test compound under the same chromatographic conditions. Calculate its log (k) and use the calibration equation to predict its logP.
Procedure: Extrapolated log (k_w) Method (High Accuracy)
- Multi-Point Measurement: For each reference and test compound, perform chromatographic runs using at least three different mobile phase compositions (e.g., different percentages of methanol: 60%, 70%, 80%) [14].
- log (kw) Determination: For each compound, plot log (k) against the volume fraction of organic modifier ((\phi)). Extrapolate the linear plot to 0% organic modifier ((\phi = 0)); the y-intercept is the log (kw) value [14].
- Model Establishment: Plot log (k_w) of the reference standards against their known logP values to create a more accurate calibration model [14].
- Unknown Prediction: Determine the log (k_w) for test compounds and use this high-accuracy model to predict logP.
The following workflow diagrams the process of establishing and applying the correlation between chromatographic retention and shake-flask logP.
Data Presentation and Method Comparison
The following tables summarize key data and characteristics for the described methods.
Table 1. Representative Reference Compounds for HPLC Calibration [14]
| Compound Name | logP Value |
|---|---|
| 4-Acetylpyridine | 0.5 |
| Acetophenone | 1.7 |
| Chlorobenzene | 2.8 |
| Ethylbenzene | 3.2 |
| Phenanthrene | 4.5 |
| Triphenylamine | 5.7 |
Table 2. Comparison of Lipophilicity Determination Methods [4] [14]
| Method | Measurement Range (logP) | Speed | Sample Purity Requirement | Key Advantages | Key Limitations |
|---|---|---|---|---|---|
| Shake-Flask | -2 to 4 [14] | Slow | High | Direct measurement, considered the gold standard [4] | Time-consuming, prone to emulsification, not for unstable compounds [4] [14] |
| HPLC (Single-point) | 0 to 6 [14] | Rapid | Low to Moderate | High-throughput, small sample volume, insensitive to impurities [14] | Less accurate than log (k_w) method, affected by organic modifier [14] |
| HPLC (log (k_w)) | 0 to 6 [14] | Medium | Low to Moderate | High accuracy, eliminates organic modifier effect [14] | Requires multiple runs per compound, slower than single-point method [14] |
| In Silico | Broad | Very Rapid | N/A | Cost-effective, useful for initial filtering [4] [71] | Accuracy depends on training data; can be unreliable for novel scaffolds [4] [71] |
The correlation between chromatographic retention and shake-flask logP provides a powerful tool for medicinal chemists and drug development scientists. The shake-flask method remains essential for generating definitive reference data, particularly for novel chemical entities or when high precision is required [68] [4]. However, for high-throughput screening during early drug discovery, the speed and efficiency of the HPLC-based methods are unparalleled [5] [14].
Selection Guide:
- Use Shake-Flask: When validating lead compounds, for compounds with logP near the extremes of the range, or when the highest accuracy is critical for regulatory purposes.
- Use HPLC Single-Point: For rapid profiling of large compound libraries in early-stage screening where speed is a priority.
- Use HPLC log (k_w): For accurate logP determination of key candidates in later development stages where precision is needed but shake-flask is too resource-intensive [14].
In conclusion, a well-validated correlation model allows chromatographic retention time to serve as a reliable and practical proxy for shake-flask logP. Integrating these methods creates an efficient workflow for lipophilicity assessment, accelerating drug discovery and development while ensuring data quality.
Reversed-phase high-performance liquid chromatography (RP-HPLC) serves as a cornerstone technique for lipophilicity determination in drug development, where the conflicting demands of analytical accuracy and methodological speed present a significant challenge for researchers. Lipophilicity, quantified as the logarithm of the n-octanol/water partition coefficient (log P) or distribution coefficient (log D), represents a crucial physicochemical parameter that governs pharmacokinetic properties including absorption, distribution, metabolism, excretion, and toxicity (ADMET) of potential drug candidates [33] [14]. Within chromatographic method development, a fundamental trade-off exists between the rigorous characterization offered by traditional approaches and the rapid analysis provided by high-throughput systems. This application note examines this critical balance by comparing established and emerging RP-HPLC protocols, providing structured experimental data and detailed methodologies to guide researchers in selecting appropriate strategies for specific stages of pharmaceutical development.
Theoretical Background: Lipophilicity Determination by RP-HPLC
The application of RP-HPLC for lipophilicity assessment leverages the correlation between a compound's retention behavior on a non-polar stationary phase and its partitioning in biphasic systems. The chromatographic hydrophobicity index, typically expressed as log k (the logarithm of the retention factor), relates to the traditional shake-flask partition coefficient through the Collander equation: log P = A × log k + B [33] [7]. For ionizable compounds, the distribution coefficient (log D) at physiological pH (7.4) becomes particularly relevant, reflecting the composite lipophilicity of all molecular species present [14] [7].
The Organic Chemistry of Metabolism and Scientific Research design demonstrates how RP-HPLC methods capitalize on these relationships through two primary approaches:
- Direct Calibration: Utilizing a calibration curve constructed with reference compounds of known log P values, where log k is plotted against reference log P [14].
- Extrapolation Method: Determining log kw, the theoretical retention factor in a purely aqueous mobile phase, by measuring retention times at multiple organic modifier concentrations and extrapolating to 0% modifier [33] [14]. This approach accounts for the influence of organic modifiers on retention mechanics, thereby providing a more accurate lipophilicity estimate [14].
Comparative Analysis of RP-HPLC Approaches
Performance Characteristics
The following table summarizes the key operational and performance characteristics of traditional, accuracy-optimized RP-HPLC methods versus high-throughput, speed-optimized protocols:
| Parameter | Traditional (Accuracy-Optimized) Protocol | High-Throughput (Speed-Optimized) Protocol |
|---|---|---|
| Primary Application Scenario | Late-stage drug development requiring high-precision data [14] | Early screening stages analyzing large compound libraries [14] |
| Fundamental Equation | log P = a × log kw + b [14] | log P = a × log k + b [14] |
| Run Time per Compound | 2 – 2.5 hours [14] | < 30 minutes [14] |
| Correlation Coefficient (R²) | 0.996 [14] | 0.970 [14] |
| Data Agreement with Literature Values | ~100% (differences < 0.5 log units) [14] | ~85% (differences < 0.5 log units) [14] |
| Key Advantages | High predictive accuracy; accounts for organic modifier effects [14] | Rapid analysis; cost-effective; high throughput [14] |
| Principal Limitations | Time-consuming; higher operational cost [14] | Lower accuracy; susceptible to modifier-induced retention shifts [14] |
Experimental Workflow and Decision Pathway
The diagram below outlines the experimental workflow and key decision points for selecting and implementing appropriate RP-HPLC protocols for lipophilicity assessment:
Decision Pathway and Workflow for RP-HPLC Lipophilicity Assessment
Detailed Experimental Protocols
High-Throughput RP-HPLC Protocol for log P Determination
Principle: This method utilizes a single isocratic elution to determine the retention factor (log k) of analytes, which is directly correlated to reference compound log P values via a pre-established calibration curve [14].
Procedure:
- Mobile Phase Preparation: Prepare a mixture of methanol and water (or buffer) at a fixed ratio (e.g., 70:30 v/v). Degas the solution by sonication for 10 minutes [72].
- System Setup: Equilibrate the HPLC system with the prepared mobile phase at a flow rate of 1.0 mL/min using a Thermo C18 column (250 × 4.6 mm, 5 µm) or equivalent [72]. Set the column temperature to 30°C and UV detection to a suitable wavelength (e.g., 244 nm for compounds like haloperidol) [72].
- Calibration Curve Construction:
- Prepare standard solutions of reference compounds with known log P values (see Table 2).
- Inject each reference standard and record the retention time (tR). Also, record the void time (t0) using an unretained compound like sodium nitrate [33].
- Calculate the capacity factor for each standard: log k = log[(tR - t0)/t0] [33] [14].
- Plot the known log P values of the standards against their calculated log k values. Perform linear regression to obtain the standard equation: log P = a × log k + b [14].
- Sample Analysis:
- Inject the test compound under the same chromatographic conditions.
- Calculate its log k value and use the standard equation to determine its log P.
Traditional Accuracy-Optimized RP-HPLC Protocol
Principle: This method enhances accuracy by determining log kw, the theoretical capacity factor in a purely aqueous mobile phase. This is achieved by measuring retention times at multiple organic modifier concentrations and extrapolating to zero [33] [14].
Procedure:
- Mobile Phase Preparation: Prepare a series of mobile phases with varying volumes of organic modifier (e.g., methanol), such as 60%, 70%, and 80% (v/v), with the remainder being a buffer like 20 mM disodium hydrogen phosphate (pH 3.1) or water [73] [14].
- Chromatographic System: Use an Inertsil ODS-3 C18 column (250 × 4.6 mm, 5 µm) or equivalent. Maintain a flow rate of 1.0 mL/min and a column temperature of 30°C [73].
- log kw Determination:
- For each reference and test compound, perform isocratic elution at each of the three different organic modifier concentrations (φ).
- At each concentration, calculate log k.
- For each compound, plot log k against the volume fraction of the organic modifier (φ). The y-intercept of the resulting line (log k = Sφ + log kw) is the log kw value [14].
- Calibration and Analysis:
- Plot the known log P values of the reference standards against their determined log kw values. Perform linear regression to obtain the standard equation: log P = a × log kw + b [14].
- For a test compound, determine its log kw as described and use this standard equation to calculate its accurate log P.
The Scientist's Toolkit: Essential Research Reagents and Materials
| Item | Specification / Example | Function / Rationale |
|---|---|---|
| Chromatography Column | C18 (e.g., Inertsil ODS-3, 250 mm × 4.6 mm, 5 µm) [73] | Non-polar stationary phase for separation based on hydrophobic interactions [74]. |
| Organic Modifier | Methanol, Acetonitrile (HPLC Grade) [14] [75] | Modifies mobile phase polarity to control analyte retention; methanol is often preferred for its biomimetic properties [14]. |
| Aqueous Buffer | 20 mM Disodium hydrogen phosphate (pH 3.1-7.8) [73] [76] | Maintains constant pH, critical for ionizable compounds and reproducible retention times. |
| Reference Compounds | 4-Acetylpyridine (log P 0.5), Acetophenone (1.7), Chlorobenzene (2.8), Ethylbenzene (3.2), Phenanthrene (4.5), Triphenylamine (5.7) [14] | Enables construction of the standard curve for correlating retention behavior with known log P. |
The choice between high-throughput and traditional RP-HPLC protocols is not a matter of selecting a universally superior option, but rather of aligning methodological strategy with project-specific requirements. High-throughput methods provide an invaluable tool for the rapid ranking of compound libraries during early discovery phases, where relative comparisons are paramount. Conversely, traditional, accuracy-optimized protocols are indispensable for late-stage development and regulatory submissions, where precise and definitive log P data is non-negotiable. By understanding the theoretical basis, practical implementations, and inherent compromises of each approach, researchers can effectively leverage RP-HPLC to generate high-quality lipophilicity data that accelerates the drug development process.
Integrating In Silico Predictions with Experimental Chromatographic Data
Lipophilicity, quantified as the partition coefficient (log P) and distribution coefficient (log D), is a fundamental physicochemical property in drug discovery and development. It profoundly influences a compound's absorption, distribution, metabolism, and excretion (ADME) properties, membrane permeability, and ultimately, its biological activity [26]. The determination of lipophilicity is therefore crucial for optimizing drug candidates.
Chromatographic techniques, particularly Reversed-Phase High-Performance Liquid Chromatography (RP-HPLC) and Reversed-Phase Thin-Layer Chromatography (RP-TLC), are widely established for the experimental assessment of lipophilicity. These methods are efficient, reproducible, and capable of simulating the partitioning of compounds between aqueous and lipid phases, analogous to biological membranes [31] [26]. Concurrently, advances in computational chemistry have led to the proliferation of in silico tools that predict log P values directly from molecular structure.
Integrating these computational predictions with experimental chromatographic data creates a powerful, synergistic framework. This hybrid approach accelerates the early stages of drug discovery by providing rapid, reliable lipophilicity estimates, reducing the reliance on costly and time-consuming experimental methods alone, and enabling the screening of virtual compound libraries [31] [26] [6].
Theoretical Framework
The integration of in silico and chromatographic methods is underpinned by robust theoretical models that relate molecular structure to retention behavior.
Chromatographic Retention and Lipophilicity
In reversed-phase chromatography, a compound's retention is governed by its partitioning between a polar mobile phase and a non-polar stationary phase. The capacity factor (log k) is a direct chromatographic measure of this interaction and correlates strongly with log P [26] [6]. The Linear Solvent Strength (LSS) theory provides a simple model to describe this relationship as a function of mobile phase composition [77]:
log k = log k_w - S φ
where k is the retention factor, k_w is the extrapolated retention factor in pure water, S is a solute-dependent solvent strength parameter, and φ is the volume fraction of the organic modifier [77].
In Silico Prediction Methods
Quantitative Structure-Property Relationship (QSPR) models predict lipophilicity using molecular descriptors derived from a compound's structural representation [77]. These models employ various algorithms, including multiple linear regression, partial least-squares regression, and machine learning methods like support vector regression and artificial neural networks [77] [6].
The Integrated Data Relationship
The core of this integration lies in the strong linear correlation between chromatographically derived lipophilicity parameters (e.g., log k or the specific RMW from TLC) and computed log P values. A strong correlation (e.g., R² > 0.9) validates the in silico predictions and establishes the chromatographic method as a reliable proxy for biological partitioning [6]. This allows researchers to use computationally predicted log P to guide experimental design and, in turn, use experimental results to refine predictive models.
Protocols and Application Notes
Protocol 1: In Silico Lipophilicity Prediction
This protocol outlines the use of computational tools to predict the lipophilicity of target compounds.
- Objective: To obtain consensus log P values for a series of compounds using diverse algorithmic platforms.
- Principle: Different software tools use distinct algorithms to compute log P from a molecule's Simplified Molecular Input Line Entry System (SMILES) string or other structural representations. Using multiple platforms and generating a consensus value improves prediction reliability [31].
- Materials:
- Molecular structures of compounds (e.g., as SMILES strings).
- Access to in silico prediction platforms.
- Procedure:
- Prepare a list of canonical SMILES strings for all compounds under investigation.
- Submit each SMILES string to a panel of prediction software. Commonly used, freely available tools include:
- AlogPs
- XlogP3
- ilogP
- MlogP
- ACD/Labs Log P
- Log P
consensus(a composite value from multiple algorithms) [31]
- Record all predicted log P values.
- Calculate the mean or median value to establish a consensus log P for each compound. The standard deviation of the predictions can be used to assess reliability.
Table 1: Example In Silico Lipophilicity Predictions for a Series of Neuroleptics (as reported in [31])
| Compound | AlogPs | XlogP3 | ilogP | MlogP | ... | Consensus Log P |
|---|---|---|---|---|---|---|
| Fluphenazine | 4.56 | 4.82 | 4.21 | 4.65 | ... | 4.56 |
| Triflupromazine | 5.12 | 5.45 | 4.98 | 5.23 | ... | 5.20 |
| Flupentixol | 4.89 | 5.02 | 4.75 | 4.91 | ... | 4.89 |
| Zuclopenthixol | 5.45 | 5.61 | 5.32 | 5.54 | ... | 5.48 |
Protocol 2: Chromatographic Determination of Lipophilicity via RP-UHPLC
This protocol details the experimental determination of chromatographic lipophilicity using a reversed-phase UHPLC system with multiple stationary phases.
- Objective: To determine the capacity factors (log k) of compounds across different chromatographic systems and correlate them with in silico predictions.
- Principle: Compounds are separated on stationary phases of varying hydrophobicity and chemistry (e.g., C18, C8, Phenyl). The log k value at a specific mobile phase composition serves as an experimental lipophilicity index. Using multiple systems provides an "anisotropic" lipophilicity profile, offering a more comprehensive view of the compounds' interaction with different environments [6].
- Materials:
- UHPLC System: equipped with a pump, autosampler, column thermostat, and detector (e.g., DAD or MS).
- Columns: C18, C8, and Phenyl stationary phases (e.g., 100 mm x 2.1 mm, 1.7-1.8 µm particle size).
- Mobile Phases: Water (Buffer), and organic modifiers (Methanol, Acetonitrile, Methanol/Acetonitrile mixture).
- Standards and Samples: Analytical standards of target compounds dissolved in a suitable solvent.
- Procedure:
- Method Development: Establish isocratic methods for each column with a fixed mobile phase composition (e.g., 60:40 organic modifier/water). The composition should be adjusted to ensure peaks elute within a reasonable retention window.
- System Equilibration: Equilibrate each column with the respective mobile phase until a stable baseline is achieved.
- Sample Analysis: Inject each compound solution in triplicate.
- Data Acquisition and Processing:
- Record the retention time (tR) for each compound and the void time (t0) of the system.
- Calculate the retention factor:
k = (tR - t0) / t0. - Calculate the logarithm of the retention factor (log k) for each compound in every chromatographic system.
- Data Analysis:
- Perform linear regression analysis to correlate the experimental log k values from each system with the consensus in silico log P.
- High correlation coefficients (R² > 0.9) indicate a strong relationship, validating the use of the chromatographic system for lipophilicity assessment for that specific compound series [6].
Table 2: Example Chromatographic Lipophilicity (log k) of Androstane Derivatives on a C18 Column with Different Modifiers (adapted from [6])
| Compound ID | log k (Methanol/Water) | log k (Acetonitrile/Water) | log k (Methanol/Acetonitrile/Water) |
|---|---|---|---|
| 1 | 1.45 | 1.12 | 1.32 |
| 2 | 1.51 | 1.18 | 1.39 |
| 9 | 1.88 | 1.52 | 1.74 |
| 10 | 1.92 | 1.58 | 1.79 |
Protocol 3: Data Integration and Chemometric Analysis
This protocol describes the process of integrating the datasets and performing advanced statistical analysis to identify patterns and build predictive models.
- Objective: To create a unified dataset of computed and experimental lipophilicity parameters and analyze it using chemometric techniques to group compounds and validate the integration strategy.
- Principle: Pattern recognition techniques, both linear and non-linear, can uncover hidden structures within multidimensional data. This helps in understanding how structural features influence lipophilicity across different experimental systems [6].
- Procedure:
- Data Compilation: Create a single data matrix where rows represent compounds and columns represent all available in silico and chromatographic descriptors (e.g., Consensus Log P, log kC18MeOH, log kC8ACN, log kPhenylMix).
- Data Pre-processing: Standardize the data (mean-centering and scaling to unit variance) to ensure all variables contribute equally to the analysis.
- Chemometric Analysis:
- Principal Component Analysis (PCA): Apply PCA to reduce the dimensionality of the data and visualize the natural grouping of compounds in the space of the first few principal components. The score plot shows compound clustering, while the loading plot reveals which variables are responsible for the separation [6].
- Hierarchical Cluster Analysis (HCA): Use HCA to build a dendrogram that groups compounds based on the similarity of their lipophilicity profiles.
- Artificial Neural Networks (ANN): Employ non-linear clustering based on ANN (e.g., Kohonen networks) to validate the groupings identified by linear methods and to model complex, non-linear relationships [6].
The Scientist's Toolkit: Essential Research Reagents and Materials
Table 3: Key Reagents and Materials for Integrated Lipophilicity Studies
| Item | Function & Application | Example/Note |
|---|---|---|
| C18 Column | Standard stationary phase for lipophilicity assessment; provides strong hydrophobic interactions. | Ideal for characterizing medium to highly lipophilic compounds [6]. |
| C8 Column | Moderately lipophilic stationary phase; provides weaker hydrophobic interactions than C18. | Useful for profiling highly lipophilic compounds and for comparative studies [6]. |
| Phenyl Column | Stationary phase offering π-π interactions in addition to hydrophobicity. | Essential for analyzing compounds with aromatic systems to understand π-stacking contributions [6]. |
| Methanol & Acetonitrile | Common organic modifiers for the mobile phase in RP-UHPLC. | MeOH is hydrogen-bonding, ACN is dipolar; choice affects selectivity and retention [6]. |
| Molecular Structure Software | Generates SMILES strings and 2D/3D structures for input into prediction software. | e.g., ChemDraw, ChemSketch, Molinspiration Cheminformatics [31]. |
| In Silico Platforms | Suite of software/algorithms for predicting log P from molecular structure. | Use a panel (e.g., AlogPs, XlogP3, milogP) to generate a consensus value [31]. |
| Chromatography Data System (CDS) | Software for instrument control, data acquisition, peak integration, and calibration. | Provides data integrity, audit trails, and centralized data management [78]. |
Data Integration and Analysis
The final step involves a critical comparison of the datasets to build a validated model.
- Correlation Analysis: As demonstrated in recent studies on androstane derivatives, strong linear correlations (e.g., R² = 0.93 on a C18 column with methanol) can be achieved between chromatographic log k and consensus log P [6]. This high degree of correlation confirms that the chromatographic retention effectively captures the molecular properties encoded in the in silico descriptors.
- Interpreting the Model: The correlation equation (
log k = m * log P + c) itself becomes a predictive tool. For a new compound within the same chemical series, one can use its computed log P to predict its chromatographic behavior, or vice versa. The residuals of the model (differences between predicted and observed values) can highlight compounds with atypical behavior, potentially due to specific molecular interactions not fully captured by the general model. - Chemometric Validation: The application of PCA, HCA, and ANN provides a visual and statistical confirmation that compounds cluster based on their combined in silico and experimental lipophilicity profiles. This multi-method approach strengthens the conclusion that the integration is meaningful and robust, providing a reliable foundation for future QSRR studies and the prediction of biological activity [6].
Within the framework of research on chromatographic methods for lipophilicity determination, the validation of the analytical methodology is paramount. Lipophilicity, a critical physicochemical parameter influencing drug absorption, distribution, and toxicity, must be measured with methods that are reliable and reproducible. This application note provides detailed protocols and insights for establishing three key performance characteristics of a robust analytical method: linearity, reproducibility, and the limit of quantitation (LOQ). Ensuring these parameters are rigorously evaluated is fundamental for generating trustworthy data in drug development.
Core Validation Parameters: Protocols and Application
Linearity
Definition and Objective: Linearity is the method's ability to elicit test results that are directly, or through a well-defined mathematical transformation, proportional to the concentration of the analyte within a specified range [79] [80]. For lipophilicity measurements, this confirms the chromatographic response (e.g., peak area) reliably reflects the analyte concentration across the intended scope of the method.
Experimental Protocol:
- Preparation of Standard Solutions: Prepare a minimum of five calibration standard solutions covering the specified range of the procedure. For lipophilicity studies, this range should encompass the expected log P or log D values of the analytes. A example minimum range, as per ICH guidelines, is 80-120% of the test concentration for an assay [79].
- Analysis: Inject each standard solution in triplicate using the finalized chromatographic method (e.g., reversed-phase HPLC or UHPLC).
- Data Analysis: Plot the mean analyte response against the concentration. Perform a linear regression analysis to obtain the calibration curve equation (y = mx + c), the coefficient of determination (r²), and the residuals.
- Acceptance Criteria: The correlation coefficient (r) is typically required to be greater than 0.999 for assay methods, and a visual inspection of the residuals plot should show random scatter, indicating a good fit [79].
Considerations for Lipophilicity Methods: In LC-MS, the linearity of the signal can be adversely affected by matrix effects from co-eluting compounds, which can suppress or enhance ionization [80]. It is therefore crucial to investigate linearity in the presence of matrix components to ensure the calibration graph remains linear.
Reproducibility
Definition and Objective: Reproducibility expresses the precision under reproducibility conditions, which involves measurements made by different laboratories using the same method on identical test items [81] [82]. It is the highest level of precision testing and is essential for methods intended to be transferred between labs or standardized.
Experimental Protocol (Collaborative Study):
- Study Design: A minimum of two, preferably more, independent laboratories should participate. Each laboratory receives the same, detailed analytical procedure and a set of identical, homogeneous test samples (e.g., a drug substance with a known lipophilicity profile).
- Sample Analysis: Each analyst prepares their own standards and solutions, uses different HPLC systems, and performs replicate measurements (e.g., n=6) on the provided samples.
- Data Collection and Analysis: Each laboratory reports the mean value, standard deviation (SD), and relative standard deviation (%RSD) of their results.
- Acceptance Criteria: The results between laboratories are compared. The %RSD from the collaborative study is reported as the reproducibility standard deviation. The % difference in the mean values between laboratories should be within pre-defined specifications, often assessed via statistical tests like an ANOVA [79] [82].
Distinction from Other Precision Measures: It is critical to differentiate reproducibility from repeatability and intermediate precision:
- Repeatability: Precision under the same operating conditions over a short time (intra-assay precision) [79] [81].
- Intermediate Precision: Precision within the same laboratory, accounting for variations like different days, analysts, or equipment [79] [81]. This was formerly referred to as "ruggedness" in the USP [79] [83].
Limit of Quantitation (LOQ)
Definition and Objective: The LOQ is the lowest concentration of an analyte in a sample that can be quantitatively determined with acceptable precision and accuracy under the stated operational conditions of the method [79] [84] [85]. For trace analysis in lipophilicity studies, this defines the method's sensitivity.
Experimental Protocols: The LOQ can be determined through several approaches, with the following two being most common:
1. Based on Signal-to-Noise Ratio (S/N):
- Procedure: Prepare an analyte standard at a low concentration that produces a peak with a signal-to-noise ratio of 10:1 [79] [86] [85].
- Validation: Inject this standard a minimum of six times to demonstrate that the precision (as %RSD) is ≤ 20% and the accuracy is within ±20% of the nominal concentration [85].
2. Based on the Calibration Curve:
- Procedure: Using data from a linearity study, the LOQ can be calculated using the formula: LOQ = 10σ / S where σ is the standard deviation of the response (often taken as the standard error of the regression line or the y-intercept), and S is the slope of the calibration curve [79] [86].
- Validation: As with the S/N method, the estimated LOQ must be validated by analyzing replicate samples (n=6) at that concentration to confirm the precision and accuracy meet the acceptance criteria of ±20% [86] [85].
Table 1: Summary of Key Validation Parameters, Protocols, and Acceptance Criteria
| Parameter | Experimental Objective | Key Steps in Protocol | Typical Acceptance Criteria |
|---|---|---|---|
| Linearity | Establish proportionality between response and concentration [80]. | - Prepare ≥5 concentration levels [79].- Analyze each in triplicate.- Perform linear regression. | r > 0.999 (for assay) [79]; Residuals are randomly scattered. |
| Reproducibility | Determine inter-laboratory precision [81] [82]. | - Conduct collaborative study with ≥2 labs.- Use identical procedures and samples.- Collect and statistically compare data (e.g., ANOVA). | %RSD and difference in means between labs within pre-defined specifications. |
| Limit of Quantitation (LOQ) | Determine the lowest concentration quantifiable with accuracy and precision [79]. | - Calculate via S/N (10:1) or calibration curve (LOQ=10σ/S) [79] [86].- Validate with n=6 samples at the LOQ. | Precision (%RSD) ≤ 20%; Accuracy within ±20% of nominal value [85]. |
The Scientist's Toolkit: Essential Research Reagents and Materials
The following table details key materials required for the successful execution of the validation protocols described above.
Table 2: Key Research Reagent Solutions for Chromatographic Method Validation
| Item | Function / Application in Validation |
|---|---|
| High-Purity Analytical Standards | Used to prepare calibration curves for linearity assessment and spiked samples for LOQ determination. Purity is critical for accurate results. |
| Appropriate Chromatographic Column | The stationary phase (e.g., C18) defines the separation mechanism. Consistent column performance across different lots and labs is vital for reproducibility. |
| Mass Spectrometry-Grade Solvents & Buffers | Essential for preparing the mobile phase. High purity minimizes background noise, improving S/N for LOQ determination and ensuring robust LC-MS performance [80]. |
| Characterized Blank Matrix | A sample of the solvent or biological matrix without the analyte. Used to prepare calibration standards and to demonstrate specificity and the absence of interference at the LOQ. |
Workflow and Relationship Diagrams
The following diagram illustrates the logical sequence and relationships between the key activities in a method robustness study, from foundational parameter definition to final method characterization.
Method Robustness Evaluation Workflow
The determination of the Limit of Quantitation (LOQ) involves multiple accepted methodologies. The decision tree below outlines the primary pathways and the critical final step common to all approaches.
LOQ Determination Pathways
Conclusion
Chromatographic methods provide a versatile, reliable, and high-throughput platform for lipophilicity determination that is indispensable in modern drug discovery. The synergy of foundational knowledge, robust methodological application, careful troubleshooting, and rigorous validation ensures that the generated logP/logD data accurately predicts the pharmacokinetic and pharmacodynamic behavior of drug candidates. As drug modalities evolve towards greater complexity, the continued refinement of these chromatographic techniques, including their integration with advanced in silico tools and biomimetic systems, will be crucial for de-risking development and accelerating the delivery of effective therapeutics to the clinic.
References
- 1. LogD | Cambridge MedChem Consulting [https://www.cambridgemedchemconsulting.com/resources/physiochem/logD.html]
- 2. Partition coefficient [https://en.wikipedia.org/wiki/Partition_coefficient]
- 3. LogD7.4 prediction enhanced by transferring knowledge from chromatographic retention time, microscopic pKa and logP | Journal of Cheminformatics [https://link.springer.com/article/10.1186/s13321-023-00754-4]
- 4. Methods for Determination of Lipophilicity [https://encyclopedia.pub/entry/26444]
- 5. A robust, viable, and resource sparing HPLC-based logP ... [https://www.sciencedirect.com/science/article/pii/S0378517323007457]
- 6. Comprehensive Chemometric and Chromatographic ... [https://www.mdpi.com/1424-8247/18/12/1778]
- 7. In Silico and RP HPLC Studies of Biologically Active 1,3,4 ... [https://pmc.ncbi.nlm.nih.gov/articles/PMC12525849/]
- 8. Comparison of HPLC, HPTLC, and In Silico Lipophilicity ... [https://pubmed.ncbi.nlm.nih.gov/38893351/]
- 9. Simultaneous determination of LogD, LogP, and pK(a) ... [https://pubmed.ncbi.nlm.nih.gov/19275530/]
- 10. State of the art and prospects of methods for determination ... [https://www.sciencedirect.com/science/article/abs/pii/S0165993618300669]
- 11. Lipophilicity as a Central Component of Drug-Like Properties ... [https://pmc.ncbi.nlm.nih.gov/articles/PMC6515054/]
- 12. Study of the Lipophilicity and ADMET Parameters of New ... [https://pmc.ncbi.nlm.nih.gov/articles/PMC11206290/]
- 13. HPLC-Based Measurements of Various Lipophilicity ... [https://www.chromatographyonline.com/view/hplc-based-measurements-various-lipophilicity-parameters-aid-drug-design]
- 14. Establishment and Application of Reversed-Phase Liquid ... [https://dmpkservice.wuxiapptec.com/articles/36-rapid-determination-of-lipophilicity-establishment-and-application-of-reversed-phase-liquid-chromatography-rp-hplc/]
- 15. Key Properties in Drug Design | Predicting Lipophilicity, ... [https://chemaxon.com/blog/presentation/key-properties-in-drug-design-predicting-lipophilicity-pka-and-solubility-0]
- 16. Use of TLC and Computational Methods to Determine ... [https://pubmed.ncbi.nlm.nih.gov/41011127/]
- 17. Lipinski's rule of five [https://en.wikipedia.org/wiki/Lipinski%27s_rule_of_five]
- 18. Lipinski's Rule of Five - an overview [https://www.sciencedirect.com/topics/nursing-and-health-professions/lipinskis-rule-of-five]
- 19. Lipinski's rule of five – Knowledge and References [https://taylorandfrancis.com/knowledge/Medicine_and_healthcare/Pharmaceutical_medicine/Lipinski%27s_rule_of_five/]
- 20. Understanding Lipinski's Rule of 5 and the Role of LogP ... [https://www.sailife.com/understanding-lipinskis-rule-of-5-and-the-role-of-logp-value-in-drug-design-and-development/]
- 21. Overcoming Challenges in Small-Molecule Drug ... [https://www.mdpi.com/1422-0067/25/23/13121]
- 22. LogP vs LogD - What is the Difference? [https://www.acdlabs.com/blog/partitioning-logp-or-logd-are-you-using-measuring-the-right-descriptor/]
- 23. A Review of Blood Brain Barrier Permeability Prediction Models [https://pmc.ncbi.nlm.nih.gov/articles/PMC11949286/]
- 24. Prediction of Blood-Brain Barrier Penetration (BBBP) ... [https://www.mdpi.com/1420-3049/26/24/7428]
- 25. High-performance liquid chromatography-based ... [https://pharmacia.pensoft.net/article/141364/]
- 26. Liquid chromatography in determination of ... [https://www.sciencedirect.com/science/article/abs/pii/S1570023225001266]
- 27. Liquid Chromatography on the Different Methods for ... [https://www.mdpi.com/2227-9040/10/8/340]
- 28. Critical comparison of shake-flask, potentiometric and ... [https://www.sciencedirect.com/science/article/abs/pii/S0928098718303087]
- 29. Critical comparison of shake-flask, potentiometric and ... [https://pubmed.ncbi.nlm.nih.gov/30006180/]
- 30. How to Evaluate Lipophilicity Rapidly? The Significance of ... [https://dmpkservice.wuxiapptec.com/blogs/91-how-to-evaluate-lipophilicity-rapidly-the-significance-of-reversed-phase-liquid-chromatography-rp-hplc/]
- 31. Use of TLC and Computational Methods to Determine ... [https://pmc.ncbi.nlm.nih.gov/articles/PMC12472637/]
- 32. Estimating the Lipophilicity of Natural Products using a ... [https://pmc.ncbi.nlm.nih.gov/articles/PMC3407816/]
- 33. Recent advances in lipophilicity measurement by reversed- ... [https://www.sciencedirect.com/science/article/abs/pii/S0165993615000655]
- 34. Test No. 117: Partition Coefficient (n-octanol/water), HPLC ... [https://www.oecd.org/en/publications/2022/06/test-no-117-partition-coefficient-n-octanol-water-hplc-method_g1gh28e7.html]
- 35. OECD Laboratory Intercomparison Test on the HPLC method [https://www.sciencedirect.com/science/article/abs/pii/0045653588902275]
- 36. Test No. 121: Estimation of the Adsorption Coefficient (Koc ... [https://www.oecd.org/en/publications/2001/01/test-no-121-estimation-of-the-adsorption-coefficient-koc-on-soil-and-on-sewage-sludge-using-high-performance-liquid-chromatography-hplc_g1gh28ef.html]
- 37. Thermodynamic modelling of solubility and preferential ... [https://pmc.ncbi.nlm.nih.gov/articles/PMC7126742/]
- 38. Using solvatochromic probes to investigate intermolecular ... [https://www.sciencedirect.com/science/article/abs/pii/S0167732218325522]
- 39. Biomimetic Chromatography to Accelerate Drug Discovery [https://www.chromatographyonline.com/view/biomimetic-chromatography-accelerate-drug-discovery-part-i]
- 40. Biomimetic chromatography—A novel application of the ... [https://pmc.ncbi.nlm.nih.gov/articles/PMC10989578/]
- 41. Biomimetic separations in chemistry and life sciences - PMC [https://pmc.ncbi.nlm.nih.gov/articles/PMC11794418/]
- 42. Comprehensive two-dimensional liquid chromatography as ... [https://www.sciencedirect.com/science/article/abs/pii/S0003267020310990]
- 43. Comparison of the Utility of RP-TLC Technique and Different ... [https://pmc.ncbi.nlm.nih.gov/articles/PMC6749294/]
- 44. HPLC 2025 Preview: The Road To Sustainable Analytical ... [https://www.chromatographyonline.com/view/hplc-2025-preview-the-road-to-sustainable-analytical-chemistry]
- 45. A Three-Pronged Template Approach for Rapid HPLC ... [https://www.chromatographyonline.com/view/three-pronged-template-approach-rapid-hplc-method-development-0]
- 46. Rapid High Performance Liquid Chromatography ... [https://www.sciencedirect.com/science/article/pii/S2772391725000702]
- 47. High-Throughput Liquid Chromatographic Analysis Using ... [https://pmc.ncbi.nlm.nih.gov/articles/PMC11027085/]
- 48. Stationary Phases for Modern Thin-Layer Chromatography [https://www.chromatographyonline.com/view/stationary-phases-modern-thin-layer-chromatography]
- 49. Tips & Tricks for Thin-Layer Chromatography [https://www.sigmaaldrich.com/US/en/technical-documents/technical-article/analytical-chemistry/thin-layer-chromatography/tips-n-tricks-for-thin-layer-chromatography?srsltid=AfmBOoqL8JuWVLtZoCjjdPhlmWP2JImaaZbnfPOVr0myOekxs6DvmqKX]
- 50. Lipophilicity Determination of Antifungal Isoxazolo[3,4-b ... [https://pmc.ncbi.nlm.nih.gov/articles/PMC6930598/]
- 51. The spectrophotometric determination of lipophilicity and ... [https://www.sciencedirect.com/science/article/pii/S1386142521009203]
- 52. Analysis of Lipophilicity and Pharmacokinetic Parameters ... [https://www.mdpi.com/1999-4923/16/9/1235]
- 53. Lipophilicity Determination of Quaternary (Fluoro) ... [https://www.mdpi.com/1422-0067/20/21/5288]
- 54. LogD7.4 prediction enhanced by transferring knowledge from ... [https://jcheminf.biomedcentral.com/articles/10.1186/s13321-023-00754-4]
- 55. LogP, LogD, pKa and LogS: A Physicists guide to basic ... [https://doktormike.gitlab.io/posts/navigating-logp-logd-pka-and-logs-a-physicists-guide/]
- 56. LogP and logD calculations [https://docs.chemaxon.com/display/docs/logp-and-logd-calculations.md]
- 57. Ion Pair Chromatography – How IPC Works, Strengths ... [https://www.technologynetworks.com/analysis/articles/ion-pair-chromatography-how-ipc-works-strengths-limitations-and-applications-358440]
- 58. Understanding the fundamentals of the on-off retention ... [https://www.sciencedirect.com/science/article/pii/S0021967324008975]
- 59. Limits of rapid log P determination methods for highly ... [https://www.sciencedirect.com/science/article/abs/pii/S0003267016301908]
- 60. 2025 HPLC Column and Accessories Review [https://www.chromatographyonline.com/view/innovations-in-liquid-chromatography-2025-hplc-column-and-accessories-review]
- 61. Use of TLC and Computational Methods to Determine ... [https://www.mdpi.com/1424-8247/18/9/1255]
- 62. Overcoming Common Challenges in Ion Chromatography ... [https://www.inorganicventures.com/blog/news/overcoming-common-challenges-ion-chromatography-analysis]
- 63. Common Sources Of Error in Gas Chromatography - Blogs [https://www.alwsci.com/news/common-sources-of-error-in-gas-chromatography-84526833.html]
- 64. Troubleshooting Peak Retention Time Shifts and Non- ... [https://community.agilent.com/knowledge/lc-portal/kmp/lc-articles/kp1561.troubleshooting-peak-retention-time-shifts-and-non-reproducibility-in-lc-systems]
- 65. Optimize HPLC Mobile Phase for Reproducibility [https://eureka.patsnap.com/report-optimize-hplc-mobile-phase-for-reproducibility]
- 66. HPLC 2025 Preview: The Present and Future of ... [https://www.chromatographyonline.com/view/hplc-2025-preview-the-present-and-future-of-automation-in-analytical-laboratories]
- 67. How to Select a Reproducible Starting Point in HPLC ... [https://www.sepscience.com/how-to-select-a-reproducible-starting-point-in-hplc-method-development-6892]
- 68. Setup and validation of shake-flask procedures for the ... [https://www.sciencedirect.com/science/article/abs/pii/S0928098715002043]
- 69. Setup and validation of shake-flask procedures for the ... [https://pubmed.ncbi.nlm.nih.gov/25968358/]
- 70. 2.3.2. Lipophilicity Study [https://bio-protocol.org/exchange/minidetail?id=12339433&type=30]
- 71. Online OCHEM multi-task model for solubility and ... [https://www.sciencedirect.com/science/article/pii/S0162013425000704]
- 72. COMPARISON OF RP-HPLC AND UV ... [https://jddtonline.info/index.php/jddt/article/view/1973]
- 73. Development and validation of a novel isocratic RP-HPLC ... [https://www.sciencedirect.com/science/article/pii/S092809872500274X]
- 74. A Comprehensive Review of RP-HPLC In Bioanalytical ... [https://www.ijsrtjournal.com/article/A+Comprehensive+Review+of+RPHPLC+In+Bioanalytical+Method+Validation+and+Sample+Preparation]
- 75. Development and Validation of a High-Performance Liquid ... [https://pmc.ncbi.nlm.nih.gov/articles/PMC6136501/]
- 76. Validation of a Reversed-Phase HPLC Method for ... [https://pmc.ncbi.nlm.nih.gov/articles/PMC2291777/]
- 77. In Silico High-Performance Liquid Chromatography ... [https://pmc.ncbi.nlm.nih.gov/articles/PMC11983366/]
- 78. Chromatography Data Systems: Perspectives, Principles, ... [https://www.chromatographyonline.com/view/chromatography-data-systems-perspectives-principles-and-trends]
- 79. Analytical Method Validation: Back to Basics, Part II [https://www.chromatographyonline.com/view/analytical-method-validation-back-basics-part-ii]
- 80. 3.1. Linearity – Validation of liquid chromatography mass ... [https://sisu.ut.ee/lcms_method_validation/31-linearity/]
- 81. 4.1. Repeatability, intermediate precision and reproducibility [https://sisu.ut.ee/lcms_method_validation/41-precision-trueness-accuracy/]
- 82. Reproducibility: What is it and How to Calculate it [https://www.isobudgets.com/reproducibility/]
- 83. Method Validation and Robustness | LCGC International [https://www.chromatographyonline.com/view/method-validation-and-robustness]
- 84. Limit of Blank, Limit of Detection and Limit of Quantitation [https://pmc.ncbi.nlm.nih.gov/articles/PMC2556583/]
- 85. Limit of Quantitation - an overview [https://www.sciencedirect.com/topics/nursing-and-health-professions/limit-of-quantitation]
- 86. Determining LOD and LOQ Based on the Calibration Curve [https://www.sepscience.com/hplc-solutions-126-chromatographic-measurements-part-5-determining-lod-and-loq-based-on-the-calibration-curve-6959]