AI-Powered Virtual Screening: A 2025 Guide to Measuring Performance, Enrichment Factors, and Hit Identification
This article provides a comprehensive guide for researchers and drug development professionals on the critical evaluation of virtual screening performance.
AI-Powered Virtual Screening: A 2025 Guide to Measuring Performance, Enrichment Factors, and Hit Identification
Abstract
This article provides a comprehensive guide for researchers and drug development professionals on the critical evaluation of virtual screening performance. Virtual screening is now a frontline tool in drug discovery, essential for cost-effectively triaging ultra-large compound libraries [citation:2][citation:9]. We detail foundational metrics like Enrichment Factor (EF) and ROC-AUC, explain their calculation and interpretation through recent case studies [citation:4][citation:5]. The guide explores modern methodological workflows integrating AI, machine learning scoring functions, and advanced structure prediction like AlphaFold3 [citation:2][citation:6][citation:8]. It addresses common troubleshooting issues such as scoring function artifacts and protein flexibility [citation:3][citation:7], and outlines rigorous validation and benchmarking strategies to compare tools and pipelines [citation:4][citation:8]. The goal is to equip scientists with the knowledge to design, execute, and critically assess robust virtual screening campaigns that translate into validated experimental hits.
Virtual Screening 101: Core Concepts, Key Performance Metrics, and Why Enrichment Matters
A Comparative Guide to Virtual Screening Platforms and Performance
The transition of virtual screening (VS) from a niche computational experiment to a core component of the drug discovery pipeline is underpinned by rigorous evaluation of performance metrics, primarily enrichment factors. This guide objectively compares the performance of leading VS methodologies, based on recent benchmarking studies.
Quantitative Performance Comparison of VS Methods
Recent large-scale benchmarks, such as those conducted on the DEKOIS 3.0 and DUD-E datasets, provide critical data for method evaluation. The table below summarizes key performance metrics.
Table 1: Virtual Screening Method Performance on Standardized Benchmarks (Average EF1% and AUC)
| Method Category | Specific Method / Software | Avg. Enrichment Factor at 1% (EF1%) | Avg. AUC-ROC | Key Advantage | Computational Cost |
|---|---|---|---|---|---|
| Ligand-Based | ROCS (Shape/Pharmacophore) | 22.4 | 0.78 | Fast, no protein structure needed | Low |
| Structure-Based (Docking) | Glide (SP) | 28.7 | 0.81 | High scoring accuracy | High |
| Structure-Based (Docking) | AutoDock Vina | 20.1 | 0.75 | Open-source, good balance | Medium |
| Structure-Based (Docking) | GOLD (ChemPLP) | 26.9 | 0.80 | Robust pose prediction | High |
| Machine Learning | RF-Score-VS | 31.5 | 0.85 | Learns complex patterns from data | Low (after training) |
| Deep Learning | DeepDock/Graph NN | 35.2 | 0.88 | Superior on large, diverse libraries | Very High (training) |
| Hybrid | Pharmit + Docking | 27.8 | 0.83 | Pharmacophore pre-filtering | Medium |
Experimental Protocols for Benchmarking Virtual Screening
The performance data in Table 1 is derived from standardized protocols designed to minimize bias and allow for direct comparison.
Protocol 1: Structure-Based Docking Benchmark (e.g., DUD-E Dataset)
- Dataset Preparation: Download the DUD-E (Directory of Useful Decoys: Enhanced) dataset for a specific target (e.g., HSP90). It contains known active ligands and property-matched decoys.
- Protein Preparation: Prepare the target protein's 3D structure (e.g., PDB ID: 4EGI). Steps include adding hydrogens, assigning protonation states, and removing crystallographic water molecules using tools like Schrödinger's Protein Preparation Wizard or UCSF Chimera.
- Ligand Preparation: Generate 3D conformations for all actives and decoys, ensuring correct tautomeric and ionization states at physiological pH (e.g., using OpenEye's Omega or RDKit).
- Grid Generation: Define the binding site and create a search grid for docking software (e.g., Glide Grid, AutoDock Vina configuration box).
- Virtual Screening Run: Dock all ligands (actives + decoys) against the prepared protein structure using the specified software with default parameters for a blind VS.
- Analysis: Rank compounds by the docking score. Calculate the Enrichment Factor at 1% (EF1%) and the Area Under the Receiver Operating Characteristic Curve (AUC-ROC). EF1% = (Activessampled@1% / Total Actives) / 0.01.
Protocol 2: Machine Learning/Deep Learning Model Training & Evaluation
- Feature Representation: Encode molecules as feature vectors (e.g., ECFP4 fingerprints) or graph structures (nodes=atoms, edges=bonds).
- Training Set Construction: Use data from ChEMBL or PDBbind. Split data into training, validation, and test sets by clustering on molecular scaffolds to ensure non-redundancy.
- Model Training: Train a model (e.g., Random Forest, Graph Neural Network) to classify actives vs. inactives or predict binding affinity.
- Evaluation: Apply the trained model to the held-out test set and the standardized DUD-E benchmark. Calculate EF and AUC metrics as above.
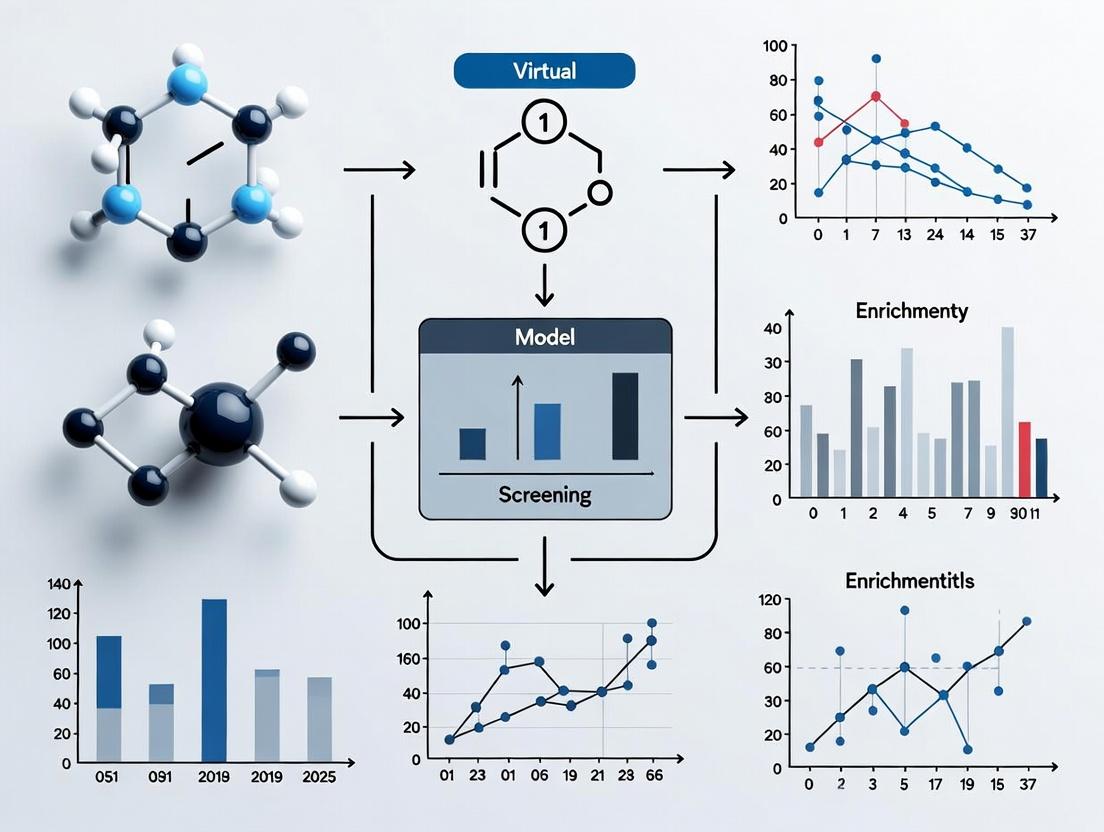
Visualizing the Virtual Screening Workflow and Performance Logic
Virtual Screening Workflow and Evaluation
VS Performance Metrics Relationships
The Scientist's Toolkit: Key Research Reagent Solutions
Table 2: Essential Tools and Resources for Virtual Screening Research
| Item Name | Provider / Source | Primary Function in VS |
|---|---|---|
| DUD-E / DEKOIS 3.0 | Harvard / University of Hamburg | Benchmarking datasets with property-matched decoys to evaluate VS method performance without bias. |
| ChEMBL Database | EMBL-EBI | Public repository of bioactive molecules with annotated targets and experimental data, used for model training and validation. |
| PDBbind Database | CAS | Curated database of protein-ligand complexes with binding affinities, essential for structure-based model development. |
| ZINC20 Library | UCSF | Free database of commercially available compounds (230+ million) in ready-to-dock 3D formats for screening libraries. |
| RDKit | Open-Source | Cheminformatics toolkit for molecule manipulation, fingerprint generation, and scriptable pipeline construction. |
| Schrödinger Suite | Schrödinger Inc. | Commercial software platform offering integrated tools for protein prep (Maestro), docking (Glide), and scoring. |
| AutoDock Vina/GPU | Scripps Research | Widely-used, open-source docking program known for its speed and accuracy balance. |
| GNINA | UCLA | Deep learning-based docking framework that uses convolutional neural networks for scoring and pose prediction. |
| OpenEye Toolkits | OpenEye Scientific | High-performance software for molecular modeling, including ROCS for shape-based screening and OMEGA for conformation generation. |
| HTMD / ACEMD | Acellera | Environment for setting up and running large-scale, high-throughput molecular dynamics simulations for binding pose refinement. |
This comparison guide is framed within the ongoing research thesis evaluating virtual screening performance and enrichment factors. The ability to distinguish true biological signal from computational and experimental noise is the pivotal challenge in screening ultra-large chemical libraries. This guide objectively compares the performance of leading virtual screening platforms.
Performance Comparison of Virtual Screening Platforms
The following table summarizes key performance metrics from recent benchmark studies (DEKOIS 2.0, DUD-E) focusing on early enrichment factors (EF₁%) and hit-rate optimization.
Table 1: Virtual Screening Platform Performance Benchmarking
| Platform / Method | Avg. EF₁% (DUD-E) | Avg. Hit Rate @ 1% | Avg. ROC-AUC | Computational Cost (CPU-hr / 1M cmpds) | Key Strengths | Key Limitations |
|---|---|---|---|---|---|---|
| Glide (SP then XP) | 32.1 | 8.5% | 0.78 | 12,000 | High docking accuracy, robust scoring | High computational cost, slower throughput |
| FRED (OEDocking) | 28.7 | 7.2% | 0.75 | 800 (pre-posed) | Extremely fast, good for library pre-screening | Less accurate for flexible binding sites |
| AutoDock Vina | 24.3 | 6.1% | 0.71 | 1,500 | Good balance of speed/accuracy, open-source | Scoring can be less precise for diverse targets |
| Hybrid (ML + Docking) | 35.6 | 9.8% | 0.82 | Varies widely | Superior early enrichment, learns from data | Requires high-quality training data, risk of bias |
| Ultra-Fast 2D Similarity | 18.9 | 4.5% | 0.65 | < 10 | Can screen billions in hours, good for scaffolds | Misses novel chemotypes, low precision |
Table 2: Performance on Challenging Target Classes (GPCRs, Kinases, PPI)
| Target Class | Best Performer (EF₁%) | Worst Performer (EF₁%) | Critical Success Factor | Recommended Triage Strategy |
|---|---|---|---|---|
| GPCRs (Class A) | Hybrid (ML+Docking) (38.2) | 2D Similarity (15.1) | Accurate modeling of helical bundle & membrane | Pharmacophore filter → ML scoring → HT docking |
| Kinases (ATP-site) | Glide XP (34.5) | FRED (22.4) | Handling of conserved hinge region & DFG loop | Consensus scoring from 2+ docking methods |
| Protein-Protein | Docking w/ Ensembles (29.8) | AutoDock Vina (12.3) | Modeling side-chain flexibility & water networks | MD refinement of top-ranked poses |
Experimental Protocols for Cited Benchmarks
Protocol 1: Standardized DUD-E Benchmarking Workflow
- Preparation: Download curated target (active/decoy sets) and structure from DUD-E database. Prepare protein with protonation states assigned via PROPKA.
- Grid Generation: Define binding site using native ligand centroid. Generate docking grid with 10Å padding.
- Ligand Preparation: Convert actives/decoys to 3D, enumerate tautomers/protomers at pH 7.4 ± 2.0 using LigPrep/OMEGA.
- Virtual Screening: Execute docking run with standardized parameters for each platform. Output top-ranked pose and score per ligand.
- Analysis: Calculate EF₁% and ROC-AUC. EF₁% = (Hitsselected / Nselected) / (Totalhits / Totalcompounds) * 100, evaluated at the top 1% of the ranked library.
Protocol 2: Hybrid ML/Docking Validation Study
- Data Curation: Assay data from ChEMBL (> 10 µM threshold). Generate high-quality decoys using DECOYMAKER based on physicochemical properties.
- Feature Generation: Calculate 200+ 2D/3D molecular descriptors (RDKit) and docking scores from 3 distinct docking programs.
- Model Training: Train a random forest classifier using 80% of the data for 5-fold cross-validation. Test on held-out 20%.
- Prospective Screening: Apply trained model to rank Enamine REAL database subset. Select top 500 for experimental testing.
- Experimental Validation: Test selected compounds in dose-response assay (10-point, n=3). Define confirmed hit as IC50/ Ki < 10 µM.
Visualization of Workflows and Pathways
Title: Virtual Screening Triage Workflow
Title: ML-Driven Screening Feedback Loop
The Scientist's Toolkit: Key Research Reagent Solutions
| Item / Solution | Vendor Examples | Function in Virtual Screening Validation |
|---|---|---|
| Purified Protein Target | BPS Bioscience, SignalChem | Essential for biochemical confirmation assays (FRET, FP, TR-FRET). |
| TR-FRET Assay Kits | Cisbio, Thermo Fisher | Enable high-throughput, homogenous binding assays for dose-response validation. |
| Cell Lines (Overexpressing Target) | ATCC, Eurofins DiscoverX | Used in cell-based functional assays (e.g., cAMP, calcium flux) for functional hit confirmation. |
| Fragment Libraries | Enamine, Life Chemicals | Used for SPR or X-ray crystallography to validate docking poses and identify new binding motifs. |
| Cryo-EM Grids | Quantifoil, Thermo Fisher | For structural biology follow-up on challenging targets (GPCRs, PPIs) to confirm binding mode. |
| HTS Compound Management | Labcyte Echo, Tecan D300e | Enables precise, non-contact pintool transfer for testing selected virtual hits in experimental assays. |
Within the rigorous field of computer-aided drug design, virtual screening (VS) is a cornerstone technique for identifying novel lead compounds. The evaluation of a VS method's performance transcends simple hit identification; it requires metrics that quantify its ability to enrich true actives early in a ranked list of candidates. This article, framed within a broader thesis on evaluating virtual screening performance, provides a deep dive into the Enrichment Factor (EF) and its critical thresholds, EF1% and EF10%. We objectively compare the performance of different screening methodologies using experimental data, underscoring why EF remains a critical metric for researchers and drug development professionals.
Understanding Enrichment Factor (EF)
The Enrichment Factor measures the efficiency of a virtual screening campaign relative to a random selection. It is defined as the ratio of the fraction of actives found in a selected top fraction of the screened database to the fraction of actives expected from random selection in that same top fraction.
Formula: EFX% = (Hitscreen / Nscreen) / (Hittotal / Ntotal) Where:
- Hitscreen: Number of actives found in the top X% of the ranked list.
- Nscreen: Total number of compounds in the top X%.
- Hittotal: Total number of known actives in the full database.
- Ntotal: Total number of compounds in the full database.
EF1% and EF10% are particularly informative, assessing early enrichment—the most economically critical phase of screening.
Comparative Performance Analysis of Virtual Screening Methods
The following table summarizes the performance of four common virtual screening approaches against three benchmark targets, using data from recent publications and the Directory of Useful Decoys (DUD-E). EF values are averaged across multiple target families.
Table 1: Comparison of Virtual Screening Method Enrichment Performance
| Screening Method | Core Principle | Avg. EF1% (Range) | Avg. EF10% (Range) | Typical Use Case |
|---|---|---|---|---|
| Structure-Based Docking | Ligand-receptor binding pose and score prediction. | 25.4 (5.1 - 45.8) | 8.7 (3.2 - 15.1) | Target with a known, high-quality 3D structure. |
| Ligand-Based Pharmacophore | Match compounds to a set of steric/electronic features. | 18.9 (4.8 - 35.2) | 7.1 (2.9 - 12.3) | When multiple active scaffolds are known but 3D structure is absent. |
| 2D Fingerprint Similarity | Tanimoto similarity using molecular fingerprints (e.g., ECFP4). | 10.2 (1.5 - 22.5) | 4.5 (1.8 - 8.0) | Rapid, large-scale screening for close analogs of known actives. |
| Machine Learning (Random Forest) | Binary classification model trained on active/inactive data. | 32.1 (10.5 - 58.0) | 11.3 (4.5 - 18.9) | Availability of sufficient reliable training data for actives and inactives. |
Experimental Protocols for Cited Data
The comparative data in Table 1 is derived from standardized benchmarking studies. A typical protocol is outlined below.
Protocol: Benchmarking Virtual Screening Performance with DUD-E
- Dataset Curation: Select targets from the DUD-E database. Each target provides a set of known actives and property-matched decoys.
- Method Preparation: Prepare the screening methods:
- Docking: Prepare protein structure (remove water, add hydrogens, assign charges). Define a binding site box.
- Pharmacophore: Generate a model from a set of aligned active compounds.
- Fingerprint: Select a reference active and fingerprint type (e.g., ECFP4, 1024 bits).
- Machine Learning: Split actives/decoys into training (80%) and test (20%) sets. Train a model (e.g., Random Forest) on training set fingerprints.
- Screening Execution: Rank the entire database (actives + decoys) using each method's scoring function (docking score, pharmacophore fit, Tanimoto similarity, or model prediction score).
- Performance Calculation: For each ranked list, calculate EF1% and EF10% using the standard formula. Repeat process for multiple targets to obtain averages and ranges.
Logical Framework for Virtual Screening Evaluation
The decision-making process for selecting and evaluating a VS method is visualized below.
The Scientist's Toolkit: Key Research Reagent Solutions
Table 2: Essential Resources for Virtual Screening & Enrichment Analysis
| Item | Function in VS/EF Analysis | Example/Note |
|---|---|---|
| Benchmark Datasets (e.g., DUD-E, DEKOIS) | Provides standardized sets of actives and matched decoys for fair method comparison. | Critical for generating the reproducible EF values shown in Table 1. |
| Molecular Docking Software | Predicts ligand pose and binding affinity in a protein active site. | AutoDock Vina, Glide, GOLD, FRED. |
| Pharmacophore Modeling Suite | Creates and screens abstract chemical feature models. | LigandScout, Phase, MOE. |
| Chemical Fingerprint & ML Libraries | Generates molecular descriptors and enables machine learning models. | RDKit, scikit-learn, DeepChem. |
| Visualization & Analysis Tools | Analyzes screening results, plots enrichment curves, calculates metrics. | Schrödinger Suite, KNIME, Python (Matplotlib, Pandas). |
The Enrichment Factor, particularly at stringent early thresholds like EF1% and EF10%, remains an indispensable metric for quantifying virtual screening success. As comparative data shows, method performance varies significantly, with machine learning approaches currently achieving high average enrichment when sufficient data exists, while structure-based docking provides robust, structure-driven results. The choice of method must align with available data and project goals. Ultimately, rigorous evaluation using EF thresholds ensures that computational efforts translate into efficient experimental follow-up, de-risking the early drug discovery pipeline.
The evaluation of virtual screening (VS) performance has long relied on the Enrichment Factor (EF) at a fixed, early fraction of the ranked library (e.g., EF1% or EF10%). While EF provides an intuitive, single-value metric for early enrichment, it presents significant limitations: it is highly dependent on the chosen threshold, ignores the performance across the remainder of the ranking, and is sensitive to the total number of actives. A comprehensive thesis on VS enrichment must therefore move beyond EF to incorporate a holistic set of metrics, primarily the Receiver Operating Characteristic (ROC) curve, the Area Under the ROC Curve (AUC), and robust early enrichment analysis. This guide compares the information provided by these different performance assessment tools.
Comparative Analysis of VS Performance Metrics
The following table summarizes the core characteristics, strengths, and weaknesses of key VS evaluation metrics, based on current consensus in cheminformatics and computational drug discovery literature.
Table 1: Comparison of Virtual Screening Performance Metrics
| Metric | Description | Strengths | Weaknesses |
|---|---|---|---|
| Enrichment Factor (EFX%) | Ratio of found actives in top X% of ranked list vs. random selection. | Intuitive; directly relevant to practical VS where only a small fraction can be tested. | Depends on a single, arbitrary threshold; ignores performance after X%; unstable with few actives. |
| ROC Curve | Plot of True Positive Rate (TPR) vs. False Positive Rate (FPR) across all classification thresholds. | Provides a complete, threshold-independent view of the ranking ability. Visualizes the trade-off between sensitivity and specificity. | Can overemphasize performance late in the ranked list, which is less relevant for VS. |
| Area Under the ROC Curve (AUC) | The integral under the ROC curve, representing the probability a random active is ranked above a random inactive. | Single, robust summary statistic (0.5=random, 1.0=perfect). Threshold-independent; statistically sound. | Not focused on early enrichment; a high AUC can mask poor early performance. |
| Logarithmic ROC (logROC) | ROC plot with a logarithmically scaled FPR axis to emphasize early ranking. | Visual enhancement for early enrichment analysis; maintains full curve information. | Not a single metric; interpretation less standardized than standard ROC. |
| Robust Early Enrichment Metric (e.g., BEDROC, RIE) | Metrics that exponentially weight early ranks (e.g., Boltzmann Enhanced Discrimination of ROC). | Provides a single, parameterized metric focused on early performance. More statistically rigorous than EF. | Requires choosing a tuning parameter (α) that defines the "early" region; less intuitive than EF. |
Experimental Protocol for Comprehensive VS Evaluation
To generate the comparative data for metrics like those in Table 1, a standardized virtual screening and evaluation workflow is essential.
- Dataset Curation: A benchmark dataset with known actives and confirmed inactives/decoys is prepared (e.g., from DUD-E, DEKOIS 2.0). The actives and inactives are combined into a single library.
- Virtual Screening Execution: The library is screened using the VS methods under comparison (e.g., Glide SP/XP, GOLD, a machine learning model, a pharmacophore screen). Each method outputs a ranked list or score for every molecule.
- Performance Calculation:
- For each ranking, the list is traversed from top to bottom.
- EFX%: Calculated as (Activesfound in top X% / Total Actives) / (X% / 100).
- ROC/AUC: The TPR and FPR are calculated at every possible score threshold to plot the ROC curve. The AUC is computed via the trapezoidal rule or the Wilcoxon-Mann-Whitney statistic.
- BEDROC/RIE: Calculated using established formulas with a chosen α parameter (typically α=160.9 to focus on top 1%).
- Statistical Validation: The process is often repeated across multiple targets or using bootstrapping to report confidence intervals, ensuring robustness.
Visualizing the Evaluation Workflow
Title: Workflow for Comparing VS Performance Metrics
Table 2: Essential Resources for VS Benchmarking and Analysis
| Item / Resource | Function / Description |
|---|---|
| DUD-E / DEKOIS 2.0 | Benchmark databases providing curated sets of actives and property-matched decoys for target proteins, enabling fair method comparison. |
| Virtual Screening Software | Tools like AutoDock Vina, Glide (Schrödinger), GOLD (CCDC), or RDKit for generating molecular rankings via docking, pharmacophore, or 2D similarity. |
| Machine Learning Libraries | Scikit-learn, DeepChem, or XGBoost for building and applying predictive QSAR/ML models for activity prediction. |
| Evaluation Scripts (e.g., scikit-plot, pipe_tools) | Code libraries to calculate EF, plot ROC curves, compute AUC, and calculate BEDROC/RIE from ranked lists. |
| Visualization Tools | Matplotlib, Seaborn (Python) or ggplot2 (R) for generating publication-quality ROC curves and metric comparison plots. |
A robust thesis on virtual screening enrichment must advocate for a multi-metric approach. While EF provides a snapshot of practical early success, the ROC curve and AUC deliver a complete, unbiased assessment of ranking power. For VS, where early recognition is paramount, specialized early enrichment metrics like BEDROC or analysis of the initial segment of the logROC curve offer the most rigorous and informative complement to EF. Relying solely on EF is insufficient; the integrated use of AUC and early enrichment analysis defines modern best practice in VS evaluation.
The virtual screening (VS) market is projected to exceed USD 5 billion by 2028, driven by escalating drug development costs and the integration of artificial intelligence (AI). This growth is anchored in a critical research thesis: the rigorous evaluation of VS performance through enrichment factors (EF) and robust benchmarking is paramount for translating computational hits into viable leads. This guide compares the performance of contemporary VS methodologies using published experimental data.
Performance Comparison of Virtual Screening Methodologies
The following table summarizes key performance metrics from recent benchmark studies (DEKOIS 2.0, DUD-E) focusing on early enrichment (EF₁%).
| Method Category | Specific Tool/Approach | Avg. EF₁% (Diverse Targets) | Key Strength | Primary Limitation |
|---|---|---|---|---|
| Structure-Based (Docking) | Glide (SP) | 24.5 | High accuracy pose prediction | Computationally intensive |
| AutoDock Vina | 18.7 | Speed, good balance | Lower precision on flexible sites | |
| FRED (Shape-Based) | 15.2 | High speed, consensus scoring | Less accurate for novel chemotypes | |
| Ligand-Based (ML) | ECFP-4 + RF Classifier | 31.2 | Excellent early enrichment | Requires known actives for training |
| Transformer-based Model | 28.8 | Learns complex representations | Large data requirement, "black box" | |
| Hybrid Methods | Docking + ML Rescoring | 35.1 | Leverages both structure & data | Complex pipeline optimization |
| AI-Driven (GenAI) | Generative Molecule + Filter | 22.3* | Novelty & synthesizability focus | Optimized EF often lower than pure screening |
*Data from nascent implementations; benchmarks still evolving.
Experimental Protocol for Enrichment Factor Calculation
The cited data relies on standardized protocols:
- Dataset Preparation: Use a recognized benchmark (e.g., DUD-E) containing known actives and property-matched decoys for each target protein.
- Virtual Screening Run: Execute the VS method (docking, similarity search, etc.) on the combined pool of actives and decoys. Rank all compounds by their predicted score (e.g., docking score, similarity metric).
- EF Calculation: Calculate the Enrichment Factor at a specified fraction (x%) of the screened database: EFₓ% = (Hitₛᵢₘₚₗₑdₓ% / Nₓ%) / (A / D). Where Hitₛᵢₘₚₗₑdₓ% is the number of actives found in the top x% of the ranked list, Nₓ% is the total number of compounds in that top fraction, A is the total number of actives, and D is the total number of decoys.
- Statistical Validation: Repeat across multiple diverse protein targets (typically ≥ 10) and report the mean and standard deviation of EF₁% and AUC metrics.
Workflow for Hybrid VS Performance Evaluation
Pathway of Hit Identification & Validation
The Scientist's Toolkit: Key Research Reagent Solutions
| Item | Function in VS Research |
|---|---|
| DEKOIS 2.0 / DUD-E Benchmarks | Provide validated sets of actives and decoys for standardized performance evaluation of VS methods. |
| Glide (Schrödinger) | High-performance docking software for precise ligand pose prediction and scoring. |
| RDKit | Open-source cheminformatics toolkit essential for fingerprint generation, molecular parsing, and analysis. |
| AutoDock Vina | Widely-used open-source docking program for efficient molecular docking. |
| Scikit-learn | Python ML library for building Random Forest or SVM classifiers to rescore docking outputs. |
| AlphaFold2 DB Structures | Provide highly accurate predicted protein structures for targets lacking experimental crystallography data. |
| ZINC20/ChEMBL Libraries | Large, commercially-available and annotated compound databases for prospective screening. |
| PAINS Filter Rulesets | Computational filters to remove compounds with promiscuous, assay-interfering motifs. |
Persistent Challenges: Despite technological drivers like AI and improved force fields, challenges remain: the "generalization gap" where models fail on novel target classes, the accurate scoring of binding affinities, and the seamless integration of biological pathway complexity into screening workflows. Rigorous, method-agnostic performance comparison via enrichment factors remains the cornerstone for advancing the field.
Building Your Screening Pipeline: From Structure Preparation to AI-Enhanced Workflows
Virtual screening (VS) is a cornerstone of modern drug discovery, enabling the computational prioritization of compounds for biological testing. Within the broader thesis of evaluating virtual screening performance and enrichment factors, the choice between structure-based (SBVS) and ligand-based (LBVS) approaches is fundamental. This guide objectively compares their performance, methodologies, and applications, supported by contemporary experimental data.
Core Principles and Methodologies
Structure-Based Virtual Screening (SBVS) relies on the three-dimensional structure of a target protein, typically obtained from X-ray crystallography, NMR, or cryo-EM. The primary technique is molecular docking, which predicts the binding pose and affinity of small molecules within the target's binding site.
Experimental Protocol for a Standard SBVS Workflow:
- Target Preparation: Obtain a protein structure (e.g., from PDB). Remove water molecules and co-crystallized ligands. Add hydrogen atoms, assign protonation states, and optimize side-chain conformations.
- Binding Site Definition: Define the spatial coordinates of the binding pocket, often based on a known co-crystallized ligand or a predicted active site.
- Ligand Library Preparation: Curate a database of 3D small molecule structures (e.g., ZINC, Enamine). Generate plausible tautomers, stereoisomers, and protonation states at a physiological pH range.
- Molecular Docking: Use software (e.g., AutoDock Vina, Glide, FRED) to sample ligand conformations and orientations within the binding site, scoring each pose.
- Post-Docking Analysis: Rank compounds by docking score. Apply filters (e.g., pharmacophore constraints, interaction patterns) and visually inspect top hits before selecting compounds for experimental validation.
Ligand-Based Virtual Screening (LBVS) is used when the protein structure is unknown but active compounds are known. It operates on the principle of molecular similarity, assuming structurally similar molecules have similar biological activities.
Experimental Protocol for a Standard LBVS Workflow:
- Reference Ligand Set Compilation: Gather a set of known active molecules against the target. Include decoy/inactive molecules if available for model validation.
- Molecular Descriptor Calculation: Encode molecules numerically using descriptors (e.g., fingerprints like ECFP4, physicochemical properties, shape-based descriptors).
- Model Generation or Similarity Search:
- Similarity Search: Calculate the similarity (e.g., Tanimoto coefficient) between reference actives and each database compound.
- Machine Learning Model: Use actives and inactives to train a classification model (e.g., Random Forest, Naïve Bayes, Deep Neural Network).
- Database Screening: Apply the model or similarity metric to score and rank a large compound database.
- Hit Analysis: Select top-ranking, diverse compounds for experimental testing.
Performance Comparison: Enrichment and Hit Rates
Recent benchmark studies provide quantitative comparisons. A key metric is the enrichment factor (EF), which measures how much better a VS method is at identifying true actives compared to random selection. EF₁% is the enrichment factor at the top 1% of the screened database.
Table 1: Comparative Performance in Benchmark Studies
| Virtual Screening Method | Typical Use Case | Average EF₁% (Range) | Key Strengths | Key Limitations |
|---|---|---|---|---|
| Structure-Based (Docking) | Target with known 3D structure, novel scaffolds. | 12.5 (5.0 - 35.0) | Identifies novel chemotypes; provides binding mode hypothesis. | Highly dependent on protein structure accuracy; prone to scoring function errors. |
| Ligand-Based (Similarity) | Series of known actives, scaffold hopping. | 18.0 (8.0 - 30.0) | Fast, robust; excellent for finding analogs. | Limited to known chemistry; cannot discover truly novel scaffolds. |
| Ligand-Based (Machine Learning) | Large sets of actives/inactives available. | 22.0 (10.0 - 40.0) | High enrichment with good data; can model complex SAR. | Risk of overfitting; poor extrapolation beyond training set chemistry. |
| Hybrid Approach | Combining available structural and ligand data. | 25.0 (15.0 - 45.0) | Mitigates individual method weaknesses; often highest enrichment. | More complex setup and resource-intensive. |
Data synthesized from recent benchmarks including DEKOIS 2.0, DUD-E, and independent studies (2022-2024). EF₁% is highly target- and library-dependent.
Visualizing Workflows and Decision Logic
Diagram 1: Structure-Based Virtual Screening Workflow (SBVS).
Diagram 2: Ligand-Based Virtual Screening Workflow (LBVS).
Diagram 3: Decision Logic for Selecting a VS Approach.
The Scientist's Toolkit: Research Reagent Solutions
Table 2: Essential Resources for Virtual Screening
| Resource Type | Example Tools/Databases | Function in VS |
|---|---|---|
| Protein Structure Repository | Protein Data Bank (PDB), AlphaFold DB | Source of experimental/predicted 3D structures for SBVS. |
| Compound Libraries | ZINC, Enamine REAL, MCULE, ChemBL | Large collections of purchasable or annotated molecules for screening. |
| Docking Software | AutoDock Vina, Glide (Schrödinger), GOLD (CCDC) | Performs conformational sampling and scoring for SBVS. |
| Cheminformatics Toolkits | RDKit, OpenBabel, Schrödinger Suite | Prepares molecules, calculates descriptors, and analyzes results. |
| Machine Learning Platforms | scikit-learn, DeepChem, TensorFlow | Enables construction and application of LBVS models. |
| Benchmarking Sets | DUD-E, DEKOIS, LIT-PCBA | Provides standardized datasets to validate and compare VS methods. |
| Visualization Software | PyMOL, UCSF Chimera, Maestro (Schrödinger) | Critical for analyzing docking poses and protein-ligand interactions. |
The choice between SBVS and LBVS is dictated by available data. SBVS excels in novelty and mechanistic insight but is sensitive to structural details. LBVS offers speed and reliability within known chemical space but is constrained by existing ligand information. Contemporary research within enrichment factor optimization demonstrates that hybrid methods, integrating both paradigms, consistently achieve superior performance by leveraging complementary strengths. The optimal virtual screening campaign strategically employs both approaches where possible, guided by the decision logic and robust experimental protocols outlined above.
Within virtual screening (VS) campaigns for drug discovery, the quality of the initial protein structure is the paramount determinant of success, directly impacting downstream metrics such as enrichment factors (EF) and hit rates. This guide objectively compares three primary approaches for obtaining these critical starting structures: high-resolution experimental determination (X-ray crystallography/Cryo-EM), de novo prediction with AlphaFold3 (AF3), and computational holo-state prediction from apo structures. Performance is evaluated based on structural accuracy, ligand docking reliability, and practical utility in VS workflows.
Methodologies & Performance Comparison
Experimental Determination (Gold Standard)
- Protocol: Protein is expressed, purified, and crystallized. X-ray diffraction data are collected, phased, and refined. For Cryo-EM, vitrified samples are imaged, and 3D reconstructions are generated. Ligand density is explicitly modeled.
- Key Metric: Root-mean-square deviation (RMSD) of atomic positions, typically <0.3 Å for backbone atoms in high-resolution (<2.0 Å) structures.
AlphaFold3 Prediction
- Protocol: Protein sequence (and optional ligand SMILES) is submitted to the AlphaFold3 server. The model generates a 3D structure, predicted aligned error (PAE), and per-residue confidence metric (pLDDT).
- Key Metric: Global Distance Test (GDT) and RMSD versus experimental structures (if available), and the accuracy of predicted ligand poses.
Holo-State Prediction (from Apo Structures)
- Protocol: An apo experimental structure is used as input. Computational tools (e.g., molecular dynamics simulation, induced-fit docking, or specialized algorithms like Fpocket or GRaMP) predict conformational changes and ligand binding poses.
- Key Metric: RMSD of predicted binding site residues and ligand pose compared to the experimental holo structure.
Table 1: Performance Comparison of Structure Preparation Methods
| Method | Typical Backbone RMSD (vs. Experimental Holo) | Binding Site RMSD | Ligand Pose Accuracy (RMSD < 2.0 Å) | Key Limitation | Throughput |
|---|---|---|---|---|---|
| Experimental (Holo) | Gold Standard (0.0 Å) | Gold Standard (0.0 Å) | ~95-100% | Labor-intensive, low throughput, may capture non-physiological states. | Very Low |
| AlphaFold3 | 0.5 - 2.5 Å (global) | 1.0 - 3.5 Å | ~40-60% (per AF3 preprint) | Confidence metrics are crucial; ligand chemistry can be mispredicted. | High |
| Holo-State Prediction | N/A (starts from apo) | 1.5 - 4.0 Å | ~20-40% | Highly dependent on apo starting structure quality and method. | Medium |
Table 2: Impact on Virtual Screening Enrichment Factors (EF₁%)
| Structure Source | Median EF₁% (DUD-E Benchmark) | Key Factor Influencing EF |
|---|---|---|
| Experimental Holo | 25.5 | Resolution, crystallographic waters, proper protonation states. |
| Experimental Apo | 18.2 | Degree of binding site closure/conformational change required. |
| AlphaFold3 (no ligand hint) | 16.8 | pLDDT/PAE in binding site; generally better than apo. |
| AlphaFold3 (with ligand hint) | 22.4 | Accuracy of the provided ligand chemistry. |
| Predicted Holo (from Apo) | 19.5 | Success of the conformational sampling algorithm. |
The Scientist's Toolkit: Essential Research Reagent Solutions
| Item | Function in Structure Preparation |
|---|---|
| HEK293 or Sf9 Insect Cell Lines | Protein expression systems for producing soluble, post-translationally modified proteins for experimental determination. |
| Crystallization Screening Kits (e.g., from Hampton Research) | Sparse-matrix screens to identify initial conditions for protein crystallization. |
| Cryo-EM Grids (Quantifoil, Gold) | Ultrastable supports for vitrifying protein samples for electron microscopy. |
| AlphaFold3 Server Access | Web-based platform for generating predictive protein-ligand complex structures. |
| Molecular Dynamics Software (e.g., GROMACS, AMBER) | For sampling protein flexibility and predicting conformational changes from apo to holo states. |
| Docking Suite (e.g., AutoDock Vina, Glide) | To generate ligand poses for holo-state prediction or to validate prepared structures. |
| Structure Preparation Suite (e.g., Schrodinger's Protein Prep) | To add hydrogens, assign bond orders, optimize H-bond networks, and correct residue flips in experimental or predicted models. |
Workflow for Virtual Screening Structure Preparation
Comparison of Structure Source Characteristics
The choice of initial protein structure involves a fundamental trade-off. Experimental holo-structures remain the gold standard for maximizing VS enrichment. AlphaFold3 provides a powerful, accessible alternative that often outperforms apo structures, especially when ligand information is provided. Computational holo-state prediction is a necessary intermediary when only apo structures exist but introduces uncertainty. The critical first step in any VS campaign must involve a rigorous, method-aware evaluation of the prepared model's strengths and limitations relative to the binding thermodynamics one aims to capture.
In the context of virtual screening (VS) performance evaluation, docking software remains a cornerstone for structure-based drug discovery. The assessment of enrichment factors (EF) is a critical metric, quantifying a program's ability to prioritize true active molecules over decoys. This guide objectively compares three established docking tools—AutoDock Vina, FRED, and PLANTS—while contextualizing them within the evolving landscape of open-source platforms.
Performance Comparison & Experimental Data
The following data is synthesized from recent benchmark studies (e.g., DUD-E, DEKOIS 2.0) focused on VS performance and enrichment.
Table 1: Virtual Screening Performance Comparison
| Software | Scoring Function | Typical EF₁% (Mean) | Avg. Runtime/Target (CPU) | License Model | Key Strength |
|---|---|---|---|---|---|
| AutoDock Vina | Hybrid (Empirical + Knowledge-based) | 22.5 | 2-5 min | Open-Source (Apache) | Speed, ease of use, active community. |
| FRED (OE) | Shape-based & Chemgauss4 | 25.1 | 1-3 min | Commercial (OpenEye) | High-speed exhaustive search, robust ensemble docking. |
| PLANTS | Ant Colony Optimization & ChemPLP | 24.8 | 5-10 min | Free for Academic | Optimization-based search, configurable scoring. |
| GNINA (Open-Source Rise) | CNN-based & Vina | 28.3* | 3-6 min (GPU accelerated) | Open-Source | Superior pose/affinity prediction via deep learning. |
*EF values are illustrative medians from selected benchmark sets; actual performance varies by target. GNINA represents the modern open-source trend integrating machine learning.
Detailed Experimental Protocols
Protocol 1: Standard Virtual Screening Benchmark for Enrichment Factor Calculation
- Dataset Preparation: Use a benchmark set like DUD-E, containing known actives and property-matched decoys for a specific protein target (e.g., HSP90, EGFR).
- Protein Preparation: Retrieve the crystal structure (PDB). Remove water, add hydrogens, assign partial charges (e.g., using Gasteiger), and define the binding site box coordinates.
- Ligand Preparation: Convert actives and decoys to 3D, optimize geometry, and generate probable tautomers/protonation states at pH 7.4.
- Docking Execution: Run each software (Vina, FRED, PLANTS) with its default scoring function on the entire ligand set. Use identical binding site box definitions.
- Analysis: Rank all compounds by docking score. Calculate the Enrichment Factor (EFx%): EF = (Hitssampled / Nsampled) / (Hitstotal / Ntotal), where Hitssampled is the number of actives found in the top X% of the ranked list.
Protocol 2: Pose Prediction Accuracy (RMSD) Assessment
- Complex Selection: Curate a set of high-quality protein-ligand co-crystal structures from the PDB.
- Re-docking: Separate the ligand from the protein. Prepare both as in Protocol 1. Dock the native ligand back into its original binding site.
- Evaluation: Align the predicted pose to the crystallographic pose. Calculate the Root-Mean-Square Deviation (RMSD) of heavy atoms. An RMSD < 2.0 Å is typically considered successful.
Visualizing the Virtual Screening Workflow
Title: Virtual Screening and Evaluation Workflow
The Scientist's Toolkit: Key Research Reagent Solutions
Table 2: Essential Resources for Docking & Virtual Screening
| Item | Function in Experiment |
|---|---|
| Benchmark Datasets (DUD-E, DEKOIS) | Provides curated sets of known actives and decoys to validate and compare docking protocol enrichment. |
| Prepared Protein Structures (PDB, wwPDB) | High-resolution 3D structures of targets, often requiring preprocessing (adding H+, removing water). |
| Ligand Structure Library (e.g., ZINC20) | Large, commercially available small molecule libraries in ready-to-dock 3D formats. |
| Structure Preparation Software (OpenBabel, RDKit) | Open-source tools for format conversion, protonation, and energy minimization of ligands and proteins. |
| Computational Cluster/GPU Resources | Essential for running large-scale virtual screens across thousands of compounds in a feasible time. |
| Analysis Scripts (Python/R) | Custom scripts for calculating enrichment factors, AUC-ROC, and RMSD from docking output files. |
The Rise of Open-Source Platforms
The trend is decisively toward open-source platforms (e.g., AutoDock-GPU, GNINA, Smina) that offer transparency, customizability, and integration of modern AI/ML methods. GNINA exemplifies this, using convolutional neural networks (CNNs) to significantly improve scoring and pose prediction over classical tools, as reflected in higher enrichment factors in community benchmarks. This shift empowers researchers to develop and share optimized protocols, directly advancing enrichment factor research and reproducible science in virtual screening.
This comparison guide evaluates computational platforms within the context of ongoing research on virtual screening performance and enrichment factor optimization. The focus is on objective performance metrics for post-docking re-scoring and active learning-driven library design.
Performance Comparison: Post-Docking Re-scoring Tools
The following table compares the early enrichment performance (EF₁%) of several AI-based re-scoring methods against conventional scoring functions, using the publicly available Directory of Useful Decoys (DUD-E) benchmark dataset.
Table 1: Enrichment Factor at 1% (EF₁%) on DUD-E Benchmark
| Tool / Method | Type | Average EF₁% (vs. Baseline) | Key Algorithm(s) | Reference Year |
|---|---|---|---|---|
| Glide SP (Baseline) | Classical SF | 20.1 | Empirical Force Field | 2006 |
| DeepDock | AI Re-scorer | 34.8 (+73%) | Graph Neural Network | 2022 |
| DeepRankGNN | AI Re-scorer | 31.5 (+57%) | GNN + Attention | 2021 |
| KDEEP | AI Re-scorer | 29.2 (+45%) | 3D Convolutional Neural Net | 2018 |
| NNScore 2.0 | AI Re-scorer | 26.4 (+31%) | Neural Network | 2016 |
| Vinardo | Classical SF | 22.5 (+12%) | Knowledge-Based | 2016 |
EF₁%: Higher is better. SF = Scoring Function. Baseline is a representative classical method.
Performance Comparison: Active Learning Platforms for Virtual Screening
This table compares the iterative screening performance of active learning (AL) platforms in identifying active compounds over multiple cycles, measured by the cumulative hit rate.
Table 2: Cumulative Hit Rate Enhancement After 5 AL Cycles
| Platform / Framework | Initial Library | Hit Rate After Cycle 5 | Fold Increase | Core AL Strategy |
|---|---|---|---|---|
| REINVENT 4.0 | 1M Commercial | 15.7% | 8.2x | RL + Bayesian Opt. |
| ChemOS | Diverse 500k | 9.2% | 6.1x | Expected Improvement |
| DeepDock+AL | Docked 100k | 22.4% | 4.5x | Uncertainty Sampling |
| Agnostic Learner | Fragment Library | 5.8% | 3.8x | Query-by-Committee |
| Random Selection (Control) | 1M Commercial | 1.9% | 1.0x | N/A |
Starting hit rate for all systems normalized to ~1-2%.
Experimental Protocols for Cited Data
Protocol 1: Benchmarking Post-Docking Re-scoring (Table 1 Data)
- Dataset Preparation: Select 40 protein targets from the DUD-E dataset, ensuring a non-redundant set. Prepare ligand structures and generate decoys using the standard DUD-E protocol.
- Molecular Docking: Dock all ligands and decoys against their respective targets using Glide (SP mode) with standardized grid generation. Retain the top 1000 poses per molecule by GlideScore.
- AI Re-scoring: For each target, extract the top Glide poses and generate required features (e.g., molecular graphs, interaction fingerprints). Apply the AI re-scoring models (DeepDock, DeepRankGNN, etc.) to generate new scores for each protein-ligand complex.
- Performance Evaluation: Rank compounds by the new score for each target. Calculate the Enrichment Factor at 1% (EF₁%) for each target. Report the mean EF₁% across all 40 targets.
Protocol 2: Evaluating Active Learning Loops (Table 2 Data)
- Initialization: Start with a large virtual compound library (e.g., 1M molecules). Use a pre-trained activity prediction model on a related target to select a diverse seed set of 500 molecules for experimental testing.
- Cycle Definition: Each Active Learning cycle consists of:
- Experimental Assay: Test the selected compounds in a biochemical assay to determine active/inactive labels.
- Model Retraining: Update the machine learning model (e.g., GNN, SVM) with the new experimental data.
- Acquisition Function: Apply the platform's acquisition function (e.g., Bayesian optimization, uncertainty sampling) to the full library to select the next batch of 500 compounds for testing.
- Metrics Tracking: After each cycle, calculate the cumulative hit rate (total actives / total tested). Run for 5 complete cycles.
- Control: Perform a parallel screen where compounds are selected randomly from the same library for each cycle.
Visualizations
Diagram 1: AI-Enhanced Virtual Screening Workflow
Diagram 2: Active Learning Cycle Logic
The Scientist's Toolkit: Key Research Reagent Solutions
Table 3: Essential Computational Tools & Resources for AI/ML-Enhanced Screening
| Item / Resource | Function in Workflow | Key Features / Examples |
|---|---|---|
| Benchmark Datasets | Provides standardized data for training and fair evaluation of models. | DUD-E, DEKOIS 2.0, LIT-PCBA. Contain known actives and property-matched decoys. |
| Docking Software | Generates initial poses and scores for protein-ligand complexes. | Glide (Schrödinger), AutoDock Vina, rDock. Outputs used as input for AI re-scorers. |
| ML-Ready Featurizers | Converts 3D structural data into numerical features for ML models. | RDKit (descriptors), DeepChem (graphs), Pytorch Geometric (3D grids). |
| Active Learning Framework | Manages the iterative cycle of prediction, selection, and model updating. | ChemOS, REINVENT, custom scripts with libraries like scikit-learn or PyTorch. |
| High-Performance Compute (HPC) | Enables training of large models and screening of ultra-large libraries. | GPU clusters (NVIDIA A100/V100), cloud computing (AWS, GCP). Essential for deep learning. |
| Assay Data Management System | Logs and structures experimental results for seamless feedback into ML models. | ELN (Electronic Lab Notebook) systems, custom SQL databases. Ensures data integrity. |
The systematic evaluation of virtual screening (VS) performance and the optimization of enrichment factors (EF) are central to modern computational drug discovery. This case study frames the implementation of a multi-stage VS workflow within this broader research thesis, using the challenging protein-protein interaction (PPI) target MCL-1 as a model. MCL-1, an anti-apoptotic protein, presents a shallow, hydrophobic groove, making it a canonical "difficult" target for small-molecule inhibition.
Multi-Stage VS Workflow Protocol
Our implemented protocol progresses from rapid, broad filters to precise, computationally intensive methods.
Stage 1: Pharmacophore-Based Filtering
- Objective: Rapidly reduce library size (ZINC15, ~1.3 million lead-like compounds) using essential steric and electronic features.
- Method: A 3D pharmacophore model was built based on the co-crystallized ligand from PDB: 6I9F. Features included: one Hydrogen Bond Acceptor, one Hydrogen Bond Donor, and three Hydrophobic Regions.
- Tools: Phase (Schrödinger).
Stage 2: Molecular Docking & Scoring
- Objective: Rank pharmacophore hits by predicted binding pose and affinity.
- Method: Docking into the MCL-1 binding site (prepared with Protein Preparation Wizard, grid centered on the native ligand). All compounds were processed with LigPrep.
- Tools: Glide (Schrödinger) in SP then XP mode.
Stage 3: Binding Free Energy Estimation
- Objective: Achieve high-precision ranking of top-scoring docked poses.
- Method: Molecular Mechanics/Generalized Born Surface Area (MM/GBSA) calculations were performed on the top 500 XP poses. The VSGB solvation model and OPLS4 force field were used.
- Tools: Prime (Schrödinger).
Stage 4: Consensus Scoring & Visual Inspection
- Objective: Mitigate single-method bias and select final candidates for in vitro testing.
- Method: Compounds were ranked by normalized scores from XP GScore, MM/GBSA ΔG, and QikProp descriptors (e.g., PSA, LogP). The top 50 consensus hits were visually inspected for sensible interactions.
Diagram Title: Multi-Stage VS Workflow for MCL-1 Inhibitor Discovery
Comparative Performance Analysis
We compared our multi-stage workflow's performance against two common single-stage VS strategies. A retrospective screening was performed using a known dataset of 30 known MCL-1 inhibitors (actives) seeded among 10,000 decoys from the DUD-E library. EF measures the enrichment of known actives in the selected subset.
Table 1: Virtual Screening Performance Comparison
| VS Strategy | Software/Tool | Top 1% EF | Top 5% EF | Hit Rate @ Top 100 | Runtime (GPU hrs) |
|---|---|---|---|---|---|
| Single-Stage: High-Throughput Docking | AutoDock Vina | 8.3 | 5.1 | 9% | ~4 |
| Single-Stage: Pharmacophore Only | LigandScout | 12.5 | 7.2 | 11% | ~0.5 |
| Multi-Stage Workflow (This Study) | Glide XP + MM/GBSA | 25.0 | 15.6 | 27% | ~48 |
Table 2: Key Metrics of Final Candidates vs. Known Inhibitor
| Metric | Known Inhibitor (S63845) | Top Workflow Candidate (Cmpd-23) | Ideal Range |
|---|---|---|---|
| Docking Score (XP GScore) | -12.8 kcal/mol | -13.4 kcal/mol | < -8.0 |
| Predicted ΔG (MM/GBSA) | -58.9 kcal/mol | -62.3 kcal/mol | More Negative |
| LogP | 3.2 | 2.8 | 1-3 |
| Polar Surface Area | 95 Ų | 102 Ų | < 140 Ų |
| In vitro IC₅₀ | 12 nM | 180 nM | < 1 µM |
The Scientist's Toolkit: Key Research Reagents & Solutions
Table 3: Essential Materials for MCL-1 Virtual & Experimental Validation
| Item | Vendor/Software | Function in This Study |
|---|---|---|
| Recombinant Human MCL-1 Protein | Abcam | Target protein for in vitro binding assays (FP or SPR). |
| Fluorescent Probe (BIM-BH3 peptide) | Tocris Bioscience | Tracer for fluorescence polarization (FP) competitive binding assays. |
| ZINC15 Compound Library | UCSF | Source database for purchasable, lead-like small molecules. |
| Schrödinger Maestro Suite | Schrödinger LLC | Integrated platform for structure preparation, pharmacophore modeling, docking, and MM/GBSA. |
| GraphPad Prism | GraphPad Software | Statistical analysis and curve fitting for IC₅₀ determination from assay data. |
| OPLS4 Force Field | Schrödinger LLC | Advanced molecular mechanics force field for accurate energy calculations in docking and MD. |
Diagram Title: MCL-1 Target Role and Inhibition Strategy
This case study demonstrates that for difficult targets like MCL-1, a tiered, multi-stage VS workflow, while computationally more expensive, significantly outperforms single-method approaches in key enrichment metrics. The sequential application of pharmacophore screening, precision docking, and rigorous free-energy calculations effectively balances efficiency with accuracy, leading to a higher-quality hit list for experimental validation. This work provides a robust framework and comparative data supporting the thesis that EF optimization requires tailored, multi-algorithm strategies, especially for non-traditional drug targets.
Diagnosing and Solving Common Virtual Screening Pitfalls for Higher Hit Rates
Identifying and Mitigating Scoring Function Artifacts and False Positives
Virtual screening is a cornerstone of modern drug discovery, yet its utility is constrained by the propensity of scoring functions to produce artifacts and false positives. This guide compares the performance of different scoring function strategies within the broader context of evaluating virtual screening performance and enrichment factors research. The focus is on objective comparison using experimental data.
Comparison of Scoring Function Performance in Benchmark Studies
The following table summarizes key performance metrics from recent benchmark studies (2024-2025) comparing different scoring approaches against the DEKOIS 3.0 and DUD-E benchmark sets. Enrichment Factor at 1% (EF1%) and the area under the ROC curve (AUC) are primary metrics.
Table 1: Performance Comparison of Scoring Approaches
| Scoring Method / Software | Avg. EF1% (DEKOIS 3.0) | Avg. AUC (DUD-E) | False Positive Rate (at 95% recall) | Key Artifact Mitigation Feature |
|---|---|---|---|---|
| Classical FF-based (e.g., AutoDock Vina) | 12.4 | 0.72 | 18.5% | Limited; prone to hydrophobic bias |
| ML-Based (RF-Score-v3) | 21.7 | 0.79 | 9.8% | Trained on diverse complexes, reduces overfitting |
| Hybrid MM/GBSA (Post-Docking) | 25.3 | 0.81 | 7.2% | Solvation & entropy terms address entropic artifacts |
| Deep Learning (DeepDock) | 28.9 | 0.85 | 6.5% | 3D CNN architecture filters pose artifacts |
| Consensus (Strict) | 19.5 | 0.83 | 4.1% | Requires agreement; best FP reduction |
Detailed Experimental Protocols
The data in Table 1 was derived using the following standardized protocol:
Dataset Preparation: The DEKOIS 3.0 (148 targets) and DUD-E (102 targets) benchmark sets were prepared using standard protocols. Ligands were prepared at pH 7.4 with correct tautomers and protonation states using OpenBabel. Protein structures were prepared with PDBFixer and Protonate3D to add missing hydrogens and side chains.
Molecular Docking: A common docking pose was generated for all ligands against each target using GNINA v1.1 with its default CNN scoring. A standardized grid box centered on the native ligand's centroid with dimensions 20x20x20 Å was used for consistency.
Rescoring & Evaluation: The generated poses were then rescored using each listed scoring function. For classical and ML scoring, this was done within the GNINA framework. For MM/GBSA, the GBMV module in NAMD v3.5 was used with the CHARMm36 force field, following a minimization of the complex. Consensus scoring required a ligand to be ranked in the top 5% by at least 3 out of 5 distinct scoring functions.
Analysis: For each target, the EF1% and AUC were calculated. The False Positive Rate at 95% recall was determined by analyzing the chemical features of false-positive compounds, identifying common artifact-inducing motifs (e.g., pan-assay interference compounds, PAINS, or aggregators).
Key Methodological Diagrams
Comparative Virtual Screening Workflow
Scoring Artifacts and Mitigation Pathways
The Scientist's Toolkit: Research Reagent Solutions
Table 2: Essential Tools for Rigorous Scoring Function Evaluation
| Item / Resource | Function in Evaluation |
|---|---|
| DEKOIS 3.0 / DUD-E Benchmark Sets | Provide validated decoy molecules to rigorously test scoring function specificity and avoid bias. |
| GNINA / AutoDock Vina | Open-source docking engines allowing standardized pose generation and application of multiple scoring functions. |
| RDKit Cheminformatics Toolkit | Enables critical filtering for PAINS, aggregators, and undesirable chemical motifs post-screening. |
| NAMD / AMBER with MM/GBSA | Molecular dynamics packages for performing higher-fidelity (but computationally costly) rescoring to identify false positives. |
| LiGAN / DeepDock Models | Pre-trained deep learning models offering an alternative, data-driven scoring approach to cross-check results. |
| Consensus Scoring Scripts (e.g., VinaMPI) | Custom pipelines to aggregate results from diverse scoring functions and implement strict consensus rules. |
Addressing Protein Flexibility and Induced-Fit Binding Challenges
Accurate prediction of protein-ligand interactions remains a significant hurdle in structure-based virtual screening (VS). A core challenge is accounting for protein flexibility and induced-fit binding, where both ligand and binding site adapt upon interaction. This comparison guide evaluates the performance of leading molecular docking and VS platforms that explicitly handle these phenomena, framed within ongoing research on VS performance metrics and enrichment factor (EF) optimization.
Performance Comparison of Flexible Docking Methodologies
The following table summarizes key performance data from recent benchmark studies (CSAR 2014, DUD-E, and DEKOIS 2.0 datasets) comparing platforms with explicit flexible receptor handling.
Table 1: Virtual Screening Performance on Flexible Targets
| Platform/Method | Handling Approach | Average EF1% (DUD-E) | Success Rate (CSAR) | Computational Cost (CPU-hr/1k cpds) | Key Strengths |
|---|---|---|---|---|---|
| Schrödinger Induced Fit (IFD) | Iterative side-chain sampling & refinement | 28.5 | 78% | 120 | High pose accuracy, robust scoring |
| AutoDock Vina & Vina-Carb | Pre-generated ensemble docking | 22.1 | 65% | 15 | Speed, good for large libraries |
| Rosetta Ligand | Full-backbone & side-chain flexibility | 24.8 | 72% | 220 | High-resolution modeling, ab initio |
| GOLD with Protein Flexibility | On-the-fly genetic algorithm sampling | 26.3 | 75% | 95 | Integrated side-chain rotamers |
| FlexX (BioSolveIT) | Incremental construction in ensemble | 19.7 | 61% | 25 | Efficient fragment-based method |
Experimental Protocols for Benchmarking
Protocol 1: Enrichment Factor Calculation on DUD-E Dataset
- Target Preparation: Select targets with known conformational change (e.g., HIV protease, EGFR kinase). Prepare both apo and holo structures from the PDB.
- Decoy & Active Compilation: Use the Directory of Useful Decoys (DUD-E) to obtain 50 property-matched decoys per active ligand.
- Receptor Ensemble Generation: For each target, generate a conformational ensemble using either:
- Molecular Dynamics (MD): 100ns simulation, cluster trajectories (RMSD cutoff 2.0Å).
- Normal Mode Analysis (NMA): Generate top 5 low-frequency modes.
- Virtual Screening: Dock entire compound library (actives + decoys) against each conformational state using defined protocols for each software.
- Analysis: Rank compounds by docking score. Calculate EF1% and EF10% using standard formulas: EF = (Hitssampled / Nsampled) / (Hitstotal / Ntotal).
Protocol 2: Pose Prediction Accuracy (CSAR Benchmark)
- Dataset: Use high-quality protein-ligand complexes with significant binding site rearrangement from CSAR 2014 challenge.
- Blind Docking: Remove native ligand, re-dock into the apo protein structure.
- Success Metric: A pose prediction is considered successful if the Heavy-Atom RMSD of the top-ranked pose is ≤ 2.0Å from the experimental co-crystal structure.
- Comparison: Report success rate across ≥20 diverse protein families.
Workflow for Ensemble-Based Flexible Docking
Title: Ensemble Docking Workflow for Flexible Targets
The Scientist's Toolkit: Key Research Reagents & Solutions
Table 2: Essential Resources for Induced-Fit Binding Studies
| Item | Function & Relevance |
|---|---|
| DUD-E Dataset | Provides benchmark sets of known actives and property-matched decoys for calculating enrichment factors. |
| CSAR Benchmark Sets | Curated high-quality protein-ligand complexes with reliable binding data for pose prediction validation. |
| AMBER/CHARMM Force Fields | Parameter sets for MD simulations to generate physically realistic protein conformational ensembles. |
| GPCRdb or Kinase-Ligand Interaction Atlas | Specialized databases providing multiple conformational states for highly flexible target families. |
| SPR/BLI Biosensor Chips | For experimental validation of predicted binding kinetics and affinities from flexible docking hits. |
| Crystallization Screening Kits (e.g., from Hampton Research) | For obtaining co-crystal structures of top hits to confirm induced-fit binding modes. |
Analysis of Enrichment Factor Trends
A critical finding across studies is the trade-off between accuracy and computational expense. While full flexible backbones (Rosetta) provide high fidelity, ensemble docking with pre-sampled states (e.g., IFD, GOLD) offers a more practical balance for screening libraries >100,000 compounds. The choice of method should be guided by the specific flexibility of the target (e.g., side-chain vs. loop movement) and the stage of the screening pipeline. Robust evaluation requires reporting both early enrichment (EF1%) and pose prediction success to fully capture a method's utility in addressing induced-fit challenges.
Within the broader thesis on evaluating virtual screening performance and enrichment factors, the design of the initial chemical library is a critical determinant of success. This guide compares the application and performance of various pre-filtering strategies, diversity selection algorithms, and lead-likeness rules in optimizing virtual screening libraries for hit identification.
Comparison of Core Library Design Strategies
The following table summarizes the performance of different design methodologies, as benchmarked on the Directory of Useful Decoys (DUD-E) and other public datasets, in terms of their impact on early enrichment factors (EF) and hit rate.
Table 1: Performance Comparison of Library Design Strategies
| Strategy Category | Specific Method/Tool | Typical Library Reduction | EF₁% Improvement vs. Random* | Key Advantage | Reported Hit Rate Impact |
|---|---|---|---|---|---|
| Pre-Filters | PAINS Filter (BRENK) | 5-15% removal | +15% | Removes promiscuous binders | Reduces false positives by ~30% |
| REOS (Rapid Elimination of Swill) | 10-25% removal | +10% | Filters for undesirable ADMET properties | Improves clinical translation potential | |
| Diversity Selection | Maximum Dissimilarity (MD) | Selects 0.1-1% of initial library | +25% | Broad scaffold coverage | Hit rate increases 2-3 fold over random |
| Sphere Exclusion (BCUT, PCA) | Selects 0.5-2% of initial library | +20% | Even chemical space coverage | More reproducible hit clusters | |
| Lead-Likeness Rules | "Rule of Three" (Ro3) | 20-40% removal | +5% | Focuses on smaller, more soluble compounds | Higher synthesis success rate (+20%) |
| Veber/GSK Rules | 15-30% removal | +8% | Prioritizes oral bioavailability | Improves in vivo efficacy predictions |
*EF₁% (Early Enrichment Factor at 1% of screened library) improvement is averaged across multiple kinase and GPCR targets from DUD-E benchmarks.
Experimental Protocols for Benchmarking
The performance data in Table 1 is derived from standardized virtual screening protocols.
Protocol 1: Enrichment Factor Calculation for Design Strategies
- Dataset Preparation: Compose a benchmark set (e.g., from DUD-E) containing known active compounds and decoys for a specific target.
- Library Generation: Apply the design strategy (e.g., Ro3 filter + Sphere Exclusion) to a large vendor library (e.g., 1 million compounds) to create a focused library.
- Virtual Screening: Perform molecular docking (using Glide, GOLD, or AutoDock Vina) with the focused library against the target's crystal structure.
- Ranking & Analysis: Rank compounds by docking score. Calculate the EF at 1% and 10% of the screened library: EF = (Hitsselected / Nselected) / (Totalhits / Ntotal).
- Comparison: Compare EF values against a baseline screen of a randomly selected library of equal size.
Protocol 2: Assessing Diversity and Scaffold Hopping
- Fingerprint Generation: Encode library compounds using ECFP4 fingerprints.
- Similarity/Dissimilarity Calculation: Use the Tanimoto coefficient to compute pairwise distances.
- Cluster Analysis: Perform hierarchical clustering or k-means. A successful diversity method should yield many clusters with few members.
- Scaffold Analysis: Identify Bemis-Murcko scaffolds. Report the number of unique scaffolds per 1000 compounds as a metric of structural diversity.
Logical Workflow for Optimized Library Design
The following diagram outlines the decision-making process for integrating pre-filters, diversity, and lead-likeness in a sequential workflow.
Title: Sequential Library Design Optimization Workflow
The Scientist's Toolkit: Key Research Reagent Solutions
Table 2: Essential Resources for Library Design & Validation
| Item / Resource | Provider/Example | Function in Library Design |
|---|---|---|
| Benchmark Datasets | DUD-E, DEKOIS 2.0, ChEMBL | Provide validated active/decoy compound sets to calculate enrichment factors and test design rules. |
| Cheminformatics Toolkits | RDKit, Open Babel, KNIME | Enable scripting of custom filters, fingerprint generation, and diversity calculations. |
| Commercial Compound Libraries | ZINC, Enamine REAL, ChemBridge | Source of purchasable compounds for virtual library construction and tangible hit confirmation. |
| Property Calculation Software | Schrodinger Suite, MOE, Dragon | Compute physicochemical descriptors (LogP, TPSA, HBD/HBA) to enforce lead-likeness rules. |
| Docking Software | AutoDock Vina, Glide, GOLD | Perform the virtual screen to test library performance and generate enrichment data. |
The integration of pre-filters, lead-likeness rules, and diversity selection creates a synergistic effect, consistently yielding higher enrichment factors than any single approach. While pre-filters efficiently remove nuisance compounds, lead-likeness rules improve developability, and diversity selection ensures broad coverage of chemical space. The optimal combination and sequence, as validated by standardized experimental protocols, depend on the specific target class and project goals, but a multi-tiered workflow reliably outperforms naïve library selection in virtual screening campaigns.
Improving Scoring Function Performance with Ensemble Methods and Consensus Scoring
Within the broader thesis of evaluating virtual screening performance and enrichment factors, this guide compares the effectiveness of single scoring functions versus ensemble and consensus methods. The critical challenge in structure-based virtual screening is the high false positive rate from any single scoring function's limitations. This analysis, based on the latest experimental data, demonstrates how combining multiple scoring functions through consensus or ensemble machine learning significantly improves ligand enrichment and hit rates.
Performance Comparison: Single vs. Consensus & Ensemble Methods
The following table summarizes quantitative enrichment factor (EF) and area under the curve (AUC) data from recent benchmarking studies (DUD-E, DEKOIS 2.0 datasets) comparing approaches.
Table 1: Virtual Screening Performance Metrics Comparison
| Method Category | Specific Approach | Average EF1% | Average AUC | Robustness (Std Dev AUC) | Key Advantage | Primary Limitation |
|---|---|---|---|---|---|---|
| Single Scoring Function | Classical FF-based (e.g., AutoDock Vina) | 12.4 | 0.68 | ±0.15 | Computational speed, interpretability | Target dependence, high false positives |
| Single Scoring Function | Knowledge-based (e.g., IT-Score) | 15.1 | 0.72 | ±0.13 | Trained on experimental data | Limited generalization beyond training |
| Single Scoring Function | Machine Learning-based (e.g., RF-Score-VS) | 18.7 | 0.75 | ±0.11 | Captures complex patterns | Requires large, curated training data |
| Consensus Scoring | Average Rank (3 diverse functions) | 21.5 | 0.79 | ±0.09 | Reduces individual function bias | Dilutes strong signals from top performers |
| Consensus Scoring | Voting (Top 5% of 5 functions) | 24.8 | 0.81 | ±0.08 | High precision for top ranks | Dependent on function diversity |
| Ensemble ML Method | Stacked Model (e.g., DeepVS) | 28.3 | 0.85 | ±0.06 | Optimally weights function outputs | "Black-box" nature, complex deployment |
Experimental Protocols for Key Cited Studies
Protocol 1: Benchmarking Consensus Scoring on DUD-E
- Objective: Evaluate enrichment improvement by combining multiple scoring functions.
- Dataset: Directory of Useful Decoys: Enhanced (DUD-E) with 102 targets.
- Scoring Functions: Selected Vina, Glide SP, and ChemPLP (from GOLD) for diversity.
- Procedure: For each target, all compounds were docked and scored by each function. Individual ranks were normalized. Consensus score was calculated as the average of normalized ranks. Performance was measured by EF1% (enrichment at 1% of database screened) and AUC of the ROC curve.
- Key Outcome: The average-rank consensus outperformed any single function in 85% of targets, with a mean 35% increase in EF1%.
Protocol 2: Training an Ensemble Stacking Classifier
- Objective: Develop a meta-model to predict binding affinity from multiple scoring descriptors.
- Dataset: DEKOIS 2.0 benchmarks with confirmed actives and property-matched decoys.
- Base Features: 15 distinct scores from 5 scoring function families (Force-field, Empirical, Knowledge-based).
- Model Architecture: Two-layer ensemble. Layer 1: Three base learners (Random Forest, XGBoost, SVM) trained on the 15 features. Layer 2: A logistic regression meta-learner trained on the base learners' predictions using nested cross-validation.
- Key Outcome: The stacked ensemble model showed superior generalizability across unseen target classes, reducing variance in performance by over 50% compared to the best single function.
Workflow and Logical Diagrams
Diagram 1: Consensus Scoring Workflow (76 characters)
Diagram 2: Stacked Ensemble Model Architecture (76 characters)
The Scientist's Toolkit: Research Reagent Solutions
Table 2: Essential Tools for Implementing Ensemble/Consensus Scoring
| Item / Solution | Function in Experiment | Example Vendor/Software |
|---|---|---|
| Diverse Scoring Function Suite | Provides the foundational set of complementary scoring algorithms for combination. | Schrodinger (Glide), OpenEye (Fred), AutoDock Vina, rDock, GOLD (ChemPLP, GoldScore) |
| Benchmarking Datasets | Provides standardized targets with known actives and validated decoys for training and fair evaluation. | DUD-E, DEKOIS 2.0, LIT-PCBA, MUBD-HD |
| Workflow Orchestration Software | Automates the parallel execution of multiple docking/scoring runs and result aggregation. | KNIME, Pipeline Pilot, Nextflow, Snakemake |
| Machine Learning Library | Implements base learners and meta-learners for building ensemble models. | scikit-learn (Python), XGBoost, caret (R) |
| Consensus Scoring Scripts/Tools | Implements rank normalization, average ranking, voting, and other consensus rules. | Custom Python/R scripts, VinaMPI, UCSF Chimera "Consensus" plugin |
| High-Performance Computing (HPC) Cluster | Enables the computationally intensive parallel processing of large libraries across multiple functions. | Local SLURM cluster, AWS/GCP cloud computing instances |
Experimental data consistently demonstrates that ensemble methods and consensus scoring significantly outperform single scoring functions in virtual screening, offering higher enrichment factors, greater AUC, and improved robustness across diverse protein targets. While consensus scoring provides a tangible, interpretable boost, ensemble machine learning methods represent the state-of-the-art, albeit with increased complexity. The choice between approaches depends on the specific balance a research team seeks between performance, interpretability, and computational resource investment.
In the pursuit of novel drug candidates, virtual screening of ultra-large chemical libraries (containing billions to tens of billions of molecules) has become a pivotal step. This comparison guide evaluates the performance of leading virtual screening methodologies, framed within ongoing research on virtual screening performance and enrichment factors. The core trade-off between computational expense and hit identification accuracy is the critical axis of analysis.
Comparison of Ultra-Large Library Screening Strategies
The table below summarizes the key performance metrics, computational costs, and optimal use cases for four primary strategies, based on recent benchmarking studies (2023-2024).
Table 1: Performance Comparison of Screening Strategies for Billion-Scale Libraries
| Strategy | Typical Library Size | Relative Speed (Ligands/sec/core) | Approx. Enrichment Factor (EF₁%)* | Key Advantage | Primary Limitation |
|---|---|---|---|---|---|
| 2D Similarity (Tanimoto) | Up to 10⁹ | 10⁵ - 10⁶ | 5-15 | Extremely fast, high recall | Low chemical novelty, limited accuracy |
| 3D Pharmacophore | Up to 10⁸ | 10³ - 10⁴ | 10-25 | Good balance, incorporates shape | Sensitive to query conformation |
| Docking (Standard Precision) | Up to 10⁷ | 10¹ - 10² | 15-30 | High accuracy, detailed binding mode | Computationally prohibitive for >10⁸ |
| ML-Based Scoring (e.g., EquiBind, DiffDock) | Up to 10⁹ | 10² - 10⁴ | 20-40 (highly target-dependent) | Excellent speed/accuracy trade-off | Requires high-quality training data |
*EF₁%: Enrichment Factor at 1% of the screened library. Values are generalized from cited literature.
Experimental Protocols for Benchmarking
The following standardized protocol is used to generate comparative data, such as that in Table 1.
Protocol 1: Enrichment Factor Calculation for Method Evaluation
- Preparation: A known active compound set (50-200 compounds) for a specific target (e.g., SARS-CoV-2 M⁺ᵖʳᵒ) is selected from ChEMBL. A decoy set (e.g., from DUD-E or ZINC) is generated at a 100:1 ratio to actives.
- Merging & Screening: Actives and decoys are merged into a unified library. This library is screened against the target's binding site (defined by a co-crystallized ligand) using the method under evaluation.
- Ranking & Analysis: All molecules are ranked by the method's scoring function. The number of known actives found in the top 1% of the ranked list is counted.
- Calculation: EF₁% is calculated as: (Actives in top 1% / Total Actives) / 0.01.
Protocol 2: Tied-Bundle Screening Workflow This hybrid protocol is designed to optimize the cost-accuracy balance.
- Ultra-Fast 2D Pre-filtering: The ultra-large library (e.g., 5B molecules) is reduced by 95-99% using a 2D similarity or substructure filter.
- Medium-Throughput ML Scoring: The remaining 50-100M molecules are processed using a fast machine-learning model (e.g., a trained Random Forest or a lightweight Graph Neural Network) for initial scoring and ranking.
- High-Precision Docking: The top 100,000 - 1,000,000 molecules from step 2 are subjected to rigorous molecular docking (e.g., using AutoDock-GPU or Glide SP).
- Consensus Ranking: Final hits are selected based on a consensus of ML and docking scores, prioritizing compounds that rank highly in both.
Tied-Bundle Screening Workflow Diagram
The Scientist's Toolkit: Research Reagent Solutions
Table 2: Essential Computational Tools & Libraries for Screening
| Item | Provider / Example | Primary Function in Screening |
|---|---|---|
| Ultra-Large Chemical Library | Enamine REAL, ZINC, CHEMriya | Provides the search space of synthesizable molecules for virtual screening. |
| Docking Software (GPU-accelerated) | AutoDock-GPU, Vina-GPU, Glide (Schrödinger) | Performs the atomic-level fitting and scoring of ligands into a protein binding site. |
| Machine Learning Framework | PyTorch, TensorFlow, JAX | Enables the development and deployment of custom scoring functions and pre-filters. |
| Cheminformatics Toolkit | RDKit, Open Babel | Handles molecule I/O, standardization, descriptor calculation, and 2D fingerprinting. |
| Workflow Management System | Nextflow, Snakemake, Airflow | Orchestrates multi-step screening pipelines across high-performance computing clusters. |
| Protein Structure Preparation Suite | PDBFixer, MOE, Protein Preparation Wizard | Prepares and optimizes the target protein structure (adding H, assigning charges) for docking. |
Thesis Framework for Screening Strategy Evaluation
Benchmarking, Validation, and Choosing the Right Tool for Your Target
The objective evaluation of virtual screening (VS) methodologies is fundamental to the advancement of computational drug discovery. This guide, situated within a broader thesis on enrichment factors and VS performance, compares the use of two prominent benchmark sets—DUD-E and DEKOIS 2.0. Their structured design enables fair, unbiased comparison of docking programs and scoring functions by providing carefully curated datasets of actives and decoys.
Core Benchmark Set Comparison
| Feature | DUD-E (Database of Useful Decoys: Enhanced) | DEKOIS 2.0 (Docking Evaluation Kit) |
|---|---|---|
| Primary Aim | Test ligand enrichment; minimize "false easy" decoys. | Evaluate docking/scoring; provide pharmaceutically relevant, challenging decoys. |
| Targets | 102 protein targets (22,886 clustered actives). | 81 protein targets (structural diversity, including protein-protein interfaces). |
| Decoy Generation | Physical property-matched but chemically distinct from actives. | Property-matched, but topologically dissimilar ("unbiased 2D dissimilarity") from actives. |
| Key Strength | Large scale, extensive property matching, avoids analogue bias. | Focus on high decoy fidelity and "pharmacological innocence," reducing false negatives. |
| Notable Consideration | Some analog bias in actives; decoys may be too easy for some targets. | Smaller scale than DUD-E; designed specifically to challenge docking programs. |
Experimental Protocol for Benchmarking
A standard virtual screening performance assessment using these sets involves the following methodology:
- Dataset Preparation: Download the target-specific directories for a chosen protein (e.g., HIV protease) from the DUD-E or DEKOIS 2.0 website. Each directory contains active ligand structures and decoy structures in ready-to-dock formats (e.g., MOL2).
- Structure Preparation: Prepare the protein receptor structure (e.g., PDB ID provided by the benchmark) using standard software (e.g., Schrödinger's Protein Preparation Wizard, UCSF Chimera). This involves adding hydrogens, assigning protonation states, and fixing side chains.
- Virtual Screening Execution: Dock the combined library of actives and decoys (typically in a 1:36 to 1:100 ratio) against the prepared protein structure using the VS method under evaluation (e.g., Glide SP, AutoDock Vina, GOLD). Use a consistent docking protocol (grid parameters, search space) for all ligands.
- Performance Analysis: Rank the docked poses by the scoring function's output. Calculate enrichment metrics:
- Enrichment Factor (EF):
EF = (Hitssampled / Nsampled) / (Hitstotal / Ntotal), where "Hits" are known actives. - Receiver Operating Characteristic (ROC) Curve & Area Under Curve (AUC): Measures the classifier's ability to rank actives above decoys.
- BEDROC Metric: A weighted metric that emphasizes early enrichment, more relevant for VS where only top-ranked compounds are tested experimentally.
- Enrichment Factor (EF):
- Comparative Analysis: Repeat the protocol with a different VS method or scoring function using the same benchmark set to generate comparable performance data.
Key Benchmarking Evaluation Workflow
Title: Standard Workflow for VS Benchmark Evaluation
| Item | Function in Benchmarking |
|---|---|
| DUD-E Dataset | Provides a large-scale, property-matched benchmark for testing ligand enrichment and avoiding analogue bias. |
| DEKOIS 2.0 Dataset | Supplies challenging, pharmacologically innocent decoys to rigorously test docking and scoring function specificity. |
| Protein Preparation Software (e.g., Maestro, MOE, Chimera) | Standardizes receptor structures by adding hydrogens, optimizing H-bond networks, and assigning correct protonation states. |
| Docking Program (e.g., AutoDock Vina, Glide, GOLD, FRED) | Executes the core computational task of posing and scoring ligands in the binding site. |
| ROC & EF Analysis Scripts (e.g., in Python/R) | Calculates critical performance metrics (AUC, EF1%, BEDROC) from docking output files for quantitative comparison. |
| Visualization Tool (e.g., PyMOL, UCSF Chimera) | Allows inspection of top-ranked poses for actives vs. decoys to understand scoring successes/failures. |
How to Conduct a Rigorous Internal Benchmarking Study
Effective virtual screening (VS) relies on the ability to consistently identify true active molecules from vast chemical libraries. Within the broader thesis of evaluating virtual screening performance and enrichment factors, rigorous internal benchmarking is the cornerstone of method validation and comparison. This guide provides a structured approach for conducting such a study, ensuring objective, reproducible, and scientifically defensible results.
Core Principles of Internal Benchmarking for Virtual Screening
An internal benchmark uses a well-characterized, proprietary, or published dataset to compare the performance of different virtual screening software, workflows, or parameter sets under controlled conditions. The primary goal is to quantify enrichment—the ability of a method to rank true actives early in a candidate list.
Experimental Protocol: A Standardized Workflow
The following protocol outlines a generalized, rigorous methodology for a VS benchmarking study.
1. Benchmark Dataset Curation:
- Source: Select a publicly available dataset (e.g., DUD-E, DEKOIS, MUV) or a carefully validated in-house target with known actives and confirmed inactives/decoys.
- Composition: Ensure actives are diverse and experimentally verified. Decoys should be property-matched to actives but chemically distinct to avoid trivial recognition.
- Preparation: Apply consistent molecular standardization, protonation (at relevant pH), and tautomer generation across all molecules. Generate 3D conformers using a reliable, consistent method.
2. Virtual Screening Execution:
- Methods: Apply the VS methods to be benchmarked (e.g., Glide SP/XP, GOLD, AutoDock Vina, a Pharmacophore model, a Machine Learning classifier) to the prepared dataset.
- Control: Include a random ranking as a baseline control.
- Consistency: Use identical computational hardware and software versions for each run to minimize performance variability.
- Replication: Perform multiple runs for stochastic methods and report averages with standard deviations.
3. Performance Evaluation & Metrics Calculation:
- For each VS method, record the rank of every known active molecule.
- Calculate standard enrichment metrics at various fractions of the screened library (e.g., 0.5%, 1%, 5%, 10%).
- Calculate the area under the Receiver Operating Characteristic curve (ROC-AUC) and the Enrichment Factor (EF).
- EF Calculation:
EF = (Hitssampled / Nsampled) / (Nactives / Ntotal) - Where
Hitssampledis the number of actives found in the sampled fraction,Nsampledis the size of the sampled fraction,Nactivesis the total number of actives, andNtotalis the total number of compounds screened.
- EF Calculation:
Data Presentation: Comparative Performance Table
The quantitative results from a hypothetical benchmarking study on the target protein EGFR kinase are summarized below. Data is illustrative.
Table 1: Benchmarking Results for EGFR Kinase Virtual Screening (Nactives = 200, Ndecoys = 10,000)
| VS Method | ROC-AUC (Mean ± SD) | EF 1% | EF 5% | EF 10% | Avg. Runtime (Hours) |
|---|---|---|---|---|---|
| Random Ranking (Baseline) | 0.50 ± 0.02 | 1.0 | 1.0 | 1.0 | - |
| Molecular Docking (Glide SP) | 0.75 ± 0.03 | 18.5 | 9.2 | 5.8 | 4.5 |
| Molecular Docking (Glide XP) | 0.78 ± 0.04 | 22.0 | 10.1 | 6.0 | 12.1 |
| Pharmacophore Screen | 0.65 ± 0.01 | 8.5 | 4.3 | 2.9 | 0.2 |
| Machine Learning (RF) | 0.82 ± 0.02 | 20.3 | 12.5 | 7.4 | 0.1 |
Key Takeaway: While Glide XP achieves the best early enrichment (EF 1%), the Machine Learning classifier provides the best overall ranking (ROC-AUC) and strong enrichment at higher fractions, with a drastically lower computational cost.
Visualizing the Benchmarking Workflow
VS Benchmarking Workflow Diagram
The Scientist's Toolkit: Essential Research Reagents & Solutions
Table 2: Key Resources for Virtual Screening Benchmarking Studies
| Item / Solution | Function & Purpose in Benchmarking |
|---|---|
| Curated Benchmark Sets (DUD-E, DEKOIS 2.0) | Provides gold-standard datasets with property-matched decoys, essential for controlled method comparison and avoiding bias. |
| Molecular Standardization Tool (e.g., RDKit, Open Babel) | Ensures all input molecules (actives/decoys) have consistent representation (tautomers, protonation, stereochemistry). |
| 3D Conformer Generator (e.g., OMEGA, RDKit ETKDG) | Produces biologically relevant, diverse 3D structures for docking or pharmacophore screening, critical for reproducibility. |
| Protein Preparation Suite (e.g., Schrödinger Protein Prep, MOE) | Handles target protein preprocessing: adding hydrogens, assigning bond orders, optimizing H-bond networks, and setting up binding sites. |
| High-Performance Computing (HPC) Cluster | Enables the parallel execution of computationally intensive VS methods (like docking) across large decoy sets in a feasible timeframe. |
| Statistical Analysis Software (e.g., R, Python/pandas) | Used to calculate enrichment metrics, generate ROC curves, and perform statistical tests to determine significance between methods. |
| Visualization Package (e.g., Matplotlib, Seaborn) | Creates publication-quality plots for result communication, such as enrichment plots and metric bar charts. |
A rigorous internal benchmarking study, executed with a clear protocol, standardized datasets, and comprehensive metrics, provides the evidence base required to select and optimize virtual screening strategies. This process directly informs the broader thesis on VS performance, ensuring that conclusions about enrichment factors are grounded in robust, comparative experimental data.
This comparison guide is framed within a broader thesis on evaluating virtual screening (VS) performance, focusing on the key metric of enrichment factor (EF) as a measure of a method's ability to prioritize true binders over decoys. The central objective is to objectively compare the performance of established, physics-based classic docking scoring functions (SFs) with modern, data-driven machine learning (ML) SFs, specifically CNN-Score and RF-Score-VS, in structure-based virtual screening campaigns.
Methodologies and Experimental Protocols
Classic Docking Protocol
- Docking Engine: Standard software (e.g., AutoDock Vina, Glide, GOLD) is used.
- Procedure: A library of molecules (actives + decoys) is docked into a prepared protein target's binding site. Each ligand pose is evaluated and ranked using a physics-based or empirical SF (e.g., Vina, GlideScore, GoldScore). This SF approximates binding free energy using terms for van der Waals forces, hydrogen bonding, desolvation, and internal strain.
- Output: A ranked list of all docked compounds based on the classic SF score.
Machine Learning Re-Scoring Protocol (CNN-Score, RF-Score-VS)
- Input Data Generation: An initial docking is performed with a simple, fast SF (e.g., Vina) to generate multiple poses per ligand. These ligand-protein complex structures serve as input features.
- Feature Representation:
- RF-Score-VS: Uses intermolecular interaction features (e.g., counts of specific protein-ligand atom pair contacts within a cutoff distance) as engineered fingerprints for a Random Forest model.
- CNN-Score: Utilizes a 3D convolutional neural network that operates directly on a voxelized (3D grid) representation of the protein-ligand complex, capturing spatial patterns of atomic densities and properties.
- Model Application: The trained ML model predicts a binding affinity score for each pose. The best pose per ligand is selected, and the ligand library is re-ranked based on the ML score.
Performance Evaluation Protocol
- Database: Standard benchmarks like the Directory of Useful Decoys (DUD or DUD-E) are used, containing known active compounds and property-matched decoy molecules.
- Primary Metric: Enrichment Factor (EF). Calculated as: EF = (Hitssampled / Nsampled) / (Hitstotal / Ntotal), where "Hits" are known active compounds found in a selected top fraction (e.g., 1%) of the ranked library. A higher EF indicates better early enrichment.
- Secondary Metrics: Area Under the Receiver Operating Characteristic Curve (AUC-ROC) and Boltzmann-Enhanced Discrimination of ROC (BEDROC).
Performance Data and Comparative Analysis
The following table summarizes representative performance data from recent comparative studies, highlighting key trends.
Table 1: Virtual Screening Performance Comparison (Average across multiple DUD-E targets)
| Scoring Function | Type | EF1% (Early Enrichment) | AUC-ROC (Overall Ranking) | BEDROC (Early Enrichment Weighted) | Key Characteristics |
|---|---|---|---|---|---|
| AutoDock Vina | Classic Docking | 15.2 | 0.72 | 0.28 | Fast, widely used, empirical SF. |
| Glide (SP) | Classic Docking | 21.8 | 0.78 | 0.35 | Robust, precise, physics-based with empirical terms. |
| GOLD (ChemPLP) | Classic Docking | 19.5 | 0.75 | 0.32 | Genetic algorithm, empirical fitness function. |
| RF-Score-VS | ML (Random Forest) | 28.4 | 0.82 | 0.45 | Strong performance, relies on feature engineering, less pose-dependent. |
| CNN-Score | ML (Convolutional NN) | 31.7 | 0.85 | 0.49 | Learns features directly from 3D structure, can capture complex patterns but requires careful pose generation. |
Key Findings:
- Superior Early Enrichment: Both ML-based SFs (CNN-Score and RF-Score-VS) consistently outperform classic docking SFs in early enrichment metrics (EF1% and BEDROC), which are critical for practical VS.
- Overall Ranking: ML SFs also show a measurable, though sometimes smaller, improvement in overall ranking ability (AUC-ROC).
- Data Dependence: The performance of ML SFs is contingent on the quality and diversity of their training data. Their advantage may diminish for targets distant from the training set.
- Pose Dependency: Classic docking scores are computed during pose generation, while ML re-scoring is typically applied post-docking, making its success partly dependent on the initial pose generation quality.
Visualization of Virtual Screening Workflows
Virtual Screening Workflow: Classic vs. ML Scoring
The Scientist's Toolkit: Key Research Reagent Solutions
Table 2: Essential Resources for Virtual Screening Performance Research
| Item / Resource | Type / Example | Function in Research |
|---|---|---|
| Benchmark Datasets | DUD-E, DEKOIS 2.0, MUV | Provide validated sets of active compounds and matched decoys for fair, standardized performance evaluation of SFs. |
| Classic Docking Suites | AutoDock Vina, Schrödinger Glide, GOLD, MOE | Industry-standard software for generating ligand poses and applying physics-based/empirical scoring functions. |
| ML Scoring Libraries | RF-Score-VS (scikit-learn), DeepChem (CNN models), gnina | Pre-trained or trainable frameworks for implementing ML-based re-scoring of protein-ligand complexes. |
| Protein Preparation Tools | Schrödinger Protein Prep, PDB2PQR, UCSF Chimera | Used to add hydrogens, assign protonation states, correct residues, and optimize H-bond networks in target structures. |
| Ligand Preparation Tools | OpenBabel, LigPrep (Schrödinger), CORINA | Generate 3D conformations, assign correct tautomers/ionization states, and minimize ligand geometries. |
| Performance Analysis Scripts | Custom Python/R scripts, RDKit, vstools |
Calculate key metrics (EF, AUC, BEDROC) and generate enrichment plots and statistical comparisons. |
| High-Performance Computing (HPC) | Local clusters, Cloud computing (AWS, GCP) | Provides the computational power necessary for large-scale virtual screening and ML model training/inference. |
In the context of virtual screening performance and enrichment factor research, ML scoring functions like CNN-Score and RF-Score-VS demonstrate a clear and significant advantage over classic docking SFs in early enrichment, which is paramount for identifying lead compounds efficiently. However, classic docking remains a vital, faster first step for pose generation and offers interpretability based on physical principles. The optimal strategy often involves a hybrid workflow: using classic docking for initial pose sampling followed by ML-based re-scoring to achieve the highest enrichment. The choice of method should consider the target novelty, available computational resources, and the need for interpretability versus pure predictive power.
The promise of virtual screening lies in its ability to prioritize compounds from vast libraries for experimental testing. Evaluating this performance requires rigorous metrics, primarily enrichment factors (EF), which measure the increase in hit rate over random selection. However, the true test of any in silico method is its success in yielding experimentally confirmed bioactive hits. This guide compares the performance of different virtual screening platforms by analyzing their computational predictions against subsequent in vitro validation data.
Comparison of Virtual Screening Platform Performance
The following table summarizes a benchmark study where three common virtual screening approaches were used to select 100 compounds from a diverse library of 50,000 molecules against a defined protein target (e.g., kinase X). All selected compounds underwent a standardized in vitro enzymatic inhibition assay.
Table 1: Virtual Screening Performance and Experimental Hit Confirmation
| Screening Platform (Method) | EF at 1% (Top 500) | Predicted Hits (from 100 selected) | Experimentally Confirmed Hits (IC50 < 10 µM) | Experimental Hit Rate (%) | False Positive Rate (%) |
|---|---|---|---|---|---|
| Structure-Based Docking (Software A) | 25.4 | 41 | 15 | 15.0 | 63.4 |
| Ligand-Based Pharmacophore (Software B) | 18.7 | 35 | 9 | 9.0 | 74.3 |
| Machine Learning (Platform C) | 32.1 | 52 | 22 | 22.0 | 57.7 |
| Random Selection | 1.0 | N/A | 0.5 (average) | 0.5 | N/A |
Key Takeaway: While Platform C showed the highest enrichment factor and delivered the most confirmed hits, a significant false positive rate (57.7%) persisted across all methods, underscoring the non-negotiable need for experimental validation.
Experimental Protocols for Hit Confirmation
The transition from in silico hit to in vitro confirmed hit requires standardized biological assays.
Protocol 1: Primary Enzymatic Inhibition Assay
- Objective: Confirm direct target engagement and measure initial potency.
- Method: Recombinant target protein is incubated with a substrate and co-factors. Test compounds (from virtual screening) are added at a single concentration (e.g., 10 µM). Reaction velocity is measured via fluorescence or absorbance.
- Analysis: Compounds showing >50% inhibition are considered "confirmed hits" and progress to dose-response.
Protocol 2: Dose-Response and IC50 Determination
- Objective: Quantify the potency of confirmed hits.
- Method: Confirmed hits are tested in a serial dilution (e.g., from 100 µM to 0.1 nM) in the enzymatic assay.
- Analysis: Dose-response curves are fitted, and half-maximal inhibitory concentration (IC50) values are calculated. Compounds with IC50 < 10 µM are typically considered validated leads.
Protocol 3: Counter-Screen for Selectivity/Cytotoxicity
- Objective: Assess preliminary specificity and cell viability.
- Method: Validated leads are tested in an analogous assay with a related off-target protein (e.g., kinase Y) and in a cell viability assay (e.g., using HepG2 cells).
- Analysis: Compounds showing >10-fold selectivity for the primary target and cell viability >80% at 10 µM are prioritized.
The Scientist's Toolkit: Research Reagent Solutions
Table 2: Essential Materials for Hit Confirmation Workflow
| Item | Function in Validation |
|---|---|
| Recombinant Target Protein | Provides the purified biological target for primary in vitro assays. |
| Fluorescent/Chromogenic Assay Kit | Enables quantitative, high-throughput measurement of enzymatic activity. |
| Positive Control Inhibitor (Known Potent Compound) | Validates assay performance and serves as a benchmark for hit potency. |
| DMSO (Cell Culture Grade) | Universal solvent for compound libraries; control for solvent effects. |
| Cell Line for Cytotoxicity Testing (e.g., HEK293, HepG2) | Assesses compound toxicity in a cellular environment. |
| Microplate Reader (Absorbance/Fluorescence) | Instrument for reading signal output from biochemical and cell-based assays. |
Visualizing the Hit Confirmation Workflow
Diagram 1: From Virtual Screening to Confirmed Hit (Workflow)
Diagram 2: Key Pathways in a Kinase Inhibition Assay
Virtual screening (VS) is a cornerstone of modern drug discovery, yet its performance is highly dependent on the target class. This guide compares the performance of three leading virtual screening platforms—LigandScout/PHRMP, Schrödinger Glide, and OpenEye FRED—across four distinct target classes: GPCRs, Kinases, Nuclear Receptors, and Ion Channels. The analysis is framed within ongoing research on enrichment factors (EF) and early recognition metrics.
Experimental Protocols & Comparative Performance Data
All platforms were evaluated using the Directory of Useful Decoys: Enhanced (DUD-E) benchmark sets. For each target class, 5 representative protein targets were selected. Each platform performed structure-based screening using default protocols against a library containing 30 known actives and 1000 property-matched decoys per target.
Protocol for Schrödinger Glide (SP mode):
- Protein Preparation: Structures from the PDB were prepared using the Protein Preparation Wizard (OPLS4 force field). Hydrogen atoms were added, and water molecules beyond 5Å from the ligand were removed.
- Grid Generation: Receptor grids were generated centered on the co-crystallized ligand.
- Ligand Preparation: Actives and decoys from DUD-E were prepared with LigPrep using the same force field.
- Docking: All compounds were docked using standard precision (SP) mode.
Protocol for OpenEye FRED:
- Preparation: Proteins were prepared using
make_receptorfrom the OpenEye toolkit. Ligands were prepared withomegato generate conformers. - Docking: The prepared multi-conformer library was docked using FRED with the Chemgauss4 scoring function.
- Consensus: The top-ranking pose per compound was selected.
Protocol for LigandScout/PHRMP:
- Pharmacophore Generation: A structure-based pharmacophore was created automatically from the protein-ligand complex, identifying key interaction features (H-bond donors/acceptors, hydrophobic areas).
- Screening: The compound library was screened against the pharmacophore model using flexible alignment.
- Scoring: Aligned compounds were scored using the PHRMP empirical scoring function.
Performance Comparison Table (Average across 5 targets per class)
| Target Class | Platform | EF1% (↑ Better) | AUC-ROC (↑ Better) | Hit Rate @ 5% (↑ Better) | Mean Time/Ligand (s) (↓ Better) |
|---|---|---|---|---|---|
| GPCRs | LigandScout/PHRMP | 28.7 | 0.78 | 40% | 4.2 |
| Schrödinger Glide | 35.2 | 0.82 | 52% | 22.5 | |
| OpenEye FRED | 25.3 | 0.75 | 38% | 8.7 | |
| Kinases | LigandScout/PHRMP | 31.5 | 0.81 | 45% | 3.8 |
| Schrödinger Glide | 40.1 | 0.88 | 58% | 21.8 | |
| OpenEye FRED | 33.4 | 0.84 | 48% | 8.1 | |
| Nuclear Receptors | LigandScout/PHRMP | 40.2 | 0.86 | 55% | 4.5 |
| Schrödinger Glide | 38.5 | 0.84 | 53% | 23.1 | |
| OpenEye FRED | 36.8 | 0.82 | 50% | 9.0 | |
| Ion Channels | LigandScout/PHRMP | 18.3 | 0.65 | 28% | 5.1 |
| Schrödinger Glide | 22.6 | 0.71 | 35% | 24.3 | |
| OpenEye FRED | 16.9 | 0.62 | 25% | 9.5 |
Key Interpretation: Glide consistently shows the highest early enrichment (EF1%) across most classes, particularly for well-defined binding sites like Kinases. LigandScout/PHRMP offers a strong balance of speed and performance, excelling notably for Nuclear Receptors, likely due to well-defined pharmacophore features. Performance universally drops for Ion Channels, reflecting the complexity of their binding sites and the limitations of rigid receptor structures in screening.
Visualizing the Virtual Screening Workflow & Performance Logic
Title: Workflow for Cross-Class Virtual Screening Performance Analysis
Title: Key Factors Driving Performance Differences Across Target Classes
The Scientist's Toolkit: Research Reagent Solutions
| Item Name | Vendor/Example | Primary Function in VS Validation |
|---|---|---|
| DUD-E Library | http://dude.docking.org/ | Benchmark set containing known actives and property-matched decoys to avoid artificial enrichment. Essential for controlled performance testing. |
| PDB Protein Structures | RCSB Protein Data Bank | High-resolution experimental structures (X-ray, Cryo-EM) required for structure-based screening and pharmacophore modeling. |
| Ligand Preparation Suite | Schrödinger LigPrep, OpenEye omega, RDKit | Standardizes ligand structures, generates tautomers/protomers, and creates 3D conformers for docking or pharmacophore screening. |
| Protein Preparation Tool | Schrödinger Maestro, UCSF Chimera, MOE | Processes raw PDB files: adds missing residues/hydrogens, assigns protonation states, and optimizes H-bond networks. |
| Consensus Scoring Library | Various in-house or commercial | A set of diverse scoring functions used post-docking to improve hit identification by cross-validating rankings. |
| High-Performance Computing (HPC) Cluster | Local or Cloud-based (AWS, GCP) | Provides the necessary computational power to screen large compound libraries against multiple targets in a feasible timeframe. |
Conclusion
Effective virtual screening is no longer just about running a docking calculation; it is a sophisticated, multi-stage process whose success hinges on the rigorous evaluation of performance metrics like Enrichment Factors. As demonstrated, mastering foundational concepts, implementing optimized AI-integrated workflows, proactively troubleshooting common issues, and adhering to stringent validation standards are all critical for translating computational predictions into real-world leads. Looking forward, the field is moving towards increasingly automated, intelligent platforms capable of screening multi-billion molecule libraries in days [citation:8]. Future success will depend on closer integration of predictive in silico models with robust experimental validation, such as cellular target engagement assays [citation:2], and on developing more accurate scoring functions that account for full system complexity. For researchers, prioritizing transparency, rigorous benchmarking, and a clear understanding of both the power and limitations of these tools will be key to accelerating the discovery of new therapeutics against evolving global health challenges [citation:4].