Bridging the Evidence Gap: Methodological Strategies for Validating Real-World Evidence Against Randomized Controlled Trials
This article provides a comprehensive framework for researchers and drug development professionals on validating Real-World Evidence (RWE) against the gold standard of Randomized Controlled Trials (RCTs).
Bridging the Evidence Gap: Methodological Strategies for Validating Real-World Evidence Against Randomized Controlled Trials
Abstract
This article provides a comprehensive framework for researchers and drug development professionals on validating Real-World Evidence (RWE) against the gold standard of Randomized Controlled Trials (RCTs). It explores the foundational strengths and limitations of both data sources, details advanced methodological approaches like target trial emulation and privacy-preserving record linkage, addresses key challenges in data quality and bias, and presents frameworks for the comparative assessment of RWE validity. As regulatory bodies increasingly accept RWE, this guide aims to equip scientists with the tools to rigorously generate and evaluate real-world data, thereby enhancing its reliability for regulatory decision-making, label expansions, and understanding long-term treatment effectiveness in diverse patient populations.
Understanding the Evidence Landscape: The Complementary Roles of RCTs and RWE
Troubleshooting Guides
Addressing Threats to Internal Validity
Problem: Selection Bias and Poor Generalizability
- Issue: RCT samples are often highly filtered and unrepresentative of real-world patients due to stringent eligibility criteria. This occurs because patients may be excluded if they are suicidal, have psychotic symptoms, have major medical comorbidity, have concurrent substance use disorders, or have personality disorders [1].
- Troubleshooting: Scrutinize the CONSORT diagram to understand screening and recruitment filtration. Examine how many patients were obviously ineligible and not formally screened, as this creates a false impression of external validity [1].
- Prevention Protocol: Implement broad eligibility criteria where ethically and scientifically justified. Report complete pathway-to-recruitment data to allow judgment about generalizability [2].
Problem: Bias in Non-Blindable Interventions
- Issue: For interventions like psychotherapy, yoga, meditation, and acupuncture, patients cannot be blinded to their treatment assignment. This leads to contaminated placebo responses shaped by preexisting beliefs and expectations, seriously compromising internal validity [1].
- Troubleshooting: Monitor and report differential dropout rates between groups before treatment begins, as this indicates compromised randomization due to patient treatment preferences [1].
- Prevention Protocol: Consider alternative study designs (e.g., preference trials) or use active comparators rather than waitlisted controls to balance expectancy effects [1].
Problem: Post-Randomization Biases
- Issue: Randomization integrity deteriorates after trial commencement through events such as differential dropout (adverse events in drug groups, inefficacy in placebo groups), unequal use of rescue medications, and unreported concomitant treatments [1].
- Troubleshooting: Implement rigorous monitoring of rescue medication use, reasons for dropout, and treatment adherence. Consider collecting biological samples (e.g., drug levels) to detect unreported medication use [1].
- Prevention Protocol: Use statistical methods like imputation for missing data and plan sensitivity analyses to assess the potential impact of post-randomization confounding [1].
Problem: Faulty Maintenance Therapy Trial Design
- Issue: When clinically stabilized subjects are abruptly switched to placebo versus continuing active treatment, internal validity is compromised due to physiological perturbations from treatment discontinuation rather than true drug efficacy [1].
- Troubleshooting: Critically evaluate maintenance therapy RCTs for rapid discontinuation designs that may heighten relapse risk independent of true drug efficacy [1].
- Prevention Protocol: Utilize randomized discontinuation designs with gradual taper periods rather than abrupt switches to placebo [1].
Mitigating Limitations in Real-World Evidence Validation
Problem: Reconciling RCT Efficacy with RWE Effectiveness
- Issue: RCTs measure efficacy under ideal conditions while RWE captures effectiveness in routine practice, leading to potentially conflicting results [3] [4].
- Troubleshooting: Clearly distinguish between efficacy (can it work under ideal conditions?) and effectiveness (does it work in real-world practice?) when interpreting apparently discordant results [4].
- Prevention Protocol: Design pragmatic trials that blend RCT methodology with real-world practice elements. Use RWE to inform RCT design by identifying appropriate patient populations and comparators [5] [6].
Problem: Confounding in RWE Studies
- Issue: Observational studies used to generate RWE are vulnerable to confounding by indication, severity, and other unmeasured factors [5].
- Troubleshooting: Employ causal inference methods, including directed acyclic graphs (DAGs) to explicitly define confounding structures, and use E-values to assess robustness to unmeasured confounding [5].
- Prevention Protocol: Pre-specify analysis plans using methods like propensity score matching, instrumental variables, or difference-in-differences to address confounding [5].
Frequently Asked Questions (FAQs)
Q1: If RCTs have so many limitations, why are they still considered the gold standard? RCTs remain the best available design for establishing causal inference because randomization, when properly implemented, balances both known and unknown confounding factors at baseline. This provides superior internal validity compared to observational designs, despite acknowledged limitations [1] [7] [8].
Q2: How can we assess whether a specific RCT's findings apply to our patient population? Carefully examine the study's eligibility criteria, recruitment pathway (how patients entered the trial), participant flow (CONSORT diagram), and baseline characteristics. Consider whether your patient would have met inclusion criteria and whether the treatment protocols are feasible in your setting [1] [2].
Q3: What are the most underappreciated threats to RCT validity? Post-randomization biases are frequently overlooked. These include differential dropout, non-adherence, use of rescue medications, and exposure to external factors that occur after randomization but can seriously compromise the balance achieved through initial random assignment [1].
Q4: How can RWE and RCTs be used together most effectively? RWE can inform RCT design by identifying appropriate patient populations, endpoints, and comparators. Conversely, RCT findings can be validated and extended through RWE studies examining long-term outcomes, rare adverse events, and effectiveness in diverse populations [3] [4] [5].
Q5: What methodological innovations are addressing RCT limitations? Adaptive trial designs, platform trials, and sequential designs are making RCTs more flexible and efficient. Meanwhile, the integration of electronic health records into clinical trials is facilitating more pragmatic designs that better reflect real-world practice [5].
Experimental Protocols & Methodologies
Protocol for Validating RWE Against RCT Findings
Objective: To systematically compare treatment effects derived from real-world evidence with those from randomized controlled trials for the same clinical question.
Methodology:
- Define Clinical Question: Precisely specify population, intervention, comparator, and outcomes [4]
- Identify RCTs: Conduct systematic literature review to identify relevant RCTs
- Source RWE: Identify appropriate real-world data sources (electronic health records, claims data, registries) capturing the same clinical scenario [4] [6]
- Harmonize Definitions: Standardize patient eligibility criteria, treatment definitions, and outcome measurements across data sources
- Analyze RWE: Apply appropriate causal inference methods (propensity score matching, weighting, or stratification) to address confounding [5]
- Compare Effects: Quantitatively compare treatment effect estimates using meta-analytic approaches
- Investigate Heterogeneity: Explore sources of differing results through subgroup and sensitivity analyses
Protocol for Addressing Post-Randomization Bias in RCTs
Objective: To identify, measure, and account for biases introduced after randomization in clinical trials.
Methodology:
- Pre-specify Monitoring: Define potential post-randomization biases (rescue medication use, crossover, dropout) in statistical analysis plan [1]
- Implement Enhanced Monitoring: Track and document reasons for all protocol deviations, dropouts, and concomitant treatments
- Collect Supplemental Data: Where feasible, use biological assays to verify adherence and detect unreported medication use [1]
- Apply Statistical Methods: Use appropriate methods (e.g., inverse probability weighting, multiple imputation) to account for missing data not missing at random
- Conduct Sensitivity Analyses: Test robustness of findings under different assumptions about post-randomization events
Data Tables
Table 1: Comparison of RCTs and Real-World Evidence
| Characteristic | Randomized Controlled Trials | Real-World Evidence |
|---|---|---|
| Primary Purpose | Establish efficacy [3] | Measure effectiveness [3] |
| Setting | Experimental, highly controlled [3] [4] | Real-world clinical practice [3] [4] |
| Patient Selection | Strict inclusion/exclusion criteria [1] [4] | Broad, representative populations [4] |
| Treatment Protocol | Fixed, per protocol [3] [4] | Variable, at physician's discretion [3] [4] |
| Comparator | Placebo or selective active control [3] | Multiple alternative interventions [3] |
| Patient Monitoring | Continuous, intensive [3] [4] | Routine clinical practice [3] [4] |
| Key Strength | High internal validity [1] [8] | High external validity [4] [5] |
| Main Limitation | Limited generalizability [1] [2] | Potential for confounding [5] |
Table 2: Common RCT Limitations and Methodological Solutions
| Limitation Category | Specific Issues | Proposed Solutions |
|---|---|---|
| External Validity | Narrow eligibility criteria [1]; unrepresentative settings [2] | Pragmatic trials; broad eligibility criteria [2] [5] |
| Internal Validity | Faulty randomization [8]; poor blinding [1]; post-randomization biases [1] | Allocation concealment [8]; statistical correction methods [1] |
| Intervention-Related | Non-blinding of patients [1]; abrupt treatment switches [1] | Active comparators; randomized discontinuation designs [1] |
| Measurement Issues | Use of proxy outcomes [1]; inappropriate rating instruments [1] | Patient-centered outcomes; validated instruments [1] |
Visualizations
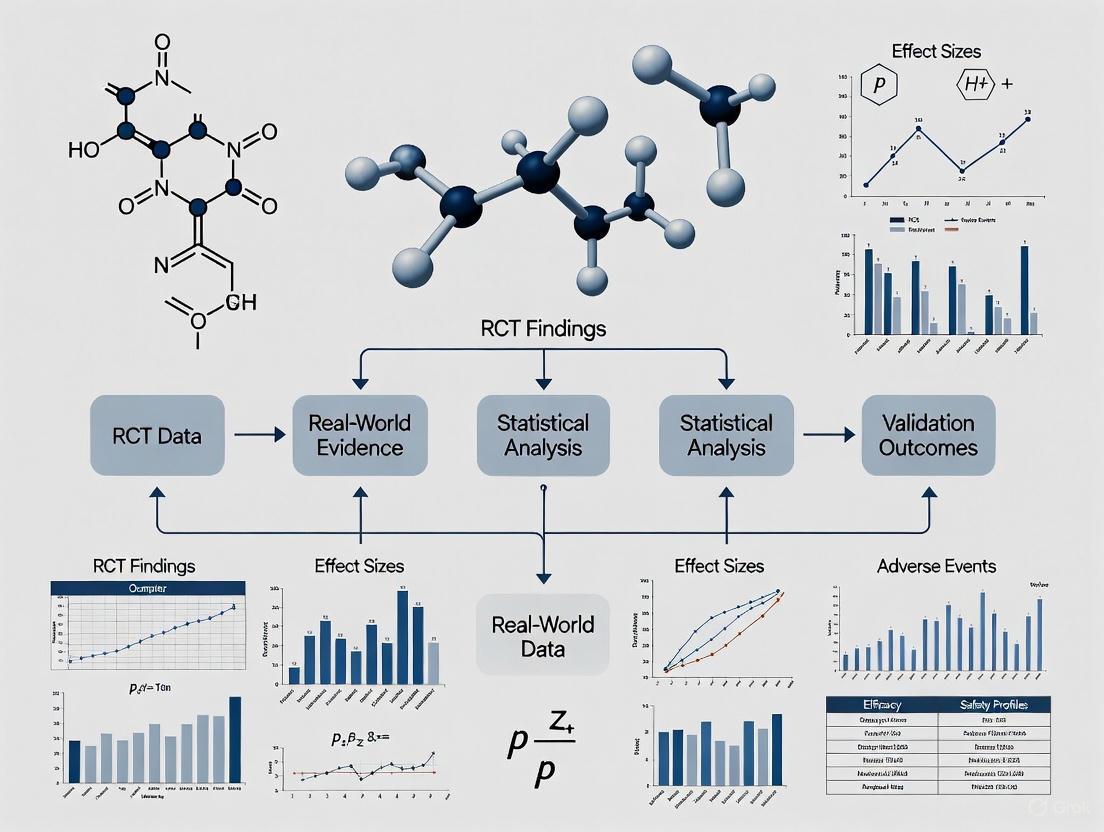
Relationship Between RCTs and RWE in Evidence Generation
Relationship Between RCT and RWE Evidence
RCT Limitations and Mitigation Strategies
RCT Limitations and Mitigation Strategies
The Scientist's Toolkit: Essential Research Reagents
Table 3: Key Methodological Tools for RCT and RWE Research
| Tool Category | Specific Methods | Primary Function | Application Context |
|---|---|---|---|
| Study Design | Pragmatic trials [5] | Blend RCT rigor with real-world relevance | Effectiveness research; comparative effectiveness |
| Study Design | Adaptive designs [5] | Modify trial parameters based on interim data | Efficient drug development; rare diseases |
| Bias Control | Allocation concealment [8] | Prevent foreknowledge of treatment assignment | Minimizing selection bias in RCTs |
| Bias Control | Causal inference methods [5] | Address confounding in observational data | Generating valid RWE from real-world data |
| Data Sources | Electronic health records [4] [6] | Provide comprehensive clinical data | RWE generation; patient recruitment |
| Data Sources | Clinical registries [4] [6] | Systematically collect disease/treatment data | Post-market surveillance; comparative effectiveness |
| Statistical Methods | Propensity score analysis [5] | Balance confounders in non-randomized studies | RWE validation against RCT findings |
| Statistical Methods | Fragility Index [7] | Quantify robustness of RCT results | Critical appraisal of small RCTs |
| Outcome Assessment | Patient-reported outcomes [6] | Capture patient perspective on treatment impact | Complementing clinical outcomes in both RCTs and RWE |
| SBI-797812 | SBI-797812, CAS:2237268-08-3, MF:C19H22N4O4S, MW:402.469 | Chemical Reagent | Bench Chemicals |
| Tedalinab | Tedalinab|Selective CB2 Agonist|RUO | Bench Chemicals |
Troubleshooting Guide: Common RWD Challenges and Solutions
Data Quality and Completeness
| Challenge | Root Cause | Impact on Research | Solution | Validation Approach |
|---|---|---|---|---|
| Missing Data | Data not collected during routine care; fragmented health records [9] | Introduces selection bias; reduces statistical power [9] | Implement multiple imputation techniques; use data linkage (PPRL) to fill gaps [9] | Compare characteristics of patients with complete vs. missing data; perform sensitivity analyses [10] |
| Inconsistent Data | Lack of standardization across different healthcare systems and coding practices (e.g., ICD-10, SNOMED) [10] | Leads to misclassification of exposures, outcomes, and confounders [9] | Use AI/NLP tools to standardize unstructured data from clinical notes; map to common data models (e.g., OHDSI, Sentinel) [11] [10] | Conduct validation sub-studies to check coding accuracy against source documents [4] |
| Lack of Clinical Granularity | Claims data designed for billing, not research; EHRs may lack lifestyle or socio-economic factors [11] [12] | Inability to control for key confounders or accurately phenotype patients [9] | Link RWD to specialized registries or patient-reported outcomes [11] [13] | Compare RWD-derived phenotypes with adjudicated clinical outcomes in a sample [11] |
Methodological and Confounding Issues
| Challenge | Root Cause | Impact on Research | Solution | Validation Approach |
|---|---|---|---|---|
| Channeling Bias & Confounding by Indication | Lack of randomization; treatments chosen based on patient prognosis [9] [4] | Distorts true treatment effect; estimated effects may reflect patient differences, not drug efficacy [9] | Employ Target Trial Emulation: pre-specify a protocol mimicking an RCT [12] [9] | Compare RWE results with existing RCT findings on the same clinical question [14] |
| Time-Related Biases | Incorrect handling of immortal time or time-window biases in longitudinal data [9] | Can lead to significantly inflated or deflated estimates of treatment effectiveness [9] | Apply rigorous longitudinal study designs (e.g., new-user, active comparator designs) [11] | Conduct quantitative bias analysis to model the potential impact of unmeasured confounding [14] |
| Generalizability vs. Internal Validity Trade-off | RWD includes broader populations but with more confounding [13] | High external validity may come at the cost of reduced internal validity [13] | Use Propensity Score Matching/Weighting to create balanced comparison cohorts from real-world populations [12] [14] | Assess covariate balance after weighting/matching; report on both internal and external validity [13] |
Frequently Asked Questions (FAQs)
Data and Methodology
Q1: How can I assess whether a real-world data source is "fit-for-purpose" for my specific research question? Begin by evaluating the provenance, quality, and completeness of the RWD source for the key variables you need [9]. For a study on drug efficacy, the data must accurately capture the exposure, the primary outcome, and the major confounders. If key confounders are not recorded, the dataset may be unsuitable for causal inference, though it might still be useful for descriptive analyses. Always pre-specify a quality assessment plan [10].
Q2: What is the single most important methodological practice to improve the robustness of RWE? Target Trial Emulation is considered a gold-standard framework [12]. Before analyzing the data, you should write a detailed protocol that mimics a hypothetical randomized controlled trial, explicitly defining all components: eligibility criteria, treatment strategies, assignment procedures, outcomes, follow-up, and causal contrast of interest. This rigorous design step minimizes ad hoc, data-driven analyses that are prone to bias [12] [9].
Q3: When is it appropriate to use an external control arm built from RWD, and what are the key pitfalls? External control arms (ECAs) are particularly valuable in oncology, rare diseases, and single-arm trials where randomization is unethical or impractical [15] [14]. The primary pitfall is inadequate confounding control due to systematic differences between the trial population and the external control. To mitigate this, ensure the RWD is from a similar clinical context and use robust statistical methods like propensity score weighting on baseline patient characteristics to improve comparability [15].
Validation and Regulation
Q4: How can I validate the findings from my RWE study against RCT evidence? The most direct method is to conduct a RWE replication study of an existing RCT whose results are known. Design your RWE study to emulate the target RCT as closely as possible in terms of population, intervention, comparator, and outcome. Then, compare the effect estimates. Consistency between the RWE and RCT findings strengthens the credibility of the RWE. Discrepancies require careful investigation into sources, such as unmeasured confounding or differences in patient populations [14].
Q5: What is the current regulatory stance on using RWE to support new drug applications? Major regulatory agencies, including the FDA and EMA, have established frameworks for using RWE [11] [4]. The acceptance of RWE is growing, particularly for supporting label expansions (as with palbociclib for male breast cancer) and post-marketing safety studies [11] [4]. Using RWE to demonstrate efficacy for new drug approvals is less common but increasingly accepted in specific contexts, especially when RCTs are not feasible. The key regulatory requirement is that the RWE must be "fit for purpose" and meet rigorous scientific standards for data quality and study design [11] [13].
Key Analytical Workflows
Workflow for Generating Valid RWE
The following diagram illustrates the core methodological workflow for transforming raw RWD into validated real-world evidence.
RWE Validation Pathway Against RCTs
This diagram outlines a systematic approach for validating Real-World Evidence findings by benchmarking them against Randomized Controlled Trial results.
Research Reagent Solutions: Essential Methodological Tools
The following table details key methodological "reagents" and their application in RWE generation and validation.
| Research Reagent | Function & Purpose | Key Considerations |
|---|---|---|
| Privacy-Preserving Record Linkage (PPRL) | Links patient records across disparate data sources (e.g., EHRs, claims, registries) without exposing personal identifiers, creating a more comprehensive patient journey [9]. | Essential for overcoming data fragmentation. Tokens must be created consistently across data partners to ensure accurate matching while complying with privacy regulations [9]. |
| Common Data Models (CDMs) | Standardizes the structure and content of disparate RWD sources (e.g., OMOP-CDM used by OHDSI and EHDEN), enabling scalable, distributed analysis [11]. | Reduces interoperability challenges. Requires significant investment to map local data to the common model, but enables large-scale network studies [11] [4]. |
| Natural Language Processing (NLP) | Extracts structured information (e.g., disease severity, patient status) from unstructured clinical notes in EHRs, unlocking rich clinical detail [11] [15]. | Critical for phenotyping and capturing confounders not in structured data. Models require training and validation for specific use cases and clinical terminologies [10] [15]. |
| Propensity Score Methods | A statistical technique to simulate randomization by creating a balanced comparison group, reducing selection bias by accounting for measured confounders [12] [14]. | Only balances measured covariates. The quality of the resulting evidence hinges on the researcher's ability to capture and include all key confounders in the model [9]. |
| Synthetic Control Arms | Uses existing RWD to construct a virtual control group for a single-arm trial, especially useful in rare diseases or oncology [11] [15]. | The validity depends on the similarity between the trial patients and the RWD population. Rigorous statistical adjustment is required to minimize channeling bias [15] [14]. |
Understanding the Gap: Efficacy vs. Effectiveness
What is the efficacy-effectiveness gap in clinical research?
The efficacy-effectiveness gap refers to the observed differences between how a medical intervention performs under the ideal, controlled conditions of a randomized controlled trial (RCT) and how it performs in routine clinical practice. Efficacy is what is measured in RCTs (can it work?), while effectiveness is what happens in real-world settings (does it work in practice?) [11].
This gap arises because RCTs and real-world evidence (RWE) studies differ fundamentally in their design, population, and setting, as summarized in the table below.
Table 1: Key Differences Between RCTs and Real-World Evidence (RWE) Studies [16] [11]
| Aspect | Randomized Controlled Trial (RCT) | Real-World Evidence (RWE) Study |
|---|---|---|
| Primary Purpose | Demonstrate efficacy under ideal, controlled settings [11] | Demonstrate effectiveness in routine care [11] |
| Population & Criteria | Narrow inclusion/exclusion criteria; homogeneous subjects [16] [11] | Broad, few strict criteria; reflects typical, diverse patients [16] [11] |
| Setting & Protocol | Experimental research setting with fixed, prespecified intervention [11] | Actual practice with variable treatment based on physician/patient choices [11] |
| Patient Monitoring | Rigorous, scheduled follow-up [11] | Variable follow-up at clinician discretion [11] |
| Data Collection | Structured case report forms for research [16] | Routine clinical records, claims data, patient registries [16] [17] |
| Key Strength | High internal validity; strong causal inference due to randomization [16] | High external validity; generalizability to broader populations [16] |
Troubleshooting Common RWE Validation Challenges
FAQ: Why is validation of Real-World Evidence against RCT findings necessary?
Validation is crucial because RWE is generated from real-world data (RWD) that are often collected for purposes other than research (e.g., clinical care, billing). Without validation, findings from RWE studies may be influenced by confounding variables, missing data, or other biases that can lead to incorrect conclusions about a treatment's safety or effectiveness [16] [18]. Validation against the gold-standard RCT helps establish that the RWE is fit-for-purpose and reliable for regulatory and clinical decision-making [17].
The most common and challenging sources of bias in RWE studies include:
- Confounding: When an unmeasured factor is associated with both the treatment and the outcome. RCTs minimize this through randomization [18].
- Selection Bias: Occurs if the study population is not representative of the target population, often due to how data are captured in EHRs or claims databases [11].
- Information Bias: Results from misclassification of exposures or outcomes, which can happen if coding practices in claims data are inconsistent [19].
FAQ: My RWE study results are inconsistent with prior RCTs. What should I investigate first?
When facing discrepant results, systematically investigate these potential causes first:
- Study Population Differences: Compare the baseline characteristics (e.g., age, comorbidities, disease severity, prior treatments) of your RWE cohort with the RCT population. RWE often includes older, sicker patients with more co-morbidities [16] [20].
- Treatment Patterns: Analyze treatment adherence, dose modifications, and treatment duration in the real world, as these often differ from the strict RCT protocol [11].
- Comparator Group Appropriateness: Ensure the real-world comparator group is a valid approximation for the RCT control arm. Use causal inference methods to balance baseline characteristics [18].
Experimental Protocols for RWE Validation
Protocol: Designing a Study to Validate RWE Against an RCT
This protocol outlines a methodology for assessing the reliability of RWE by benchmarking it against an existing RCT.
1. Define the Objective and Identify a Reference RCT
- Clearly state the clinical question (e.g., "Does drug X improve overall survival versus standard care in population Y?").
- Identify a pivotal RCT that has established efficacy for this question. The RCT's protocol and statistical analysis plan should be available for comparison [21].
2. Emulate the RCT Design Using RWD
- Population Emulation: Apply the RCT's key eligibility criteria to the RWD source (e.g., EHR or claims database) to create a "RCT-like" cohort [20].
- Treatment and Comparator Definition: Clearly define the initiation of treatment and identify a comparable control group within the RWD.
- Outcome Ascertainment: Ensure the outcome (e.g., overall survival, progression-free survival) can be accurately captured from the RWD [18].
3. Implement Advanced Analytical Methods
- Use techniques like propensity score matching or weighting to balance the baseline characteristics between the treatment and comparator groups in the RWD, mimicking the randomization of the RCT [11] [18].
- Conduct extensive sensitivity analyses to test how robust the findings are to potential unmeasured confounding [18].
4. Compare and Interpret Results
- Quantitatively compare the treatment effect estimates (e.g., hazard ratio for survival) from the RWE analysis and the reference RCT.
- A high degree of consistency between the two increases confidence in the RWE. If a gap exists, investigate the potential sources (see FAQ above) [20].
Protocol: Framework for Selecting an RWE Assessment Tool
With numerous tools available, this protocol helps select the right one for your study's needs [18].
1. Define the Use Case Determine the primary goal of the assessment:
- Protocol Development: Tools that help design a robust RWE study.
- Study Reporting: Checklists to ensure transparent and complete reporting of methods and results.
- Quality Assessment: Tools to critically appraise the reliability of an existing RWE publication.
2. Evaluate Tool Characteristics
- Domains Covered: Ensure the tool addresses key areas like data source suitability, confounding control, and statistical methods.
- Scoring System: Check if it uses a binary (yes/no) or scaled scoring system.
- Validation Status: Prefer tools that have been formally validated.
- Intended User: Some tools are for study authors, others for reviewers or regulators [18].
3. Apply the Tool Systematically
- Use the selected tool as a guide during the study design, manuscript writing, or critical appraisal phase.
- Document responses to each item in the tool to ensure transparency and reproducibility.
Table 2: Categories of RWE Assessment Tools [18]
| Tool Category | Primary Use Case | Key Characteristics | Example Tools (from literature) |
|---|---|---|---|
| Protocol Development | Guiding the design and planning of a new RWE study. | Often detailed frameworks and templates. | ISPOR Good Practices, FDA RWE Framework [17] [18] |
| Study Reporting | Ensuring complete and transparent reporting of completed RWE studies. | Typically structured as checklists. | CONSORT-ROUTINE, ESMO-GROW [18] |
| Quality Assessment | Critically appraising the reliability and risk of bias in published RWE. | May include scoring systems to grade quality. | ROBINS-I, NICE Checklist [18] |
The Scientist's Toolkit: Essential Reagents for RWE Validation
Table 3: Key Research Reagent Solutions for RWE Validation
| Tool / Solution | Function / Description | Application in RWE Validation |
|---|---|---|
| Propensity Score Methods | A statistical technique that models the probability of receiving a treatment given observed baseline characteristics [11]. | Creates a balanced pseudo-population in RWD, mimicking the randomization of an RCT to reduce confounding by indicated factors [11] [18]. |
| Sensitivity Analysis | A method to quantify how strong an unmeasured confounder would need to be to change the study conclusions [18]. | Tests the robustness of RWE findings and provides evidence for or against causal inference in the absence of randomization [18]. |
| Common Data Models (CDMs) | Standardized structures for organizing healthcare data from diverse sources (e.g., EHR, claims). | Enables large-scale, reproducible analysis across different RWD networks (e.g., OHDSI, FDA Sentinel) [11] [22]. |
| Natural Language Processing (NLP) | AI-based technology that extracts structured information from unstructured clinical text (e.g., physician notes) [11]. | Uncovers critical clinical details not found in coded data alone, improving phenotyping accuracy and outcome ascertainment [11]. |
| Structured Treatment Plans | Pre-registered study protocols and statistical analysis plans published before analysis begins. | Mitigates bias from data dredging and post-hoc analysis choices; aligns with best practices for regulatory-grade RWE [21] [18]. |
| Thiol-PEG3-acid | Thiol-PEG3-acid|HS-PEG3-COOH Reagent|1347750-82-6 | |
| TIQ-15 | TIQ-15, MF:C23H32N4, MW:364.5 g/mol | Chemical Reagent |
Frequently Asked Questions (FAQs)
General Validation Concepts
What is the core purpose of validating Real-World Evidence (RWE) against Randomized Controlled Trial (RCT) findings? The core purpose is to establish whether RWE can provide credible, complementary evidence in situations where RCTs have limitations, such as lack of external validity, ethical constraints in control arms, or the use of non-standard endpoints. Validation ensures that RWE can reliably support regulatory and health technology assessment (HTA) decisions by confirming that its findings are consistent and scientifically rigorous [23] [24].
When is the use of RWE most appropriate to complement an RCT? RWE is most appropriate in specific complex clinical situations. The table below categorizes these scenarios and the corresponding RWE approaches.
Table: Complex Clinical Situations and Corresponding RWE Approaches
| Complex Clinical Situation | Category | Recommended RWE Approach |
|---|---|---|
| RCT population differs from local clinical practice population [23] [24] | Limited External Validity of RCTs | Conduct an environmental observational study to describe the local population, or transport/extrapolate RCT results to the target population of interest [23] [24]. |
| Conducting a randomized controlled trial is unfeasible or unethical (e.g., rare diseases) [23] [24] | Treatment Comparison Issues | Create an External Control Arm (ECA) from RWD for a single-arm trial or emulate a target trial using RWD [23] [25] [24]. |
| The clinical trial uses a surrogate endpoint (e.g., progression-free survival) instead of a gold-standard endpoint (e.g., overall survival) [23] [24] | Non-Standard Endpoints | Use RWE to evaluate the correlation between the surrogate endpoint and the gold-standard endpoint in a real-world setting post-approval [23] [24]. |
| The comparator drug used in the RCT is no longer the standard of care at the time of HTA assessment [23] [24] | Treatment Comparison Issues | Conduct a post-launch RWE study to directly compare the new drug against the current standard of care [23] [24]. |
Regulatory and Methodological Considerations
What are the most critical methodological factors for ensuring RWE credibility? Robust methodology is paramount to address inherent biases in observational data. Key considerations include [23] [25] [24]:
- Confounding Identification: Use tools like Directed Acyclic Graphs (DAGs) to identify potential confounding factors.
- Advanced Statistical Techniques: Apply methods like propensity score matching, inverse probability of treatment weighting, or G-computation to adjust for differences between treatment groups.
- Sensitivity Analyses: Perform analyses to quantify the impact of potential residual biases, such as unmeasured confounding.
- Prespecified Protocols: Finalize study protocols and statistical analysis plans before initiating data analysis to avoid bias from selectively reporting results [25].
What are the key regulatory expectations for using RWE in a submission? Regulators like the FDA emphasize several best practices [17] [25]:
- Early and Ongoing Engagement: Engage with regulators early to discuss and align on the study design, data sources, and methodological approach before initiating the study [25].
- Fit-for-Purpose Data: Conduct thorough feasibility assessments to justify that the selected data source is appropriate for the research question [25].
- Data Quality and Reliability: Ensure data are accurate, complete, and traceable. The FDA must be able to access and verify study records [25].
- Internal Validity: Implement rigorous methodologies to identify and mitigate biases, ensuring the study's findings are valid [25].
Troubleshooting Guides
Challenge: Addressing Concerns about External Validity
Problem: The results from my RCT may not be generalizable to the broader patient population in clinical practice.
Solution: Use RWE to assess and enhance transportability.
- Define the Target Population: Clearly describe the "real-world" target population using RWD sources like electronic health records or registries [23] [24].
- Identify Differences: Compare the characteristics of the RCT population and the target RWD population to identify key differences (e.g., age, comorbidities, ethnicity) [23] [24].
- Apply Statistical Transportability Methods: Use quantitative techniques, such as weighting or outcome regression models, to transport the RCT treatment effect estimate to the target population. This helps bridge the efficacy-effectiveness gap [24].
Challenge: Validating a Study with a Single-Arm Trial
Problem: I am developing a treatment for a rare disease where a concurrent control arm is not feasible. Regulatory agencies are questioning the validity of the observed effects.
Solution: Construct a robust External Control Arm (ECA) from RWD.
- Ensure Natural History is Well-Defined: The ECA approach is most defensible when the natural history of the disease is highly predictable and well-characterized [25].
- Prioritize Comparability: The treatment group and the ECA must be as similar as possible. Carefully select the RWD source to ensure granular data on patient characteristics, disease severity, and prior lines of therapy are available [25] [24].
- Mitigate Bias Proactively: Address potential selection bias and confounding through the design and analysis plan [24]. Use propensity score methods to match the ECA patients to the single-arm trial patients on key prognostic variables [23] [24].
- Engage Regulators Early: Seek agreement from regulators on the choice of data source, ECA construction methodology, and analysis plan before finalizing the study design [25].
Challenge: Responding to a Regulatory Query on Data Quality
Problem: A regulator has questioned the reliability and provenance of the RWD used in our submission.
Solution: Demonstrate comprehensive data quality assurance.
- Document Data Provenance: Maintain a clear record of the data's origin, including how it was collected, processed, and transformed [25].
- Ensure Traceability: The data must be traceable back to the original source records. Be prepared for a potential audit where regulators may request to verify study records [25].
- Transform Data to Standards: Transform the RWD into compliant formats, such as those required by the Clinical Data Interchange Standards Consortium (CDISC), to facilitate regulatory review [25] [26].
- Provide a Feasibility Assessment Report: Share the results of the fit-for-purpose assessment that justified the selection of your specific data source for the research question [25].
The Scientist's Toolkit: Essential Reagents for RWE Validation
Table: Key Methodological and Regulatory Solutions for RWE Studies
| Tool / Solution | Function / Purpose | Key Considerations |
|---|---|---|
| Propensity Score Methods [23] [24] | A statistical technique to balance covariates between a treatment group and an RWD-based control group, reducing selection bias. | Choose the appropriate method (matching, weighting, stratification). Always include sensitivity analyses to test robustness. |
| Directed Acyclic Graph (DAG) [23] [24] | A visual tool to map out assumed causal relationships, helping to identify and minimize confounding bias before analysis. | Requires strong subject-matter knowledge to build correctly. It is a prerequisite for robust adjustment. |
| Sensitivity Analysis [23] [24] | A set of analyses to quantify how strong an unmeasured confounder would need to be to change the study conclusions. | Essential for establishing result robustness. Methods include E-value and probabilistic sensitivity analysis. |
| Structured Protocol & SAP [25] | A pre-defined, detailed study protocol and statistical analysis plan (SAP) finalized before data analysis. | Critical for regulatory acceptance. Prevents data dredging and preferential reporting of results. |
| Good Clinical Practice (GCP) for RWD Studies [25] | A framework for ensuring study conduct and data integrity meet regulatory standards, even in non-interventional settings. | Involves study monitoring, compliance with final protocols, and maintaining an audit trail. |
| TMP778 | TMP778|Potent RORγt Inhibitor|For Research Use | TMP778 is a potent, selective RORγt inverse agonist that suppresses Th17 cell differentiation and IL-17 production. For Research Use Only. Not for human or veterinary use. |
| TMP920 | TMP920|RORγt Inhibitor |
Experimental Protocol: Workflow for Validating an External Control Arm
The following diagram outlines a high-level workflow for designing a study that uses RWD to build an External Control Arm, incorporating key validation and regulatory steps.
Protocol Title: Validation of an External Control Arm Derived from Real-World Data for a Single-Arm Trial.
Objective: To generate robust comparative evidence for a new therapeutic agent in a rare disease by constructing a validated ECA from RWD, suitable for regulatory decision-making.
Methodology:
- Define and Align (Pre-Study):
- ECA Construction:
- Select a high-quality RWD source that is fit-for-purpose. The data must be relevant, with sufficient granularity on patient characteristics, disease history, and prior treatments to enable adequate adjustment for confounding [23] [25] [24].
- Apply advanced statistical methods, such as propensity score matching or weighting, to balance the ECA and the single-arm trial population on key prognostic factors. The goal is to achieve a high degree of comparability between the groups [23] [24].
- Analysis and Validation:
- Execute the pre-specified analysis to compare outcomes between the treatment group and the ECA.
- Conduct extensive sensitivity analyses to assess the impact of potential unmeasured confounding and other biases on the study results. This is essential for establishing the robustness of the findings [23] [24].
- Reporting and Submission:
- Submit the complete study package to regulators, ensuring full transparency and providing access to patient-level data in compliant formats to facilitate review [25].
Logical Framework: Integrating RWE into the Clinical Development Lifecycle
The following diagram illustrates the strategic points in a product's lifecycle where RWE can be generated and integrated with RCT evidence to build a comprehensive evidence package.
Methodological Frameworks for RWE Validation: From Design to Analysis
Technical Support Center: Troubleshooting Common TTE Challenges
This section addresses specific, practical issues researchers may encounter when designing and implementing a Target Trial Emulation (TTE) study, providing guidance on their mitigation.
Frequently Asked Questions (FAQs)
FAQ 1: How do I handle a situation where my real-world data (RWD) source lacks a key clinical variable needed for confounding adjustment?
- Issue: This is a fundamental data limitation leading to potential unmeasured or residual confounding [27] [28]. The target trial framework itself cannot resolve this problem, as it relates to data quality rather than study design [29] [28].
- Troubleshooting Guide:
- A Priori Confounder Selection: Define adjustment variables based on the target trial protocol and subject-matter knowledge, not just data availability [30].
- Quantitative Bias Analysis: Perform sensitivity analyses to quantify how strong an unmeasured confounder would need to be to explain away the observed effect [30].
- Data Linkage: Explore linking your primary RWD source to other datasets (e.g., linking claims data with a clinical registry) that might contain the missing variable [27].
- Transparent Reporting: Clearly state the limitation and list the potential confounders that could not be adjusted for in your analysis [27].
FAQ 2: What should I do if emulating the "intention-to-treat" (ITT) principle leads to a large loss of participants after propensity score matching?
- Issue: Strict emulation of the target trial's eligibility criteria and treatment strategies can sometimes result in a small analytical sample, reducing statistical power and potentially affecting representativeness [27].
- Troubleshooting Guide:
- Diagnose the Bottleneck: Identify which specific eligibility criterion (e.g., a specific comorbidity) or treatment definition is causing the high exclusion rate.
- Check Population Overlap: Use propensity score histograms to visually assess the overlap between treatment and comparator groups. A large loss of patients may indicate a lack of clinical equipoise in the real world [27].
- Consider Sensitivity Analyses: Explore the robustness of your results using different analytical approaches, such as inverse probability weighting instead of matching, which uses data from all eligible individuals [30].
FAQ 3: Why are my TTE results statistically different from a published Randomized Controlled Trial (RCT) on the same intervention?
- Issue: Despite a well-emulated design, discrepancies with RCT results can arise [31].
- Troubleshooting Guide:
- Verify Emulation Fidelity: Re-check that all key components of the target trial (eligibility, treatment strategy, time-zero, outcome) were correctly emulated. A common pitfall is miscalibrating the "time-zero" [27] [32].
- Investigate Residual Confounding: Revisit the possibility of unmeasured confounding or confounding by indication, which remains a key limitation of TTE [27].
- Assess Differences in Patient Population: The RCT may have included a highly selected population. Your RWD may include a broader, real-world population with different characteristics and risk profiles, leading to different effect estimates [27] [31].
- Check for Changes in Practice: The TTE might capture the drug's use in a different era or clinical context post-approval, where prescribing patterns or concomitant care have shifted [31].
Experimental Protocols for Key TTE Analyses
This section provides a detailed methodological blueprint for a core TTE study, focusing on comparing the effectiveness of two treatments.
Detailed Protocol: Comparative Effectiveness of Drug A vs. Drug B
This protocol outlines the steps to emulate a hypothetical RCT comparing two treatments using a healthcare database.
1. Target Trial Protocol Specification: The first step is to explicitly define the protocol of the hypothetical target trial that would ideally answer the causal question [29] [30] [32].
- Eligibility Criteria: Define inclusion/exclusion criteria (e.g., adults with first diagnosis of condition X, no prior use of Drug A or B, no contraindications).
- Treatment Strategies: Clearly define the treatment strategies for both arms (e.g., initiation of Drug A vs. initiation of Drug B).
- Assignment Procedure: Specify how patients would be assigned to either treatment at random.
- Time Zero: The start of follow-up, defined as the date of meeting all eligibility criteria and being assigned a treatment strategy [27].
- Outcomes: Define the primary outcome (e.g., overall survival, hospitalization) and secondary outcomes, including how and when they are measured.
- Causal Contrast: State whether the intention-to-treat or per-protocol effect is the target of emulation [27].
2. Observational Study Emulation: The second step is to apply this protocol to the observational data [29].
- Eligibility & Cohort Creation: Apply the pre-specified eligibility criteria to the RWD source to create the study cohort.
- Define Time Zero: For each patient, establish a valid "time-zero" analogous to the point of randomization in the target trial [27] [32].
- Handle Treatment Assignment: Since treatment is not randomized, use methods like propensity score matching or inverse probability of treatment weighting to create a balanced sample where the treatment groups are comparable with respect to measured baseline covariates [30].
- Follow-Up: Begin follow-up at "time-zero" and continue until the earliest of: outcome occurrence, end of study period, loss to follow-up, or a protocol-specified censoring event (e.g., treatment discontinuation for per-protocol analysis).
- Outcome Assessment: Identify the outcome(s) based on the pre-specified definition within the follow-up period.
- Statistical Analysis: Analyze the data based on the pre-specified plan. For time-to-event outcomes, use Cox proportional hazards models. Report hazard ratios and confidence intervals.
The workflow for this protocol, from conception to result, is summarized in the diagram below.
Quantitative Validation: TTE vs. RCT Findings
A critical step in validating the TTE methodology is to benchmark its results against existing RCTs. The following table summarizes key quantitative findings from such comparative studies, directly supporting the thesis on RWE validation.
Table 1: Empirical Validation of TTE Against RCT Gold Standards
| Disease Area / Study | Number of Emulations / RCTs | Key Metric | Concordance Rate | Identified Reasons for Discrepancy |
|---|---|---|---|---|
| Metastatic Breast Cancer [31] | 8 RCTs emulated | Overall Survival (Hazard Ratio) | 7 out of 8 emulations showed consistent effect sizes | Residual confounders; shifts in prescription practices post-approval |
| Surgical & Non-Surgical Populations [27] | 32 clinical trials emulated (RCT-DUPLICATE) | Various efficacy and safety outcomes | High rate of replication for a selected subset | Data quality; inability to capture all trial variables; residual confounding |
| General Review [30] | Multiple meta-analyses | Various treatment effects | ~82% agreement (approx. 18% contradiction) | Primarily due to design flaws and unaddressed confounding in observational studies |
The Scientist's Toolkit: Essential Reagents for TTE
This section lists the key methodological components and data elements required to successfully implement a Target Trial Emulation.
Table 2: Key "Research Reagents" for Target Trial Emulation
| Item / Component | Category | Function & Importance in TTE |
|---|---|---|
| High-Quality RWD Source | Data | Foundation of the emulation. Requires completeness, accuracy, and longitudinal follow-up. Examples: EHRs, claims databases, quality registries [27] [30]. |
| Pre-specified Protocol | Methodology | The blueprint. Forces explicit declaration of eligibility, treatment strategies, time-zero, outcomes, and analysis plan before analysis begins, reducing bias [29] [32]. |
| "Time-Zero" Definition | Methodology | The anchor. Clearly defines the start of follow-up for all participants, analogous to randomization in an RCT. Critical for avoiding immortal time bias [27] [32]. |
| Confounding Adjustment Methods | Analytical Tool | Mimics randomization. Techniques like Propensity Score Matching/Weighting are used to balance baseline covariates between treatment groups, addressing measured confounding [30]. |
| Sensitivity Analysis Framework | Analytical Tool | Assesses robustness. Used to quantify how sensitive the results are to potential unmeasured confounding and other biases [30]. |
| TUG-1375 | TUG-1375, MF:C22H19ClN2O4S, MW:442.9 g/mol | Chemical Reagent |
| Tug-469 | Tug-469, CAS:1236109-67-3, MF:C23H23NO2, MW:345.4 g/mol | Chemical Reagent |
The diagram below illustrates how these components interact to address common biases in observational studies.
Troubleshooting Guides and FAQs
Frequently Asked Questions
Q1: My propensity score matched sample has significantly reduced sample size. What should I check? This is commonly caused by poor overlap between treatment and control groups or an overly restrictive caliper. First, examine the propensity score distributions using density plots to assess overlap. If substantial regions lack common support, consider using matching methods that preserve more data, such as full matching or optimal matching. Using a machine learning approach like gradient boosting for propensity score estimation may also improve the overlap by better modeling complex relationships [33].
Q2: How can I validate that my matched groups are sufficiently balanced?
Balance should be assessed using Standardized Mean Differences (SMD) for all covariates, where SMD < 0.1 indicates good balance. Generate visual diagnostics like Love plots to display covariate balance before and after matching. Additionally, conduct formal statistical tests comparing covariate distributions between groups post-matching; p-values > 0.05 suggest successful balancing. The cobalt package in R provides specialized tools for comprehensive balance evaluation [33] [34].
Q3: My observational study results differ from RCT findings. What could explain this? Differences can arise from several sources. First, assess whether you have adequately controlled for all key confounders; unmeasured confounding is a common limitation. Use sensitivity analyses like Rosenbaum bounds to quantify how strong an unmeasured confounder would need to be to explain away your results. Also consider differences in patient populations, treatment protocols, or outcome definitions between the real-world data and RCT context [5] [35].
Q4: When should I use machine learning instead of logistic regression for propensity scores? Machine learning methods are particularly beneficial when dealing with high-dimensional data (many covariates), complex non-linear relationships, or interaction effects. Gradient boosting and random forests can automatically detect these patterns without manual specification. However, ensure you use appropriate cross-validation to prevent overfitting, and remember that ML models may introduce additional complexity in variance estimation [33] [36].
Q5: How do I handle missing data in covariates when estimating propensity scores? Multiple imputation is generally recommended over complete-case analysis. After creating multiply imputed datasets, estimate propensity scores within each imputed dataset, then match within each dataset or use the averaged propensity score. Alternatively, include missingness indicators as additional covariates in the propensity model, though this approach requires careful consideration of the missingness mechanism [37].
Troubleshooting Common Technical Issues
Issue: Poor Covariate Balance After Matching
- Potential Causes: Inadequate propensity score model specification, insufficient overlap, or inappropriate matching method.
- Solutions:
- Revise your propensity score model: Add interaction terms or use more flexible machine learning methods if relationships are non-linear [33].
- Try different matching techniques: Switch from nearest-neighbor to full matching or optimal matching, which often yield better balance [33].
- Adjust caliper width: Slightly increase the caliper, but be cautious not to lose too many observations [33].
- Check for important omitted covariates: Revisit your causal diagram to ensure all relevant confounders are included [5].
Issue: Large Variance in Treatment Effect Estimates
- Potential Causes: Small effective sample size after matching, poor match quality, or heterogeneous treatment effects.
- Solutions:
- Use matching methods that retain more data: Full matching typically preserves more units than 1:1 matching [33].
- Incorporate machine learning for effect estimation: Implement Causal Forests to model and estimate heterogeneous treatment effects, which can provide more precise subgroup estimates [36] [35].
- Check for effect modification: Conduct subgroup analyses to identify sources of heterogeneity [36].
Issue: Computational Performance with Large Datasets
- Potential Causes: Inefficient matching algorithms or complex machine learning models.
- Solutions:
- Implement in-database analytics: Use SQL-based machine learning extensions like Adobe Experience Platform's Data Distiller for large-scale data without moving it [38].
- Optimize R code: Use data.table or dplyr packages for data manipulation, and consider parallel processing for complex matching [33].
- Sample strategically: For initial method development, work with a random sample before applying to the full dataset [38].
Experimental Protocols and Methodologies
Propensity Score Matching Protocol
The following workflow outlines the key stages of a robust propensity score matching analysis:
Phase 1: Data Preparation and Covariate Selection
- Clean data: Handle missing values, outliers, and ensure consistency [33].
- Select covariates: Include variables that influence both treatment assignment and outcome (confounders). Avoid including post-treatment variables or mediators [33].
- Create analytical dataset: Transform variables as needed and encode categorical variables appropriately [33].
Phase 2: Propensity Score Estimation
- Choose estimation method:
- Specify model: Treatment ~ Covariate1 + Covariate2 + ... + CovariateN [33].
- Extract propensity scores: Predicted probabilities of treatment assignment for each subject [33].
Phase 3: Pre-Matching Diagnostics
- Assess overlap: Plot density distributions of propensity scores by treatment group [33].
- Check common support: Identify regions where both groups have substantial density [33].
- Evaluate initial balance: Calculate SMDs for all covariates before matching [33].
Phase 4: Execute Matching
- Select matching method:
- Set caliper width: Typically 0.2 standard deviations of the logit propensity score [33].
- Implement matching: Use established packages like
MatchItin R [33].
Phase 5: Post-Matching Diagnostics
- Assess balance: Recalculate SMDs for all covariates in matched sample [33] [34].
- Visualize results: Create balance plots (Love plots) to display improvement [33].
- Report matching efficiency: Document number of units matched, discarded, and effective sample size [33].
Phase 6: Treatment Effect Estimation
- Analyze matched data: Use appropriate methods for matched data (paired t-tests, conditional regression) [33].
- Account for matching design: Use robust variance estimators or bootstrap methods [33].
- Conduct sensitivity analysis: Assess robustness to unmeasured confounding using Rosenbaum bounds or E-values [36].
Machine Learning-Enhanced Causal Inference Protocol
Implementation Steps for Causal Forest Analysis:
Data Preparation
Model Specification
Model Training
Treatment Effect Estimation
Heterogeneity Assessment
Validation and Sensitivity Analysis
Comparison of Propensity Score Estimation Methods
Table 1: Performance characteristics of different propensity score estimation approaches
| Method | Best Use Case | Advantages | Limitations | Balance Performance |
|---|---|---|---|---|
| Logistic Regression | Low-dimensional confounder sets, linear relationships | Interpretable, simple implementation, established practice | Misses complex interactions, prone to model misspecification | Good with correct specification |
| Gradient Boosting Machines (GBM) | High-dimensional data, non-linear relationships | Automatic feature selection, handles complex patterns | Computational intensity, risk of overfitting, less interpretable | Superior in high-dimensional settings [33] |
| Random Forests | Complex relationships, interaction effects | Robust to outliers, handles mixed data types | Can be computationally expensive | Good with complex dependencies |
| Causal Forests | Heterogeneous treatment effect estimation | Specifically designed for causal inference, "honest" estimation | Complex implementation, requires careful tuning | Excellent for heterogeneous effects [36] |
Balance Diagnostics Thresholds
Table 2: Key metrics and thresholds for evaluating matching quality
| Diagnostic Measure | Target Threshold | Interpretation | Tools/Functions |
|---|---|---|---|
| Standardized Mean Difference (SMD) | < 0.1 | Indicates adequate balance for that covariate | cobalt package, tableone package [33] |
| Variance Ratio | 0.8 - 1.25 | Similar spread of covariate values between groups | cobalt package [33] |
| Kolmorogov-Smirnov Statistic | > 0.05 | Similar distribution shapes between groups | cobalt package [33] |
| Effective Sample Size | > 70% of original | Indicates matching efficiency | MatchIt package [33] |
The Scientist's Toolkit: Research Reagent Solutions
Essential Software and Packages
Table 3: Key software tools for propensity score and machine learning analysis
| Tool/Package | Primary Function | Key Features | Implementation Example |
|---|---|---|---|
| MatchIt (R) | Propensity score matching | Multiple matching methods, comprehensive diagnostics | matchit(treatment ~ covariates, data, method="nearest") [33] |
| cobalt (R) | Balance assessment | Love plots, multiple balance statistics, publication-ready output | bal.plot(matched_data, var.name = "covariate") [33] |
| grf (R) | Causal forest implementation | Honest estimation, confidence intervals, heterogeneity detection | causal_forest(X, Y, W) where W is treatment [36] |
| Data Distiller SQL ML | Large-scale in-database analytics | SQL-based machine learning, no data movement required | CREATE MODEL propensity_model PREDICT treatment USING covariates [38] |
| Scikit-learn (Python) | Machine learning for PS estimation | Multiple algorithms, hyperparameter tuning | GradientBoostingClassifier().fit(X, y) |
| V-9302 | V-9302, CAS:1855871-76-9, MF:C34H38N2O4, MW:538.69 | Chemical Reagent | Bench Chemicals |
| Vidupiprant | Vidupiprant, CAS:1169483-24-2, MF:C28H27Cl2FN2O6S, MW:609.5 g/mol | Chemical Reagent | Bench Chemicals |
Methodological Frameworks
Table 4: Analytical frameworks for RWE validation against RCTs
| Framework | Primary Application | Key Components | Regulatory Acceptance |
|---|---|---|---|
| Target Trial Emulation | Designing observational studies to mimic RCTs | Explicit protocol, eligibility criteria, treatment strategies | Emerging acceptance for specific applications [35] |
| Transportability Analysis | Generalizing RCT findings to broader populations | Selection models, inverse odds weighting | Moderate, used in regulatory discussions [35] |
| Synthetic Control Arms | Creating external controls when RCTs are infeasible | Historical data, propensity score weighting, matching | Used in regulatory approvals for specific contexts [11] [35] |
| Doubly Robust Methods | Combining outcome and treatment models | Augmented IPW, Targeted Maximum Likelihood Estimation (TMLE) | Growing acceptance with rigorous implementation [35] |
Technical Support Center: PPRL Troubleshooting Guides and FAQs
This section addresses common technical and methodological challenges researchers face when implementing Privacy-Preserving Record Linkage in studies that integrate real-world evidence (RWE) and randomized controlled trial (RCT) data.
FAQ 1: How Do We Balance Linkage Accuracy with Privacy Protection Strength?
Issue: A proposed PPRL method shows excellent match rates but is suspected to have lower privacy security.
Solution:
- Action: Evaluate the method using a multi-indicator framework. Relying on a single metric (like match rate alone) fails to capture the inherent trade-offs in PPRL. A comprehensive assessment must balance linkage quality, computational efficiency, and security [39].
- Method Selection: Understand that different PPRL methods prioritize these aspects differently. For instance, some third-generation methods like embedding-based linkage or secure blocking are designed to improve scalability and accuracy while maintaining privacy, moving beyond simpler, less secure hash-encoding algorithms [40].
- Evaluation Protocol: Implement a standardized evaluation. Compare your PPRL results against a "gold standard" linkage performed with unencrypted identifiers to calculate precision and recall [41]. This quantifies the accuracy cost of privacy measures.
FAQ 2: Why Do Our Linkage Results Have Low Recall, Missing True Matches?
Issue: The PPRL process is failing to link records that should be matched, leading to a low recall rate.
Solution:
- Root Cause Analysis: Check data quality in the source identifiers. Lower linkage quality is often tied to a higher percentage of missing or incorrect personally identifiable information (PII) [41]. The completeness of fields like Social Security Number (SSN) is a major factor [41].
- Refinement Strategy:
- Token Selection: Use multiple composite tokens. If one token (e.g., SSN, sex, date of birth) fails due to a missing field, another token (e.g., sex, address, name, SSN) might succeed [41].
- Algorithm Upgrade: Move from exact matching to approximate matching techniques. Methods like Bloom filters or Hash embeddings can encode data to match "Catharine" with "Katharine" by learning associations between variants, handling real-world data errors effectively [42].
- Verification: Use a subset of data with known matches to validate and tune the matching thresholds.
FAQ 3: How Can We Implement a Scalable and Secure PPRL Process for Large Datasets?
Issue: The PPRL method works on small samples but does not scale to large, database-sized volumes or raises security concerns about a centralized approach.
Solution:
- Adopt Scalable Techniques: Utilize third-generation PPRL techniques designed for large databases. These include [40]:
- Architecture Recommendation: Implement a secure enclave model. In this "eyes-off" architecture [42]:
- Two organizations encrypt their datasets.
- Data is sent to a third-party secure cloud "enclave" where it remains encrypted in memory.
- The enclave performs the linkage without human exposure and returns the encrypted results.
- This creates a "Swiss cheese" model of overlapping security layers (algorithms, encryption, secure cloud technology) to protect sensitive information [42].
FAQ 4: What Are the Regulatory Considerations When Using PPRL for Pharmacovigilance?
Issue: Uncertainty about how to use linked RWD and RCT data for drug safety reporting in a regulatory-compliant manner.
Solution:
- Guidance Adherence: Follow FDA and other international regulatory body guidance that recognizes the need for data linkage techniques and privacy-preserving methods [43]. The FDA's framework emphasizes the relevance, reliability, and traceability of RWD [43].
- Best Practices:
- Establish Clear Protocols: Develop pre-planned analysis protocols for safety signal detection and risk management using linked data [43].
- Ensure Legal Compliance: Use PPRL techniques, like hashing, that meet established de-identification standards such as those under the HIPAA Privacy Rule [41] [43].
- Engage Early: Seek early regulatory engagement to align on the use of linked RWD in your development program [43].
Quantitative Performance Data for PPRL Methods
The tables below summarize empirical data on PPRL performance, providing a basis for comparing methods and setting realistic expectations for your experiments.
Table 1: PPRL Performance Against Gold Standard Linkage
This table compares the performance of different PPRL approaches against a traditional linkage method using unencrypted identifiers, based on a study linking the National Hospital Care Survey (NHCS) to the National Death Index (NDI) [41].
| Linkage Method | Match Rate | Precision | Recall | Key Characteristics |
|---|---|---|---|---|
| Gold Standard (Plain Text) | 5.1% | (Baseline) | (Baseline) | Uses unencrypted PII; deterministic and probabilistic techniques [41]. |
| Initial PPRL Approach | 5.4% | 93.8% | 98.7% | Relies on hashed tokens; performance varies with token selection [41]. |
| Refined PPRL Approach | 5.0% | 98.9% | 97.8% | Optimized token selection; achieves a balance of high precision and recall [41]. |
Table 2: Performance of Specific PPRL Techniques on Standardized Datasets
This table shows the performance of specific PPRL toolkits and algorithms on standardized datasets, demonstrating the high accuracy achievable with modern methods [42].
| PPRL Method / Toolkit | Dataset | Recall | Precision | Key Technique |
|---|---|---|---|---|
| ONS PPRL Toolkit | FEBRL 4 (5,000 records) | 99.3% | 100% | Bloom filter method [42]. |
| Splink (Published Demo) | FEBRL 4 (5,000 records) | 99.2% | 100% | Probabilistic linkage model [42]. |
| Hash Embeddings | (Theoretical Application) | (High) | (High) | Pretrained model learns associations between data variants (e.g., "Catharine" and "Katharine") [42]. |
Experimental Protocols for PPRL Implementation and Validation
Protocol 1: Validating a PPRL Method Against a Gold Standard
This protocol is based on a real-world study conducted by the National Center for Health Statistics to assess PPRL quality before implementation with new data sources [41].
Objective: To assess the precision and recall of a new PPRL technique by comparing its results to a previously established linkage of the same datasets performed with unencrypted identifiers.
Materials:
- Two datasets previously linked using traditional methods (the "gold standard").
- PPRL software (e.g., Datavant, ONS PPRL Toolkit).
- Data processing software (e.g., SAS, R, Python).
Methodology:
- Hashing/Tokenization: Transform the PII (names, addresses, dates of birth) in both datasets into encrypted codes or tokens using the selected PPRL software. Create multiple tokens from different combinations of PII (e.g., sex+DOB+SSN; sex+address+name+SSN) [41].
- Linking: Perform the record linkage within the PPRL environment using the generated tokens.
- Comparison: Compare the results from the PPRL linkage to the gold standard linkage.
- Calculation:
- Precision: Calculate the proportion of records linked by PPRL that are true matches in the gold standard. (Precision = True Positives / (True Positives + False Positives)).
- Recall: Calculate the proportion of true matches in the gold standard that were correctly identified by the PPRL method. (Recall = True Positives / (True Positives + False Negatives)) [41].
- Impact Assessment: Analyze the impact of PPRL on secondary data analysis (e.g., compare match rates and mortality rates across the gold standard and PPRL methods) to ensure scientific conclusions are not affected [41].
Protocol 2: Implementing an "Eyes-Off" Secure Enclave Linkage
This protocol outlines the steps for a secure, scalable linkage process as demonstrated by the ONS PPRL toolkit [42].
Objective: To link two sensitive datasets from different organizations without either organization sharing personal information or accessing the other's raw data.
Materials:
- Two datasets from different organizations (Data Owner A and Data Owner B).
- A PPRL Python package (e.g., ONS toolkit implementing Hash embeddings).
- Access to a secure cloud environment supporting confidential computing (e.g., Google Cloud Confidential Space).
Methodology:
- Environment Setup: Provision a secure enclave virtual machine in the cloud. This environment will keep data encrypted even during processing [42].
- Data Preparation and Encryption:
- Secure Transfer and Attestation:
- The encrypted datasets are sent to the secure enclave.
- The enclave sends an attestation to each key manager, proving it is running in a trusted, secure state. Upon verification, the key managers grant the enclave access to the decryption keys. Data remains protected by the enclave's in-memory encryption [42].
- Matching: The PPRL algorithm performs the linkage within the secure enclave, comparing the encrypted representations.
- Result Return: The enclave encrypts the final set of matched records and sends it back to both organizations [42].
Workflow and Architecture Diagrams
PPRL Secure Enclave Workflow
PPRL Technique Evolution
The Scientist's Toolkit: Essential PPRL Research Reagents
Table 3: Key PPRL Solutions and Their Functions
This table catalogs essential methodological solutions and software tools used in the field of Privacy-Preserving Record Linkage.
| Research Reagent Solution | Type | Primary Function | Application Context |
|---|---|---|---|
| Hashing / Tokenization | Cryptographic Technique | Converts PII (name, DOB) into unique, irreversible encrypted codes to create tokens for matching without revealing original values [41]. | Foundational step for most PPRL methods; meets HIPAA de-identification standards [41]. |
| Bloom Filters | Data Structure | Represents PII as a fixed-length bit array, allowing for efficient approximate matching of strings (e.g., handling typographical errors) [40] [42]. | A widely used method for encoding data in PPRL; balance of privacy and linkage accuracy. |
| Hash Embeddings | Machine Learning Model | An extension of Bloom filters; a pre-trained model that learns associations between data variants (e.g., "Catharine" and "Kitty") to improve matching performance [42]. | Used for advanced linkage on "dirty" data with many variations; requires a training corpus. |
| Secure Multi-Party Computation (SMPC) | Cryptographic Protocol | Enables multiple parties to jointly compute a function over their inputs while keeping those inputs private [40]. | For complex, secure computations where no single party should see the others' data. |
| Secure Enclave / Confidential Computing | Hardware/Cloud Architecture | A secure area in a cloud server where data is processed in encrypted memory, preventing access even by the cloud provider [42]. | Enables "eyes-off" data linkage; used as a trusted third party in the Swiss cheese security model [42]. |
| Modified CRITIC Method | Evaluation Framework | A comprehensive evaluation method using mathematical statistics to assign objective weights to multiple PPRL performance indicators (quality, efficiency, security) [39]. | For objectively comparing and selecting the optimal PPRL method for a specific scenario. |
| Vilaprisan | Vilaprisan (BAY 1002670) | Vilaprisan is a potent selective progesterone receptor modulator (SPRM) for uterine fibroid and endometriosis research. For Research Use Only. Not for human use. | Bench Chemicals |
Frequently Asked Questions (FAQs)
What is a Synthetic Control Arm (SCA)? A Synthetic Control Arm (SCA) is an external control group constructed using statistical methods applied to one or more external data sources, such as results from previous clinical trials or Real-World Data (RWD). It serves as a comparator to the investigational treatment arm in a clinical study when a concurrent control group is impractical or unethical [44] [45].
In what situations are SCAs most beneficial? SCAs are particularly beneficial in scenarios where traditional randomized controlled trials (RCTs) face significant challenges [44] [46] [47]:
- Rare diseases: Where patient populations are small and recruiting for a control arm is difficult.
- Oncology: Especially for rare molecular subtypes where randomization is infeasible.
- Life-threatening conditions: Where ethical concerns exist about assigning patients to a placebo or standard-of-care arm.
- Unmet medical need: When there is no effective standard treatment, and a state of clinical equipoise does not exist.
What are the primary data sources for constructing an SCA? SCAs are primarily built from two types of data [44] [47]:
- Historical Clinical Trial Data: Data from previous clinical trials, which is typically highly standardized and of good quality but may suffer from recruitment biases.
- Real-World Data (RWD): Data derived from electronic health records (EHRs), insurance claims, and patient registries. RWD offers a broader patient representation but often requires extensive processing due to issues with missing data, formatting, and standardization.
What do regulators say about using SCAs? Major regulatory agencies, including the FDA and EMA, recognize the value of SCAs in certain circumstances [44] [47]. They emphasize that their use should be justified on a case-by-case basis. Key regulatory expectations include:
- Early engagement: Sponsors are strongly encouraged to engage with regulators early in the protocol development process.
- Robust methodology: The statistical methods and data sources must be clearly defined and justified.
- Bias mitigation: The study design must proactively address potential sources of bias, such as selection bias and confounding.
What are the biggest advantages of using an SCA?
- Ethical Improvement: Reduces the number of patients exposed to a potential placebo or inferior standard of care [44] [47].
- Improved Feasibility: Accelerates patient recruitment and trial completion, especially in rare diseases [44] [45].
- Cost and Time Efficiency: Can be more cost-effective and time-efficient by avoiding the costs associated with recruiting and managing a concurrent control arm [44].
What are the common limitations and risks?
- Data Quality Dependency: The validity of an SCA is entirely dependent on the quality, completeness, and relevance of the underlying data [44] [48].
- Potential for Bias: SCAs are susceptible to biases, particularly selection bias and unmeasured confounding, since patients are not randomized [44] [46].
- Regulatory Scrutiny: Regulatory agencies may approach SCAs with caution, requiring robust justification and validation of the methodology [44].
Troubleshooting Common SCA Challenges
Challenge 1: Data Quality and Relevance
Problem: The real-world or historical data is fragmented, has missing key variables (like ECOG Performance Status), or does not perfectly reflect the current standard of care or patient population [44] [48].
Solutions:
- Conduct Thorough Data Source Evaluation: Before selection, assess data sources for provenance, completeness, and how well they represent the target population. Document all accessed data sources and justifications for inclusion or exclusion [44] [49].
- Implement Robust Data Pre-processing: Use rigorous data cleaning and harmonization techniques. For missing data, employ methods like multiple imputation and conduct sensitivity analyses (e.g., "tipping point" analyses) to test how the results hold up under different assumptions about the missingness [50].
- Engage Subject Matter Experts: Involve clinicians and disease area experts to validate that the data sources and the resulting SCA are clinically plausible and reflect current medical practice [44] [49].
Challenge 2: Achieving an Adequate Match
Problem: The synthetic control group does not adequately balance the baseline characteristics of the treatment group, leading to biased effect estimates.
Solutions:
- Use Advanced Statistical Matching Techniques: Go beyond simple matching. Commonly used methods include:
- Propensity Score Matching (PSM): Estimates the probability of being in the treatment group given observed covariates and matches treated and control units with similar scores [47].
- Inverse Probability of Treatment Weighting (IPTW): Uses propensity scores to create a weighted population where the distribution of measured covariates is independent of treatment assignment [50].
- Validate the Match Quantitatively: After matching, check the balance of covariates between groups using standardized mean differences (SMD). A common threshold for good balance is SMD < 0.1 [50].
- Leverage Machine Learning: Explore machine learning algorithms that can handle complex, high-dimensional data to find optimal matches and improve upon traditional methods [47].
Challenge 3: Demonstrating Robustness to Regulators and HTA Bodies
Problem: Concerns about potential hidden biases lead to skepticism about the validity of the SCA comparison.
Solutions:
- Perform Pre-specified Quantitative Bias Analyses: Proactively quantify how unmeasured confounding or other biases could affect your results. This involves modeling how strong an unmeasured confounder would need to be to explain away the observed treatment effect [50].
- Implement a Comprehensive Sensitivity Analysis Plan: Test the robustness of your findings by [50] [51]:
- Varying the model specifications and control unit pools.
- Using different statistical methods for the primary analysis.
- Conducting placebo tests in time or across untreated units.
- Consider a Hybrid Trial Design: In some cases, using an SCA to augment a small concurrent randomized control arm (creating a "hybrid" control) can provide greater confidence in the results and be more palatable to regulators [46] [45].
Experimental Protocols & Data
Protocol: Constructing an SCA using Propensity Score Matching
This protocol outlines the key steps for creating a Synthetic Control Arm using Real-World Data and propensity score methodology.
SCA Construction Workflow
Objective: To create a well-balanced control group from RWD that is comparable to the patients in the single-arm investigational trial. Materials: Patient-level data from the single-arm trial and one or more RWD sources (e.g., EHR, claims data). Procedure:
- Data Curation and Harmonization: Pool data from all sources. Harmonize variable definitions (e.g., ensure smoking status is coded consistently), formats, and units. Address missing data appropriately [44] [48].
- Covariate Selection: Identify a set of pre-treatment baseline characteristics (e.g., age, sex, disease stage, comorbidities, prior lines of therapy) that are prognostic of the outcome. This should be based on clinical knowledge and literature [50].
- Propensity Score Estimation: Using a logistic regression model or other suitable method, estimate the propensity score for each patient. The model predicts the probability of being in the investigational treatment arm versus the RWD pool based on the selected covariates [47].
- Matching: Match each patient in the investigational arm to one or more patients from the RWD pool based on their propensity scores. Common techniques include 1:1 nearest-neighbor matching, often with a caliper (a maximum allowable distance between scores) to ensure close matches [47].
- Balance Diagnostics: Assess the success of the matching by comparing the distribution of covariates between the investigational arm and the newly created SCA. Calculate Standardized Mean Differences (SMD) for each variable. An SMD below 0.1 is generally considered to indicate good balance [50].
- Outcome Analysis: Once adequate balance is achieved, proceed to compare the outcome of interest (e.g., overall survival, progression-free survival) between the investigational arm and the SCA using appropriate statistical models, often incorporating the matching weights [50].
Quantitative Data from a Real-World SCA Application
The following table summarizes key results from a published study that used an SCA to evaluate the effectiveness of Pralsetinib in non-small cell lung cancer by comparing it to RWD cohorts [50].
Table 1: Comparative Effectiveness of Pralsetinib vs. Real-World Data SCAs
| Comparison Group | Outcome Measure | Hazard Ratio (HR) | 95% Confidence Interval | Sample Size (N) | Statistical Method |
|---|---|---|---|---|---|
| Pembrolizumab (RWD) | Time to Treatment Discontinuation (TTD) | 0.49 | 0.33 – 0.73 | 795 | IPTW |
| ^ | Overall Survival (OS) | 0.33 | 0.18 – 0.61 | ^ | ^ |
| ^ | Progression Free Survival (PFS) | 0.47 | 0.31 – 0.70 | ^ | ^ |
| Pembrolizumab + Chemotherapy (RWD) | Time to Treatment Discontinuation (TTD) | 0.50 | 0.36 – 0.70 | 1,379 | IPTW |
| ^ | Overall Survival (OS) | 0.36 | 0.21 – 0.64 | ^ | ^ |
| ^ | Progression Free Survival (PFS) | 0.50 | 0.36 – 0.70 | ^ | ^ |
Abbreviations: IPTW: Inverse Probability of Treatment Weighting. HR < 1.0 favors Pralsetinib. Adapted from [50].
The Scientist's Toolkit: Essential Reagents & Methods
Table 2: Key Methodological Solutions for SCA Research
| Item | Category | Function & Application |
|---|---|---|
| Propensity Score Methods | Statistical Method | A family of techniques (matching, weighting, stratification) designed to reduce selection bias in observational studies by making treatment and control groups comparable based on observed covariates [50] [47]. |
| Inverse Probability of Treatment Weighting (IPTW) | Statistical Method | A propensity score-based method that creates a pseudo-population by weighting subjects by the inverse of their probability of receiving the treatment they actually got. This balances covariates across groups for causal inference [50]. |
| Standardized Mean Difference (SMD) | Diagnostic Metric | A statistical measure used to quantify the balance of a covariate between two groups after matching or weighting. It is the preferred metric over p-values for assessing the success of confounding adjustment [50]. |
| Quantitative Bias Analysis | Validation Method | A set of procedures used to quantify the potential impact of unmeasured confounding, selection bias, or measurement error on the study results. It helps assess the robustness of findings [50]. |
| Real-World Data (RWD) Sources | Data Asset | Databases comprising Electronic Health Records (EHR), insurance claims, or patient registries. These are the foundational raw materials from which SCAs are constructed [44] [9]. |
| Privacy-Preserving Record Linkage (PPRL) | Data Management Tool | A method that allows for the linking of patient records across disparate data sources (e.g., linking trial data to longitudinal RWD) without exposing personally identifiable information, enabling more comprehensive data histories [9]. |
SCA Validation Framework
The following diagram outlines the key pillars for validating a Synthetic Control Arm to ensure it produces credible evidence.
SCA Validation Framework
Navigating Practical Challenges: Data Quality, Bias, and Confounding
Addressing Information Bias and Missing Data in Routine Clinical Care Data
Frequently Asked Questions (FAQs)
What are the main types of information bias in real-world data (RWD) and how do they affect study validity? Information bias, also called measurement error, occurs when variables in electronic health records (EHR) or administrative claims data are inaccurately measured or classified [52]. This includes misclassification of exposures, outcomes, or confounders, which can distort effect estimates and compromise the validity of real-world evidence (RWE) used for regulatory and health technology assessment decisions [52] [53]. Common issues include systematic inaccuracies in diagnostic codes, incomplete clinical documentation, and variation in measurement practices across healthcare settings.
Why is missing data particularly problematic in observational studies using routine clinical care data? Missing data is prevalent in EHRs, with key demographic, clinical, and lifestyle variables often incomplete [54]. This incompleteness can introduce selection bias, reduce statistical power, and compromise research validity when the missingness is related to outcomes, exposures, or confounders [54]. For example, in UK primary care data, variables like ethnicity, social deprivation, body mass index, and smoking status frequently contain missing values, potentially leading to biased inferences if not handled appropriately [54].
What are the most common flawed methods for handling missing data and why should they be avoided? Complete case analysis (excluding subjects with missing data) and single imputation methods like last observation carried forward (LOCF) or mean imputation remain common but problematic approaches [55] [56]. These methods require missing completely at random (MCAR) assumptions that rarely hold in practice, can lead to biased estimates, and typically produce artificially narrow confidence intervals by not accounting for uncertainty in imputed values [55] [56].
How can researchers determine whether their missing data handling methods are appropriate? Understanding missing data mechanisms is essential. Rubin's classification categorizes missingness as: Missing Completely at Random (MCAR), Missing at Random (MAR), or Missing Not at Random (MNAR) [54] [55]. While MCAR is testable, MAR and MNAR are not empirically verifiable from the data alone [54]. Researchers should explore missingness patterns, conduct sensitivity analyses under different assumptions, and select methods based on plausible mechanisms rather than defaulting to convenience approaches [54].
What emerging techniques show promise for addressing both information bias and missing data? Privacy-preserving record linkage (PPRL) can integrate patient records across disparate data sources, creating more complete patient journeys [9]. Quantitative bias analysis techniques specifically address measurement error in RWD [52]. Additionally, AI approaches including synthetic data generation for underrepresented populations and explainable AI for transparent decision-making are being explored to mitigate biases [57] [58].
Troubleshooting Guides
Problem: High Rates of Missing Data in Key Variables
Diagnosis Steps:
- Quantify Missingness: Calculate the proportion of missing values for each variable overall and within key subgroups [54].
- Pattern Analysis: Determine whether missingness is monotonic, intermittent, or follows specific patterns across time or patient characteristics [54].
- Mechanism Assessment: Evaluate whether missingness appears related to observed variables (potentially MAR) or likely depends on unobserved factors (potentially MNAR) through exploratory analyses [55].
Solution Recommendations:
- Multiple Imputation: Create multiple plausible datasets using chained equations that incorporate auxiliary variables associated with missingness [54] [56].
- Full Information Maximum Likelihood: Use FIML estimation when feasible, as it uses all available information without imputing values [55].
- Sensitivity Analyses: Conduct analyses under different missing data assumptions to assess robustness of findings [54].
Table: Comparison of Missing Data Handling Methods
| Method | Key Assumptions | Advantages | Limitations |
|---|---|---|---|
| Complete Case Analysis | Missing Completely at Random (MCAR) | Simple implementation; No imputation required | Inefficient; Potentially severe bias |
| Multiple Imputation | Missing at Random (MAR) | Accounts for uncertainty; Uses all available data | Complex implementation; Untestable assumption |
| Maximum Likelihood | Missing at Random (MAR) | Uses all available data; No imputation required | Computational intensity; Limited software options |
| Missing Indicator Method | None valid | Retains sample size | Produces biased estimates; Not recommended |
Problem: Suspected Information Bias in Outcome or Exposure Definitions
Diagnosis Steps:
- Validation Assessment: Identify whether gold-standard data or validation substudies are available to assess accuracy of key variable definitions [52].
- Algorithm Review: Document and critically evaluate the code-based definitions (e.g., claims-based algorithms) for exposures, outcomes, and covariates [52].
- Bias Direction Estimation: Determine whether misclassification is likely differential or non-differential between comparison groups [52].
Solution Recommendations:
- Quantitative Bias Analysis: Implement probabilistic or multidimensional bias analysis to quantify potential bias magnitude and direction [52].
- Data Linkage: Link to supplemental data sources (e.g., registry data, detailed chart review) to improve variable accuracy [52] [9].
- Sensitivity Analyses: Variable definitions across a plausible range to assess impact on effect estimates [52].
Diagnosis Steps:
- Data Gap Analysis: Identify specific care settings or time periods where data capture is incomplete [9].
- Linkage Feasibility: Assess whether Privacy-Preserving Record Linkage (PPRL) methods can be implemented while maintaining patient privacy [9].
- Completeness Evaluation: Determine whether linked data provides sufficient clinical detail for research questions [9].
Solution Recommendations:
- PPRL Implementation: Use tokenization or identity resolution techniques to link patient records across disparate sources without exposing personally identifiable information [9].
- Complementary Data Sources: Strategically combine EHR data with claims, registry, or patient-reported data to fill information gaps [9].
- Informed Analytics: Account for informative presence where the act of measuring itself carries clinical meaning [59].
Experimental Protocols for Method Validation
Protocol 1: Multiple Imputation Implementation
Purpose: To appropriately handle missing data under Missing at Random assumptions [56].
Procedure:
- Prepare Data: Organize dataset including variables with missing values and auxiliary variables predictive of missingness [56].
- Specify Imputation Model: Choose appropriate conditional distributions for each variable (e.g., linear regression for continuous, logistic for binary) [56].
- Generate Imputed Datasets: Create multiple (typically 20-100) completed datasets using chained equations [56].
- Analyze Multiply Imputed Data: Perform primary analysis separately on each imputed dataset [56].
- Pool Results: Combine parameter estimates and standard errors using Rubin's rules [56].
Table: Software Implementation of Multiple Imputation
| Software | Package/Procedure | Key Features | Syntax Example |
|---|---|---|---|
| R | mice package |
Flexible imputation models; Diagnostic tools | mice(data, m = 20, method = "pmm") |
| SAS | PROC MI & PROC MIANALYZE |
Integrated procedures; Enterprise support | proc mi data=incomplete out=complete; var x1 x2 x3; run; |
| Stata | mi commands |
Unified workflow; Extensive documentation | mi set mlong mi register imputed x1 x2 mi impute chained (regress) x1 (logit) x2 = y, add(20) |
Protocol 2: Quantitative Bias Analysis for Misclassification
Purpose: To quantify and adjust for suspected information bias in exposure or outcome measurement [52].
Procedure:
- Define Misclassification Parameters: Specify sensitivity, specificity, or positive/negative predictive values based on validation studies or literature [52].
- Specify Uncertainty: Define distributions around misclassification parameters rather than using fixed values [52].
- Implement Bias Model: Incorporate misclassification parameters into analysis model using probabilistic methods [52].
- Propagate Uncertainty: Use simulation or Bayesian methods to propagate uncertainty through the analysis [52].
- Summarize Adjusted Estimates: Present bias-adjusted effect estimates with appropriate uncertainty intervals [52].
The Scientist's Toolkit
Table: Essential Methods and Reagents for Addressing Data Imperfections
| Tool/Method | Primary Function | Application Context | Key Considerations |
|---|---|---|---|
| Multiple Imputation by Chained Equations (MICE) | Handles missing data under MAR assumption | Incomplete covariates, outcomes, or exposure measures | Requires appropriate auxiliary variables; Assumes correct model specification |
| Quantitative Bias Analysis | Quantifies impact of measurement error | Suspected misclassification of exposures, outcomes, or confounders | Requires validation data or plausible bias parameters |
| Privacy-Preserving Record Linkage (PPRL) | Links patient records across data sources without exposing identifiers | Fragmented health data across systems, combining RCT and RWD | Balance between linkage accuracy and privacy protection |
| Sensitivity Analysis Framework | Tests robustness to untestable assumptions | MNAR missing data mechanisms, unmeasured confounding | Should pre-specify plausible parameter ranges based on subject matter knowledge |
| Explainable AI Methods | Provides transparency in algorithmic bias detection | Complex predictive models using EHR data | Critical for regulatory acceptance and clinical trust |
Workflow Diagrams
Missing Data Handling Strategy
Information Bias Mitigation Framework
Key Quantitative Evidence
Table: Current Practices in Handling Missing Data (Based on Survey of 220 CPRD Studies)
| Method Used | Frequency | Percentage | Appropriateness Assessment |
|---|---|---|---|
| Complete Records Analysis | 50 studies | 23% | Problematic - requires MCAR assumption |
| Missing Indicator Method | 44 studies | 20% | Problematic - produces biased estimates |
| Multiple Imputation | 18 studies | 8% | Preferred - valid under MAR |
| Other Methods | 15 studies | 6% | Variable appropriateness |
| No Reporting | 57 studies | 26% | Concerning - lacks transparency |
Table: Performance Comparison of Imputation Strategies in AI-Based Early Warning Score
| Data Scenario | AUROC Performance | Key Implications |
|---|---|---|
| Vital Signs + Age Only | 0.896 | Limited but robust inputs can perform well |
| Full Clinical Variables | 0.918 | Comprehensive data improves performance |
| Mean-Based Imputation | 0.885 | Standard imputation may reduce accuracy |
| Multiple Imputation (MICE) | 0.827 | Advanced methods can underperform if missingness is informative |
| Normal-Value Imputation | >0.896 | Default method preserving "informative presence" |
Mitigating Selection Bias and Confounding by Indication
FAQs: Core Concepts and Troubleshooting
Q1: What is the fundamental difference between selection bias and confounding by indication?
- Selection bias is a distortion that occurs from procedures used to select subjects and factors influencing study participation. It compromises the external validity of a study, meaning the results from the study sample may not be generalizable to the broader target population [60] [61]. For example, if only patients with more severe disease agree to participate, your sample is not representative.
- Confounding by indication occurs when the reason for prescribing a treatment (the "indication") is itself a risk factor for the outcome. This compromises internal validity, as the observed association between the treatment and outcome may be caused by the underlying disease severity rather than the treatment itself [62] [61]. For instance, if a drug is prescribed to high-risk patients, it may appear harmful even if it is not.
Q2: In a linked database study, my analysis of a linked subset shows a different effect estimate than the full cohort. What is the most likely issue?
You are likely encountering selection bias due to the linkage process [63]. Patients who appear in both data sources (e.g., a claims database and a laboratory database) often differ systematically from those who do not. They may have more comorbidities, higher healthcare utilization, or different socioeconomic status. To address this, you can use Inverse Probability of Selection Weights (IPSW) to statistically recreate a population that is representative of your original full cohort [63].
Q3: I am studying a drug suspected to cause cancer, but the drug is also used to treat early symptoms of that same cancer. How can I mitigate this protopathic bias?
Protopathic bias, a form of reverse causation, can be mitigated by introducing an exposure lag period [60]. This involves disregarding all drug exposure during a specified time window (e.g., 6-12 months) before the cancer diagnosis date. This helps ensure the drug exposure is not being prescribed for undiagnosed cancer symptoms, allowing for a more valid assessment of whether the exposure truly causes the outcome [60].
Q4: My real-world evidence study shows a larger treatment effect than the randomized clinical trial. Could confounding by indication be the cause?
Yes, this is a common scenario. Confounding by indication can cause either an over- or under-estimate of a treatment's true effect [62]. In the context of vaccines, for example, "healthy vaccinee bias" can occur if healthier individuals are more likely to be vaccinated, making the vaccine appear more effective than it is [62]. Conversely, if a drug is preferentially prescribed to sicker patients ("channeling"), its effectiveness may be underestimated. Using an active comparator new-user design and advanced methods like propensity score weighting can help minimize this bias [60].
Experimental Protocols for Bias Mitigation
Protocol 1: Implementing a New-User Active Comparator Cohort Design
This design is a cornerstone for mitigating selection bias and confounding in pharmacoepidemiology [60].
- Objective: To emulate a target trial using real-world data by comparing new users of a study drug to new users of an active alternative.
- Methodology:
- Cohort Entry: Define the study index date as the date of the first qualifying prescription for either the drug of interest or the active comparator.
- Eligibility Criteria: Apply inclusion/exclusion criteria (e.g., age, diagnosis, continuous health plan enrollment) during a baseline period prior to the index date.
- New-User Requirement: Ensure no use of either drug during a predefined washout period (e.g., 6-12 months) before the index date.
- Follow-up: Follow patients from the index date until the occurrence of the outcome, treatment discontinuation/switching, end of data availability, or a predefined administrative censoring date.
- Analysis: Control for measured confounding using propensity score methods or multivariable regression. Account for selection bias in linked data analyses using IPSW [63].
Protocol 2: Accounting for Selection Bias in Linked Database Analyses
This protocol provides a step-by-step approach to adjust for selection bias when supplementing a primary database with a supplemental dataset available only for a subset of patients [63].
- Objective: To obtain an unbiased treatment effect estimate in the primary database using confounder data from a linked subset.
- Methodology:
- Define Cohorts: Identify your full study population in the primary data source and the linked sub-cohort with additional confounder data.
- Characterize Selection: Compare the distribution of all available baseline covariates (e.g., demographics, comorbidities, healthcare utilization) between the full cohort and the linked sub-cohort to identify variables predictive of being selected into the linkage.
- Estimate Selection Weights: Using the variables identified in step 2, fit a model (e.g., logistic regression) to estimate the probability of a patient being in the linked sub-cohort. The Inverse Probability of Selection Weight (IPSW) is the inverse of this probability.
- Analyze: In the linked sub-cohort, perform your primary analysis (e.g., using Inverse Probability of Treatment Weights, IPTW) and apply the IPSW. The combined weight is IPTW * IPSW. This creates a pseudo-population that is representative of the full cohort and balanced on confounders.
- Sensitivity Analysis: Compare the results from the weighted analysis in the linked cohort to the results from the full cohort (which may have residual confounding) to assess robustness.
Data Presentation
Table 1: Common Biases in Real-World Evidence Studies: Comparison and Mitigation Strategies
| Bias Type | Key Question | Impact on Validity | Primary Design-Based Mitigation | Primary Analysis-Based Mitigation |
|---|---|---|---|---|
| Selection Bias [60] [61] | Why are some patients included in the analysis and others not? | Compromises External Validity (generalizability) [61] | New-user design; Ensure linkage is representative [60] [63] | Inverse Probability of Selection Weights (IPSW) [63] |
| Confounding by Indication [62] | Why did a patient receive one particular drug over another? | Compromises Internal Validity (causality) [61] | Active comparator design; Restriction to specific indications [60] [62] | Propensity score methods; Multivariable regression [64] |
| Protopathic Bias [60] | Is the exposure a cause or an effect of the early disease? | Compromises Internal Validity (reverse causation) [60] | Restriction to cases without early symptoms | Introduction of an exposure lag period [60] |
| Surveillance/Detection Bias [60] | Are outcomes detected equally across exposure groups? | Compromises Internal Validity (misclassification) [60] | Select an unexposed group with similar testing likelihood | Adjust for the surveillance or testing rate in analysis [60] |
Table 2: The Scientist's Toolkit: Key Reagents for Robust RWE Studies
| Research "Reagent" | Function in the Experiment | Application Context |
|---|---|---|
| Active Comparator New-User Design [60] | Mimics randomization by balancing both known and unknown confounders between two plausible treatment options at initiation. | The foundational design for comparative effectiveness and safety studies using longitudinal healthcare databases. |
| Inverse Probability of Treatment Weights (IPTW) [63] | Creates a pseudo-population where treatment assignment is independent of measured baseline covariates, allowing for an unconfounded comparison. | Used in the analysis phase to control for confounding when comparing treatment groups. |
| Inverse Probability of Selection Weights (IPSW) [63] | Corrects for non-representativeness in a study sample by weighting the sample back to the characteristics of the original target population. | Essential for linked database studies where the linked subset is not a random sample of the full cohort. |
| Propensity Score [9] [62] | A single score summarizing the probability of receiving treatment given baseline covariates. Used for matching, weighting, or stratification. | A versatile tool to control for dozens of confounders simultaneously, improving the comparability of treatment groups. |
| Privacy-Preserving Record Linkage (PPRL) [9] | A method to link an individual's health records across multiple datasets (e.g., RCT and RWD) without revealing personally identifiable information. | Enriches patient data for confounder adjustment and allows for long-term follow-up of trial participants in real-world settings. |
| E-Value [64] | Quantifies the minimum strength of association an unmeasured confounder would need to have with both the exposure and outcome to explain away the observed effect. | A sensitivity analysis to assess the robustness of a study's findings to potential unmeasured confounding. |
Signaling Pathways and Workflows
Bias Mitigation in Linked Data
Distinguishing Bias Mechanisms
Troubleshooting Guide: Common RWD Challenges and Solutions
This guide addresses specific, technical challenges researchers face when working with Real-World Data (RWD) to ensure it is fit for validating evidence against Randomized Controlled Trial (RCT) findings.
FAQ 1: An auditor has questioned the origin of a specific data point in our analysis. How can we trace it back to its source?
- Problem: Lack of data provenance makes it impossible to verify the origin and transformation history of a data point, jeopardizing the reliability of your Real-World Evidence (RWE) [65].
- Solution: Implement a data provenance framework by assigning a unique
ProvenanceIDto each row of data as it is acquired [65]. - Methodology:
- Establish a Transfer Protocol: When receiving data from providers, pre-define identifying factors for each record to allow tracking back to the source. Secure agreements that allow provenance to be traced back through vendors to the raw data [65].
- Stamp with ProvenanceID: For every file received, assign a globally unique
ProvenanceIDto each row of data as curation begins [65]. - Maintain the Chain: As data moves through curation, transformation, and analysis steps, preserve the
ProvenanceID. If data from multiple sources are joined, create a cross-reference table to chain the identifiers together [65]. - Enable Cross-Referencing: Develop a centralized cross-reference of all data sources and their corresponding
ProvenanceIDs. This allows any data scientist to trace any data point back to its original source confidently [65].
FAQ 2: Our manual data abstraction from Electronic Health Records (EHRs) is slow and has a high error rate. How can we improve efficiency and accuracy?
- Problem: Manual chart abstraction is a dominant method but is associated with significant variability and a pooled error rate of 6.57% [66]. It can take an average of 30 minutes per chart, creating a major bottleneck [66].
- Solution: Deploy an automated evidence generation platform that uses a hybrid data access strategy and Artificial Intelligence (AI) for data extraction [66].
- Methodology:
- Choose a Data Access Pathway: Implement a hybrid strategy based on your need for depth versus speed.
- HIPAA Release Pathway: For studies requiring deep phenotypic data and strong audit readiness, use patient consent to obtain complete medical records (structured and unstructured) directly from facilities. This provides superior traceability but is slower [66].
- FHIR API Pathway: For longitudinal registries and less complex studies, use FHIR-based APIs for near real-time access to structured data defined by the U.S. Core Data for Interoperability (USCDI). This is faster but offers more limited depth [66].
- Apply AI for Extraction: Use Natural Language Processing (NLP) and Large Language Models (LLMs) to structure retrieved data. It is crucial to understand AI performance varies by task [66].
- Choose a Data Access Pathway: Implement a hybrid strategy based on your need for depth versus speed.
- Experimental Protocol & Data: The table below summarizes the performance metrics you can expect from AI-driven extraction, which drastically reduces abstraction time.
Table 1: Performance Benchmarks for Automated Data Extraction from EHRs
| Data Extraction Task Type | Typical Performance (F1-Score) | Considerations & Required Oversight |
|---|---|---|
| Structured Entity Extraction(e.g., age, medication names) | 0.85 - 0.95 [66] | High performance; suitable for automation with minimal oversight. |
| Complex Concept Extraction(e.g., Adverse Drug Events, symptom mapping) | 0.60 - 0.80 [66] | Moderate performance; requires significant human oversight and validation. |
| Manual Abstraction (Baseline) | ~93.43% Accuracy (6.57% error rate) [66] | Time-intensive: ~30 minutes/chart [66]. |
| Automated Extraction | N/A | Time-efficient: ~6 minutes/chart [66]. |
FAQ 3: How do we assess and ensure the quality of RWD for a specific regulatory-grade use case?
- Problem: RWD is inherently heterogeneous, and its quality must be evaluated for a specific purpose, as there is no one-size-fits-all "gold standard" framework [67].
- Solution: Tailor your Quality Assurance (QA) processes to the intended use case, following emerging regulatory guidance [67].
- Methodology:
- Define Fitness-for-Purpose: Before analysis, explicitly state how the data will be used to support a regulatory decision. The FDA emphasizes that RWE must be "fit-for-purpose" [12].
- Conduct a Feasibility Assessment: Evaluate all potential data sources and justify your final selection based on their ability to answer the research question. Share this assessment with regulators during early engagement [25].
- Check Data Reliability: Ensure data accuracy, completeness, provenance, and traceability. Be prepared for a potential audit by maintaining a log of researchers involved and ensuring the FDA can access and verify study records [25].
- Adhere to Data Standards: Transform data according to standards like those from the Clinical Data Interchange Standards Consortium (CDISC) to ensure compliance and reliability for regulatory review [25].
Essential Research Reagent Solutions for RWD Validation
The following table details key methodological "reagents" and tools essential for constructing robust RWE studies designed to validate findings from RCTs.
Table 2: Key Reagents for RWE Generation and Validation
| Research Reagent / Method | Function & Explanation |
|---|---|
| Privacy-Preserving Record Linkage (PPRL) | A method to link an individual's health records across disparate datasets (e.g., RCT data and EHRs) without revealing personally identifiable information. This creates a more comprehensive view of the patient journey [9]. |
| Target Trial Emulation | A study design framework where an observational study is designed to mimic a randomized trial that could have been conducted but wasn't. This is a gold standard for addressing confounding in RWD [12]. |
| Propensity Score Methods | Statistical techniques used to create fair comparisons between treatment groups in non-randomized data. They calculate the probability of receiving a treatment based on patient characteristics, allowing researchers to match or weight patients to balance groups [12]. |
| Synthetic Control Arms | An approach that uses historical RWD to create virtual control groups for single-arm trials. This is especially valuable in oncology and rare diseases where traditional RCTs are challenging [12] [25]. |
| OMOP Common Data Model | A standardized database model that allows for the systematic analysis of disparate observational databases by transforming data into a common format and representation [67]. |
| HL7 FHIR Standard | An interoperability standard for the exchange of healthcare data via APIs. It enables programmatic access to EHR data, facilitating automated data retrieval for research [66] [67]. |
Experimental Workflow: From RWD Source to Validated Evidence
The diagram below outlines the core technical workflow for ensuring provenance, quality, and completeness when generating RWE.
Diagram 1: Technical workflow for generating regulatory-grade RWE, illustrating the integration of provenance, quality assurance, and analytical methods.
Workflow for Tracing Data Provenance
The following diagram details the specific process for implementing and tracking data provenance from source to visualization.
Diagram 2: Detailed data provenance traceability workflow, showing the path from an audit query back to the original source data.
FAQs: Addressing Core Methodological Challenges
FAQ 1: When can Real-World Evidence (RWE) credibly complement Randomized Controlled Trial (RCT) findings? RWE is particularly valuable in complex clinical situations where RCTs have inherent limitations. Key scenarios include: addressing the limited external validity of RCTs by applying results to broader, real-world populations; resolving treatment comparison issues when a traditional control arm is unethical or unfeasible (e.g., in rare diseases using single-arm trials with an external control arm); and validating non-standard endpoints (e.g., surrogate endpoints or patient-reported outcomes) used in the original RCT [23] [24]. Regulatory bodies like the FDA recognize RWE's role in supporting new drug indications and satisfying post-approval study requirements [11] [17].
FAQ 2: What are the most critical methodological pitfalls when designing an RWD study to validate an RCT? The primary pitfalls are confounding bias and selection bias, as RWD is observational. Without randomization, treated and untreated groups may differ in important ways [68] [11]. Other major concerns include incomplete or poor-quality data (e.g., missing values, coding errors in EHRs) and inadequate follow-up that differs from the rigorous schedule of an RCT [68]. To mitigate these, employ robust methodologies like target trial emulation, which applies RCT design principles to observational data, and use advanced statistical techniques such as propensity score matching to balance patient characteristics between groups [68] [11].
FAQ 3: How do I validate a surrogate endpoint (e.g., Progression-Free Survival) against a gold-standard endpoint (e.g., Overall Survival) using RWD? To confirm the validity of a surrogate endpoint in a real-world context, you must establish a strong, consistent correlation between the surrogate and the final clinical outcome in the RWD population [23] [24]. This involves conducting a post-launch RWD study to evaluate the therapy's effectiveness on the gold-standard endpoint. The analysis should assess whether the treatment effect observed on the surrogate endpoint in the RCT reliably predicts the treatment effect on the final outcome in the real-world population [23] [24]. This process is crucial for building confidence in surrogate endpoints used for drug approval.
FAQ 4: My RCT's population is not representative of my local patient population. How can RWD help? RWD can be used to assess and improve the transportability of RCT results. You can conduct an environmental observational study to describe the characteristics and clinical outcomes of your local intended population [23]. Subsequently, statistical methods like weighting or outcome regression can be applied to quantitatively transport the RCT's estimated treatment effect to the local population, accounting for differences in characteristics between the trial sample and the real-world target population [23] [24]. This helps bridge the gap between efficacy and effectiveness.
Troubleshooting Guides: From Problem to Solution
Problem: High Potential for Confounding Bias in Non-Randomized Comparison
Solution: Apply a Causal Inference Framework This methodology strengthens causal claims from observational data by explicitly accounting for confounding factors [23] [68].
- Step 1: Define Causal Question. Pre-specify the target trial you are emulating, including inclusion/exclusion criteria, treatment strategies, outcome, and causal contrast [68].
- Step 2: Create a Directed Acyclic Graph (DAG). Visually map out all assumed relationships between treatment, outcome, confounders, and other variables to identify the minimal sufficient set of variables that must be adjusted for to eliminate bias [23].
- Step 3: Propensity Score (PS) Analysis.
- Step 4: Outcome Analysis. Compare the outcomes between the treatment groups in the balanced sample.
- Step 5: Sensitivity Analysis. Quantify how strongly an unmeasured confounder would need to affect the treatment and outcome to explain away the observed result [23].
Problem: Need an External Control Arm for a Single-Arm Trial
Solution: Construct a Robust Historical Control from RWD This approach provides a counterfactual for evaluating a treatment's effect when a concurrent control group is not available [24] [11].
- Step 1: Source Selection. Identify high-quality RWD sources that deeply capture the disease population, such as disease registries or detailed Electronic Health Record (EHR) databases [68] [11].
- Step 2: Cohort Definition. Apply the single-arm trial's eligibility criteria identically to the RWD source to create the external control cohort. This ensures the patients are comparable with respect to key disease characteristics.
- Step 3: Index Date Alignment. Define an index date (e.g., start of treatment) in the RWD cohort that mirrors the start of intervention in the clinical trial.
- Step 4: Adjust for Residual Differences. Use propensity score methods to balance the single-arm trial cohort and the external control cohort on baseline prognostic factors, as their distributions may still differ [24].
- Step 5: Outcome Comparison. Compare the outcome of interest (e.g., survival, response rate) between the trial cohort and the adjusted external control arm.
Solution: Develop and Validate a Proxy Endpoint When the gold-standard endpoint is unavailable, a logically derived proxy can be constructed [23] [68].
- Step 1: Algorithm Development. Define a computable phenotype or algorithm that combines available RWD elements (e.g., diagnosis codes, medication dispensings, procedures) to approximate the clinical endpoint.
- Example: To define "progression" in oncology EHR data, an algorithm might combine new therapy initiation, emergency room visits, and hospice referrals [68].
- Step 2: Validation Gold Standard. Establish a validation subset where the true endpoint status is known. This can be done through manual chart review by clinicians or by linking to a data source that contains the verified endpoint.
- Step 3: Performance Assessment. Test the algorithm against the gold standard to calculate its positive predictive value (PPV), sensitivity, and specificity.
- Step 4: Algorithm Refinement. Iteratively refine the algorithm based on its performance to maximize its accuracy and reliability.
- Step 5: Application. Apply the final, validated algorithm to the full RWD study population.
The Scientist's Toolkit: Essential Reagents for RWE Generation
Table 1: Key Resources for Operationalizing RWD Metrics
| Tool / Resource | Function & Application | Key Considerations |
|---|---|---|
| EHR & Medical Claims Data [68] [11] | Provides detailed clinical data (EHR) and longitudinal data on care utilization & costs (Claims). Used for population description, external controls, and safety studies. | Data is unstructured and messy; requires extensive curation. Potential for missing data and coding inaccuracies. |
| Disease & Product Registries [68] [11] | Offers deep, longitudinal data on specific patient populations. Ideal for studying natural history of disease and long-term treatment outcomes. | May lack generalizability; often reflects care at specialized centers. Can be costly to establish and maintain. |
| Target Trial Emulation Framework [68] | A structured methodology for designing RWD analyses to mirror a hypothetical RCT, strengthening causal inference. | Requires pre-specification of all design elements (eligibility, treatment strategies, outcomes) before analyzing data. |
| Propensity Score Methods [23] [11] | A statistical technique to balance measured confounders between treatment and control groups in observational studies, simulating randomization. | Can only adjust for measured confounders. Sensitivity analysis is critical to assess impact of unmeasured confounding. |
| Common Data Models (e.g., OMOP CDM) [11] | Standardizes the structure and content of RWD from different sources (EHR, claims), enabling large-scale, reproducible analytics. | Requires significant upfront investment to map local data to the common model. |
| Patient-Reported Outcome (PRO) Tools [23] [68] | Captures the patient's perspective on their own health status directly, via surveys or digital apps. | Subject to recall bias. Validation of new PRO instruments is a long and methodologically complex process [23]. |
Experimental Protocol: Validating a Surrogate Endpoint with RWD
Objective: To confirm that a surrogate endpoint (e.g., Progression-Free Survival) used in a pivotal RCT is a valid predictor of the final clinical outcome (e.g., Overall Survival) in a real-world population treated with the drug.
Background: Surrogate endpoints are often used to accelerate drug approval, but their relationship with the final outcome must be verified in the less-controlled real-world setting where patient populations, comorbidities, and treatment patterns may differ [23] [24].
Methodology:
- Study Design: A retrospective cohort study using RWD.
- Data Source: Link a comprehensive disease registry with vital statistics data to ensure accurate capture of the final outcome (Overall Survival) [68] [11].
- Cohort:
- Inclusion: Patients diagnosed with the relevant condition who initiated the drug of interest in a real-world setting post-approval.
- Exclusion: Patients participating in any interventional clinical trial for this condition to ensure a pure real-world population.
- Variables:
- Exposure: Treatment with the drug of interest.
- Surrogate Endpoint: Progression-Free Survival (PFS), defined per a validated RWD algorithm (see Troubleshooting Guide 3).
- Final Outcome: Overall Survival (OS), from treatment initiation to death from any cause.
- Covariates: Demographics, disease stage, comorbidities, prior therapies, and performance status.
- Statistical Analysis:
- Calculate real-world PFS and OS.
- Evaluate the correlation between PFS and OS at the individual level.
- Perform a survival analysis (e.g., Cox proportional hazards model) to quantify the strength of the association between achieving a response on the surrogate (e.g., progression-free at a landmark time) and the hazard of death, adjusting for key covariates.
Workflow Diagrams
Diagram 1: RWD Endpoint Operationalization Workflow
Diagram 2: Target Trial Emulation for Causal Inference
Assessing Validation Success: Case Studies and Comparative Frameworks
Frequently Asked Questions
Q1: Why do my RWE study results differ from the findings of a published RCT, even when studying the same treatment?
Differences between Real-World Evidence (RWE) and randomized controlled trial (RCT) findings often stem from emulation differences rather than pure bias. Key factors include [69] [70]:
- Population Differences: RWE may include broader, more diverse patients compared to tightly controlled RCT eligibility criteria.
- Treatment Implementation: In clinical practice, medication adherence, dosing, and treatment augmentation often differ from strict RCT protocols.
- Outcome Measurement: RCTs typically use centrally adjudicated outcomes, while RWE often relies on routinely collected data like insurance claims or electronic health records, which may have different sensitivity and specificity.
Q2: What analytical methods can I use to integrate RWE with RCT data for rare event outcomes?
For rare events meta-analyses, several statistical approaches allow for the integration of RWE while accounting for its potential biases [71]:
- Design-Adjusted Synthesis (DAS): Adjusts RWE findings to reflect pre-specified confidence levels in the data.
- RWE as Prior Information (RPI): Uses RWE to inform the prior distribution in a Bayesian analysis of RCT data.
- Three-Level Hierarchical Models (THM): Simultaneously models between-study heterogeneity within each study design (RCT or RWE) and across study designs.
- Naïve Data Synthesis (NDS): Directly combines all data without adjustment (generally not recommended due to high bias risk).
Q3: How can I assess whether my RWE study is a "close emulation" of a target RCT?
The "close emulation" concept, developed through initiatives like RCT DUPLICATE, evaluates how well an RWE study replicates key RCT design elements. Assess these critical factors [70]:
- Comparator Emulation: How well the real-world comparator matches the RCT control group.
- Outcome Emulation: Similarity in outcome definitions and ascertainment methods.
- Key Design Elements: Avoid these major emulation differences: hospital treatment initiation, run-in windows selectively including responders, mixing randomization effects with baseline therapy discontinuation, and delayed drug effects with short persistence.
Q4: What are the most common reasons regulatory bodies reject RWE in submissions?
Regulatory assessments frequently identify these methodological shortcomings [72] [73]:
- Unaddressed Confounding: Inadequate control for known and measured confounders.
- Selection Bias: Systematic differences between treatment groups not addressed through design or analysis.
- Missing Data: Substantial missing data without appropriate handling methods.
- Outcome Misclassification: Use of outcome definitions with poor validity in real-world data sources.
Troubleshooting Guides
Issue: Large Treatment Effect Differences Between RWE and RCT
Potential Causes and Solutions:
| Problem Area | Diagnostic Checks | Corrective Actions |
|---|---|---|
| Population Differences | Compare baseline characteristics, exclusion criteria application, and disease severity markers between studies [69]. | Use propensity score matching, restriction, or statistical adjustment to improve comparability. |
| Unmeasured Confounding | Conduct sensitivity analyses for unmeasured confounding, use negative control outcomes, or apply instrumental variable analysis if possible [74]. | Consider supplementing with primary data collection on key confounders in a subset. |
| Treatment Adherence | Compare medication persistence, discontinuation rates, and concomitant medications between RWE and RCT [70]. | Implement as-treated or per-protocol analyses in addition to intention-to-treat. |
Issue: Regulatory Concerns About RWE Validity
Addressing Methodological Critiques:
| Regulatory Concern | Evidence Generation Strategy | Documentation Requirements |
|---|---|---|
| Data Quality | Implement rigorous validation studies for key exposure, outcome, and covariate definitions [19]. | Provide positive and negative predictive values for key study parameter algorithms. |
| Confounding Control | Apply multiple analytic approaches (e.g., propensity score matching, disease risk scores) and demonstrate consistent findings [74]. | Present covariate balance metrics and sensitivity analysis results. |
| Generalizability | Clearly describe the RWE study population and data source catchment, comparing to target population [11]. | Include tables comparing index dates, enrollment patterns, and capture of key clinical variables. |
Experimental Protocols
Protocol 1: Quantitative Comparison of RWE and RCT Treatment Effects
Objective: Systematically compare treatment effects between RWE and RCT studies and identify sources of heterogeneity.
Materials:
- RWD sources (e.g., claims, EHRs, registries)
- RCT publication or individual participant data
- Statistical software (R, Python, or SAS)
Procedure:
- Design Stage: Emulate the target RCT design in RWE using the "target trial" framework [69]
- Effect Estimation: Calculate hazard ratios, risk ratios, or mean differences for both RWE and RCT
- Heterogeneity Assessment: Compute standardized differences between effect estimates
- Meta-Regression: Model effect size differences using emulation difference characteristics [70]
Analysis:
RWE-RCT Comparison Workflow
Protocol 2: Integration of RWE and RCT Data for Rare Events Meta-Analysis
Objective: Combine RWE with RCT data to enhance statistical power for rare event outcomes while accounting for RWE biases.
Materials:
- RCT and RWE study results (2x2 tables or effect estimates with standard errors)
- Statistical software with Bayesian capabilities (Stan, JAGS, or rjags)
Procedure:
- Data Preparation: Extract effect estimates and precision measures from all studies [71]
- Bias Assessment: Evaluate RWE study quality using appropriate tools (e.g., ROBINS-I, Newcastle-Ottawa Scale)
- Model Fitting: Apply selected integration method (DAS, RPI, or THM)
- Sensitivity Analysis: Examine how different confidence levels in RWE affect pooled estimates
Analysis: For Design-Adjusted Synthesis, adjust RWE weights based on pre-specified confidence levels (high, medium, low) in the data [71]. For Three-Level Hierarchical Models, use the following structure:
Three-Level Hierarchical Model
Table 1: RWE Use in Regulatory Applications (2024 Analysis)
| Characteristic | Category | Number of Cases (%) |
|---|---|---|
| Therapeutic Area | Oncology | 31 (36.5%) |
| Non-oncology | 54 (63.5%) | |
| Regulatory Context | Original marketing application | 59 (69.4%) |
| Label expansion | 24 (28.2%) | |
| Label modification | 2 (2.4%) | |
| RWE Application | External control for single-arm trials | 42 (49.4%) |
| Supplement RCT evidence | 27 (31.8%) | |
| Primary evidence | 16 (18.8%) |
Source: PMC analysis of 85 regulatory applications with RWE (2024) [72]
Table 2: Explanatory Factors for RCT-RWE Differences
| Emulation Difference Category | Specific Factors | Impact on Effect Estimates |
|---|---|---|
| Population Differences | In-hospital start of treatment, age/sex distribution, run-in windows | Moderate to large effects; direction varies |
| Treatment Implementation | Discontinuation of baseline therapies, medication adherence, delayed drug effects | Typically reduces measured treatment effect |
| Outcome Measurement | Definition differences, surveillance intensity, follow-up duration | Affects outcome rates and precision |
Source: Analysis of RCT DUPLICATE project data (2023) [70]
The Scientist's Toolkit
Research Reagent Solutions for RWE Validation
| Tool Category | Specific Methods | Function in RWE Validation |
|---|---|---|
| Causal Inference Methods | Propensity score matching, weighting, stratification | Balance measured confounders between treatment groups |
| Sensitivity Analysis | Quantitative bias analysis, E-values | Assess impact of unmeasured confounding |
| Data Quality Tools | Algorithm validation studies, positive/negative predictive values | Verify accuracy of exposure, outcome, and covariate definitions |
| Design Frameworks | Target trial emulation, new-user designs, active comparator designs | Minimize biases through appropriate study design |
Real-World Evidence (RWE) is clinical evidence regarding the use, benefits, or risks of medical products derived from Real-World Data (RWD)—data collected outside of controlled clinical trials [11]. In recent years, RWE has emerged as a vital complement to traditional Randomized Controlled Trials (RCTs), which are considered the gold standard for establishing efficacy under ideal conditions [75] [76]. Regulatory bodies including the US Food and Drug Administration (FDA) and European Medicines Agency (EMA) have initiated policies and guidance to formalize RWE usage, particularly since the 21st Century Cures Act of 2016 mandated the FDA to evaluate RWE for drug approvals and post-market studies [11].
The fundamental distinction lies in their complementary roles: RCTs demonstrate efficacy under controlled settings with high internal validity, while RWE demonstrates effectiveness in routine clinical practice with potentially greater external validity [11]. This technical support center provides researchers with practical frameworks for evaluating RWE fitness-for-purpose within this regulatory context, addressing key methodological challenges through troubleshooting guides and experimental protocols.
Core Concepts: RWE vs. RCT Characteristics
Comparative Evidence Framework
Table 1: Key differences between evidence from randomized controlled trials (RCTs) and real-world data (RWD) studies [11].
| Aspect | RCT Evidence | Real-World Evidence |
|---|---|---|
| Purpose | Demonstrate efficacy under ideal, controlled settings | Demonstrate effectiveness in routine care |
| Population/Criteria | Narrow inclusion/exclusion criteria; homogeneous subjects | Broad, no strict criteria; reflects typical patients |
| Setting | Experimental (research) setting | Actual practice (hospitals, clinics, communities) |
| Treatment Protocol | Prespecified, fixed intervention schedules | Variable treatment based on physician/patient choices |
| Comparators | Placebo or standard-of-care per protocol | Usual care, or alternative therapies as chosen in practice |
| Patient Monitoring | Rigorous, scheduled follow-up | Variable follow-up at clinician discretion |
| Data Collection | Structured case report forms | Routine clinical records, coded data |
| Sample Size & Diversity | Often modest, selected cohorts | Can be very large, diverse populations |
| Timeline & Cost | Slow recruitment, expensive per patient | Rapid accrual (historical data), generally cheaper |
RWE Applications and Advantages
RWE provides insights into how interventions perform in broader, more diverse "real-world" populations, filling evidence gaps for rare or underserved subgroups [11]. Key applications include:
- Post-marketing surveillance to monitor long-term drug safety and efficacy [77]
- Supporting regulatory decisions for new indications or populations not studied in original RCTs [11]
- Understanding treatment patterns and outcomes in underrepresented populations (elderly, pregnant women, those with comorbidities) [76] [77]
- Generating evidence in rare diseases or uncommon molecular subtypes where RCTs are not feasible [76]
- Informing health economic assessments and resource allocation decisions [77]
Troubleshooting Guides: Addressing Common RWE Challenges
Data Quality and Completeness Issues
Problem: RWD are often fragmented, unstructured, or incomplete with missing data, coding errors, and lack of standardization compromising reliability [78] [11].
Solution: Implement robust data quality assessment frameworks measuring key dimensions:
Table 2: Healthcare Data Quality Dimensions and Assessment Methods [79].
| Dimension | Definition | Assessment Methods |
|---|---|---|
| Accuracy | How closely data matches real-world facts | Cross-verifying records between systems; conducting regular chart audits; using real-time validation rules |
| Validity | Data meets defined standards for intended use | Ensuring standardized input formats; validating against regulatory or clinical benchmarks; using structured fields |
| Reliability | Data remains consistent over time and across users | Monitoring for stability in static data; comparing inputs between departments; testing data reproducibility |
| Completeness | All necessary data elements are present | Using dashboards and completeness scoring to identify gaps in records |
| Uniqueness | No duplicate or overlapping records | Implementing deduplication algorithms; using standardized naming conventions; employing unique patient identifiers |
| Timeliness | Data is current and available when needed | Monitoring timestamps; automating data feeds to ensure current information |
Prevention Strategy: Establish strong data governance frameworks with cross-functional oversight teams spanning IT, compliance, and clinical operations to define data standards, stewardship, and regular quality audits [79].
Bias and Confounding Factors
Problem: RWE studies are subject to multiple sources of bias including selection bias, measurement bias, and confounding due to lack of randomization [76].
Solution: Employ sophisticated study designs and statistical techniques:
- Use active comparators rather than untreated controls where possible [11]
- Implement new-user cohort designs to avoid prevalent user bias [11]
- Apply propensity score methods (matching, weighting, stratification) to balance measured covariates between treatment groups [9] [11]
- Conduct comprehensive sensitivity analyses to assess how unmeasured confounding might affect results [11]
- Adopt "target trial" emulation frameworks to explicitly design observational studies that mimic the features of an RCT [9]
Validation Approach: Use quantitative bias analysis to simulate the potential impact of unmeasured confounders and assess the robustness of findings to potential biases [76].
Data Integration and Privacy Challenges
Problem: Healthcare data is fragmented across multiple systems with varying formats, creating integration challenges while maintaining patient privacy [9] [78].
Solution: Implement Privacy-Preserving Record Linkage (PPRL) methods:
Figure 1: Privacy-preserving record linkage workflow for integrating disparate RWD sources.
PPRL works by having data stewards create coded representations of unique individuals using techniques that do not reveal personally identifiable information (PII) like names and addresses [9]. These coded representations, sometimes called "tokens," enable matching of an individual's records across disparate data sources while preserving privacy [9].
Methodological Protocols for RWE Validation
Quality Assessment Tool for RWE Studies
Objective: Systematically evaluate the methodological quality of RWE studies using validated instruments.
Protocol: Application of the Quality Assessment Tool for Systematic Reviews and Meta-Analyses Involving Real-World Studies (QATSM-RWS) [75]:
Table 3: QATSM-RWS Assessment Domains and Interpretation [75].
| Assessment Domain | Evaluation Criteria | Scoring Guidance |
|---|---|---|
| Research Questions & Objectives | Clear statement of research aims and hypotheses | Score "Yes" if explicitly stated in introduction/methods |
| Scientific Background & Rationale | Comprehensive literature review and justification for investigation | Score "Yes" if context and knowledge gaps are described |
| Study Sample Description | Detailed characterization of patient population and setting | Score "Yes" if demographics, clinical characteristics, and setting specified |
| Data Sources & Provenance | Complete description of RWD sources and data collection methods | Score "Yes" if sources, timeframe, and collection processes detailed |
| Study Design & Analysis | Appropriate methodological approach with rigorous analytical plan | Score "Yes" if design matches research question and analysis methods specified |
| Sample Size Justification | Adequate power consideration or complete population capture | Score "Yes" if power calculation provided or entire target population included |
| Inclusion/Exclusion Criteria | Explicit eligibility criteria applied consistently | Score "Yes" if criteria are clearly defined and systematically applied |
| Endpoint Definition & Selection | Clinically relevant outcomes with appropriate measurement | Score "Yes" if endpoints align with clinical practice and are validly measured |
| Follow-up Period | Sufficient duration for outcome assessment with minimal loss to follow-up | Score "Yes" if follow-up adequate for outcomes and attrition described |
| Methodological Reproducibility | Sufficient detail to enable study replication | Score "Yes" if methods described with enough detail for independent replication |
| Results Reporting | Comprehensive presentation of key findings | Score "Yes" if all primary and secondary outcomes completely reported |
| Conclusions Supported by Findings | Interpretation justified by results with appropriate limitations discussion | Score "Yes" if conclusions align with results and limitations acknowledged |
| Conflict of Interest Disclosure | Complete transparency regarding funding and potential biases | Score "Yes" if all funding sources and potential conflicts disclosed |
Validation Metric: Calculate inter-rater agreement using Cohen's kappa (κ) statistic, with values interpreted as: <0 (less than chance), 0-0.20 (slight), 0.21-0.40 (fair), 0.41-0.60 (moderate), 0.61-0.80 (substantial), 0.81-1.0 (almost perfect/perfect agreement) [75].
RWE-RCT Concordance Analysis Protocol
Objective: Systematically compare RWE findings with RCT results to assess concordance and identify potential discrepancies.
Experimental Workflow:
Figure 2: Protocol for systematic comparison of RWE and RCT findings.
Execution Steps:
- Study Identification: Identify RWE studies and RCTs addressing identical clinical questions using systematic search methods with explicit inclusion criteria
- Data Extraction: Extract standardized information on study design, population characteristics, intervention details, comparator groups, outcome definitions, and results
- Quality Assessment: Apply validated quality appraisal tools (e.g., QATSM-RWS for RWE, Cochrane Risk of Bias for RCTs) to evaluate methodological rigor
- Quantitative Comparison: Calculate ratio of risk ratios or difference in effect sizes with confidence intervals to quantify concordance
- Subgroup Analysis: Stratify comparisons by clinical context, data quality, methodological approach, and patient population characteristics
- Discordance Investigation: Systematically investigate potential sources of discordance using pre-specified criteria including:
- Population differences (eligibility criteria, clinical setting)
- Intervention variations (dosing, adherence, concomitant treatments)
- Comparator differences (standard of care, placebo response)
- Outcome measurement (definition, assessment method, follow-up duration)
- Methodological limitations (bias, confounding, missing data)
Frequently Asked Questions (FAQs)
Q1: When is RWE considered sufficient evidence for regulatory decision-making without RCT confirmation?
RWE may be considered sufficient evidence in specific circumstances: (1) when RCTs are not feasible (rare diseases, emergency settings), (2) for evaluating long-term safety outcomes in post-marketing requirements, (3) when extending indications to underrepresented populations studied in original RCTs, and (4) in cases where the treatment effect is substantial and consistent across multiple RWE studies with different methodologies [76] [77] [11]. Regulatory acceptance depends on demonstration of data quality, methodological rigor, and results robustness through sensitivity analyses.
Q2: What are the most effective methods for addressing unmeasured confounding in RWE studies?
No single method can completely eliminate unmeasured confounding, but several approaches can mitigate its impact: (1) using negative controls to detect potential confounding, (2) implementing difference-in-differences designs for longitudinal data, (3) applying instrumental variable methods when appropriate instruments are available, (4) conducting quantitative bias analysis to quantify how strong an unmeasured confounder would need to be to explain observed effects, and (5) triangulating evidence across multiple study designs with different potential confounding structures [9] [11].
Q3: How can researchers assess whether RWD sources have sufficient quality for generating regulatory-grade evidence?
A comprehensive data quality assessment should evaluate: (1) completeness - proportion of missing values for critical variables, (2) accuracy - concordance with source documentation through chart review, (3) consistency - logical relationships between data elements across time and sources, (4) timeliness - latency between care events and data availability, (5) traceability - ability to verify origin and transformation of data elements, and (6) fitness-for-purpose - relevance and reliability for specific research questions [79]. Formal data quality frameworks like the one shown in Table 2 should be implemented.
Q4: What are the emerging methodologies for integrating RWE with RCT evidence?
Innovative approaches include: (1) PPRL (Privacy-Preserving Record Linkage) to combine individual-level RCT and RWD for extended follow-up [9], (2) synthetic control arms using RWD to create external comparators for single-arm trials [11], (3) hybrid study designs that incorporate RWD collection within RCT frameworks, and (4) Bayesian methods that incorporate RWE as prior information to enhance RCT analyses [9]. These approaches require careful attention to bias mitigation and validation.
Research Reagent Solutions: Methodological Tools
Table 4: Essential Methodological Tools for RWE Validation Research.
| Tool Category | Specific Instrument/Technique | Primary Function | Application Context |
|---|---|---|---|
| Quality Assessment | QATSM-RWS [75] | Assess methodological quality of RWE studies | Systematic reviews of RWE; Protocol development |
| Risk of Bias | ROBINS-I [76] | Evaluate risk of bias in non-randomized studies | Comparative effectiveness research; Safety studies |
| Data Quality | Data Quality Assessment Framework [79] | Evaluate completeness, accuracy, consistency of RWD | Study feasibility assessment; Data source selection |
| Causal Inference | Propensity Score Methods [11] | Balance measured covariates between treatment groups | Observational comparative effectiveness research |
| Privacy Protection | PPRL Methods [9] | Link patient records across sources without exposing PII | Data integration from multiple healthcare systems |
| Concordance Assessment | RWE-RCT Comparison Framework [76] [11] | Systematically compare RWE and RCT findings | Evidence synthesis; Regulatory decision support |
Evaluating the fitness-for-purpose of RWE within regulatory frameworks requires rigorous qualitative assessment methodologies that address the unique challenges of real-world data. By implementing standardized quality appraisal tools, robust methodological protocols, and comprehensive troubleshooting approaches, researchers can generate RWE that meets regulatory standards for decision-making. The continuous evolution of validation methodologies—including privacy-preserving data linkage, advanced causal inference methods, and systematic concordance assessment with RCT evidence—will further enhance the role of RWE in the healthcare evidence ecosystem.
Real-world evidence (RWE) has transitioned from a supplementary data source to a crucial component of clinical evidence generation, capable of shaping treatment guidelines and regulatory decisions. Derived from real-world data (RWD) collected outside controlled clinical trials—such as electronic health records, claims data, and disease registries—RWE provides insights into how medical products perform in routine clinical practice [17] [11]. While randomized controlled trials (RCTs) remain the gold standard for establishing efficacy under ideal conditions, they face limitations in generalizability, long-term follow-up, and feasibility for rare diseases [9] [14]. The validation of RWE against RCT findings provides a critical framework for establishing its reliability, creating a complementary relationship where RWE addresses evidence gaps that RCTs cannot fill [80]. This technical support center examines impactful case studies where RWE has successfully influenced clinical practice, providing researchers with methodologies to strengthen RWE validation.
Impactful Case Studies: RWE Success Stories
Palbociclib (Ibrance): Expanding Indications via Demographic Inclusion
- Clinical Context: Palbociclib, a CDK4/6 inhibitor, was initially approved for women with HR+/HER2- metastatic breast cancer based on RCT data. The drug's potential benefit in male patients—who represent <1% of breast cancer cases—could not be established through traditional trials due to insufficient enrollment [11].
- RWE Approach and Methodology: The FDA expanded approval to include men in 2019 based primarily on retrospective RWE analyses. Researchers implemented a target trial emulation framework using three complementary RWD sources:
- Insurance claims data to identify male breast cancer patients and track treatment patterns and survival outcomes.
- Electronic health records (EHRs) to access detailed clinical data, including tumor characteristics and treatment response.
- Safety databases to aggregate information on adverse events in the male population [11].
- Impact on Clinical Practice: This RWE application directly supported a label expansion, ensuring male patients could access a potentially life-extending treatment. It demonstrated that rigorously generated RWE could bridge evidence gaps for underrepresented demographic subgroups when RCTs are not feasible [11].
Vertebroplasty: Correcting the Record with RWE
- Clinical Context: Two sham-controlled RCTs published in 2009 concluded that vertebroplasty—a procedure for painful spinal fractures—offered no significant benefit over a placebo intervention. This led to a dramatic reduction in its use and non-coverage by some insurers [14].
- RWE Approach and Methodology: Large-scale, multi-center patient registries systematically collected prospective, real-world data on vertebroplasty outcomes. These registries captured:
- Patient-reported outcomes (PROs), including pain scores and quality of life metrics.
- Functional improvement data in heterogeneous patient populations typically excluded from the original RCTs.
- Long-term follow-up data on pain relief and complication rates [14].
- Impact on Clinical Practice: The accumulated RWE, which demonstrated significant clinical benefit in appropriately selected patients, helped restore confidence in the procedure. A subsequent, more targeted RCT in 2019 confirmed these real-world findings, illustrating how RWE can identify limitations in existing trial data and prompt a re-evaluation of clinical guidelines [14].
Cryoablation for Desmoid Tumors (CRYODESMO-01)
- Clinical Context: Desmoid tumors are rare, locally aggressive soft-tissue neoplasms. No standard-of-care ablation technique had been established, and conducting an RCT was deemed unfeasible due to the low disease prevalence [14].
- RWE Approach and Methodology: The CRYODESMO-01 study was designed as a prospective, single-arm observational study using RWE standards. The methodological protocol included:
- Centralized imaging review to objectively assess treatment response according to standardized criteria (e.g., RECIST).
- Pre-specified statistical analysis plan to ensure methodological rigor and minimize ad-hoc analysis bias.
- Standardized data collection across multiple centers for key outcomes, including one-year local control rate and patient-reported pain scores [14].
- Impact on Clinical Practice: The study demonstrated an 86% one-year local control rate with cryoablation. In the absence of RCT data, these high-quality RWE results were instrumental in establishing a new treatment standard for this rare condition and led to the inclusion of cryoablation in relevant clinical practice guidelines [14].
Technical Support: RWE Troubleshooting Guide
Frequently Asked Questions (FAQs)
FAQ 1: When is RWE considered sufficient to inform clinical practice without an RCT? RWE can be considered sufficient when RCTs are ethically or practically infeasible. This includes scenarios involving rare diseases, urgent clinical need where equipoise no longer exists, and for long-term safety monitoring. The key is ensuring the RWE study is designed with a target trial framework, uses high-quality data, and employs robust statistical methods to control for confounding [81] [14].
FAQ 2: What are the most common methodological flaws that lead to RWE rejection by regulators? Regulatory bodies often cite unresolved confounding, inadequate data quality or provenance, and improper handling of missing data as primary reasons for rejecting RWE submissions. Other common flaws include a lack of pre-specified analysis plans, selection bias in the study population, and attempts to use RWE for questions it cannot answer, such as establishing efficacy in a population well-served by ongoing RCTs [81] [73].
FAQ 3: How can I validate that my RWE study findings are robust and reliable? Robustness is validated through a series of sensitivity and quantitative bias analyses. Key techniques include:
- Propensity score calibration: Using different matching or weighting algorithms to assess the stability of the effect estimate.
- High-dimensional propensity score (hdPS) analysis: To adjust for a larger number of potential confounders.
- Negative control outcomes: Testing for an association where none is expected to detect unmeasured confounding.
- E-values: Quantifying the strength of unmeasured confounding required to explain away an observed effect [81] [11].
Troubleshooting Common RWE Challenges
Problem: Fragmented Patient Data Across Multiple Healthcare Systems
- Symptoms: Incomplete patient journey (missing diagnoses, treatments, or outcomes); inability to track long-term endpoints.
- Solution: Implement Privacy-Preserving Record Linkage (PPRL). This method allows data stewards to create coded representations ("tokens") of unique individuals without revealing personally identifiable information. This enables the matching of patient records across disparate sources like RCTs, claims data, and EHRs, creating a more comprehensive dataset for analysis [9].
Problem: Unmeasured Confounding Impacting Results
- Symptoms: Significant residual bias after standard adjustments; effect estimates that are biologically implausible or conflict with RCT results.
- Solution: Strengthen study design and analysis. Employ an active comparator new-user design to minimize prevalent user bias. Use instrumental variable analysis where a variable that influences treatment choice but is independent of the outcome can be identified. As a last resort, consider a pragmatic clinical trial embedded within healthcare systems to combine randomization with real-world data collection [81] [11].
Problem: Inconsistent Data Capture and Variable Definitions Across Sources
- Symptoms: Low interoperability between datasets; inability to pool data for analysis; misclassification of exposures or outcomes.
- Solution: Adopt a Common Data Model (CDM). Models like the OMOP CDM, used by initiatives such as the European Health Data and Evidence Network (EHDEN) and the FDA's Sentinel System, standardize the structure and content of RWD. This allows for systematic analysis across disparate data sources and facilitates large-scale, reproducible research [11] [82].
The Scientist's Toolkit: Essential Reagents for RWE Research
Table 1: Key Methodological and Data Resources for RWE Generation
| Tool / Resource | Type | Primary Function in RWE Research |
|---|---|---|
| Target Trial Emulation [81] | Methodological Framework | Provides a structured protocol for designing observational studies that mirror the key features of an ideal RCT, strengthening causal inference. |
| Propensity Score Methods [9] [14] | Statistical Technique | Balances measured covariates between treated and untreated groups in observational studies to reduce confounding bias (e.g., via matching or weighting). |
| OMOP Common Data Model (CDM) [11] | Data Standardization | Converts heterogeneous RWD (EHRs, claims) into a consistent format, enabling scalable, reproducible, and multi-database analysis. |
| Privacy-Preserving Record Linkage (PPRL) [9] | Data Linkage Technology | Securely links patient-level records across disparate data sources (e.g., RCT to EHR) without exposing personal identifiers, enabling longitudinal follow-up. |
| DistillerSR & Other SLR Tools [83] | Evidence Synthesis Software | Automates and manages systematic literature reviews to inform RWE study design and consolidate existing evidence for regulatory or HTA submissions. |
Experimental Protocol: Workflow for Validating RWE Against RCT Benchmarks
Validating RWE findings against existing RCT results is a cornerstone of establishing its credibility. The following workflow outlines a systematic protocol for this process.
Figure 1: Experimental workflow for validating RWE against RCT benchmarks.
Step-by-Step Protocol:
- Define Validation Objective: Clearly state the clinical question and select a high-quality RCT as the benchmark. Pre-specify the primary outcome and effect measure (e.g., Hazard Ratio) for comparison [80].
- Emulate the Target RCT: Design the RWE study to mirror the key components of the benchmark RCT as closely as possible. This includes precisely defining the PICO elements:
- Population: Replicate inclusion/exclusion criteria using RWD. This may require the use of phenotype algorithms to identify eligible patients.
- Intervention & Comparator: Define initiation of treatment and identify an active comparator group that parallels the RCT's control arm.
- Outcomes: Identify the equivalent outcome in the RWD, ensuring the definition and measurement are as comparable as possible to the RCT's adjudicated endpoints [81].
- Execute RWE Study:
- Data Extraction & Cleaning: Extract data from chosen RWD sources (e.g., EHR, claims). Implement rigorous data cleaning and quality checks.
- Cohort Construction: Apply the PICO definitions to create the study cohorts.
- Confounding Adjustment: Use propensity score matching or weighting to balance baseline characteristics between the treatment and comparator groups.
- Analysis: Conduct the primary analysis (e.g., time-to-event analysis for survival outcomes) to generate the RWE effect estimate [81] [11].
- Quantitative Comparison: Statistically compare the RWE-derived effect estimate and its confidence interval with the RCT's result. Determine if the estimates are statistically consistent or if there is significant discordance [80].
- Bias Assessment: Conduct extensive sensitivity analyses to probe the robustness of the RWE finding. This includes:
- Sensitivity Analysis: Varying key design parameters (e.g., propensity score model specification, outcome definitions) to see if the conclusion changes.
- Negative Control Outcomes: Testing for spurious associations where none is expected to detect unmeasured confounding.
- E-value Calculation: Quantifying the strength of association an unmeasured confounder would need to have with both the treatment and outcome to explain away the observed effect [81].
- Interpretation & Reporting: Contextualize the findings. If results are concordant with the RCT, it strengthens the validity of the RWE for that clinical context. If discordant, investigate potential reasons (e.g., residual confounding, differences in population, outcome ascertainment) and report them transparently as limitations [73].
The case studies presented demonstrate that when generated with methodological rigor, RWE can significantly shape clinical practice and guidelines. Success hinges on overcoming key challenges—data fragmentation, confounding, and variable quality—through robust frameworks like target trial emulation, advanced statistical methods, and privacy-preserving technologies. As regulatory and HTA bodies increasingly formalize RWE submissions, the scientific community must continue to develop and adhere to stringent standards, ensuring that RWE fulfills its potential as a reliable source of evidence for improving patient care.
Troubleshooting Common RWE Study Design Issues
FAQ: My RWE study results are being questioned for potential confounding. What are the best practices to strengthen causal inference?
Answer: Confounding is a major challenge in RWE. To strengthen causal inference, employ these methodologies:
- Target Trial Emulation: Begin by specifying the protocol for a hypothetical randomized controlled trial (RCT) that would answer your research question, then emulate its key components (eligibility criteria, treatment strategies, outcome, and follow-up) using Real-World Data (RWD) [11] [12].
- Advanced Analytical Techniques: Apply robust statistical methods to minimize bias.
- Propensity Score Matching: Create comparable treatment and control groups by matching each treated patient with one or more untreated patients with a similar probability (propensity) of receiving the treatment [84] [14].
- Inverse Probability Weighting: Use propensity scores to weight patients, creating a synthetic population where the distribution of measured baseline covariates is independent of the treatment assignment [9].
- Sensitivity Analyses: Conduct analyses to assess how sensitive your results are to potential unmeasured confounding. This tests the robustness of your findings [11].
Experimental Protocol: Protocol for Implementing a Target Trial Emulation
- Define a Causal Question: Pre-specify a clear, causal question (e.g., "What is the effect of Drug A versus Drug B on 1-year survival in patients with condition X?").
- Specify the Target Trial Protocol:
- Eligibility Criteria: Define explicit inclusion and exclusion criteria based on RWD variables.
- Treatment Strategies: Clearly outline the treatment strategies for both arms, including assignment procedures, dosage, and timing.
- Outcomes: Define the primary and secondary outcomes, including the specific metrics and methods of assessment.
- Follow-up: Specify the start of follow-up (e.g., first treatment date) and its duration.
- Emulate the Trial with RWD: Apply the protocol to a suitable RWD source (e.g., EHRs, claims data).
- Account for Baseline Confounding: Use methods like propensity score matching or weighting to balance the baseline characteristics of the treatment groups.
- Adjust for Time-Varying Confounding and Censoring: Employ techniques like inverse probability of censoring weighting to handle informative censoring.
FAQ: How can I assess the transportability of my RCT findings to a specific real-world population using RWD?
Answer: Transportability analysis allows you to generalize findings from an RCT to a broader target population represented in RWD [35]. The process involves:
- Data Integration: Combine individual-level data from the RCT with data from the RWD source representing the target population. Privacy-preserving record linkage (PPRL) can facilitate this without sharing identifiable information [9].
- Estimation: Use statistical methods, such as weighting, to make the RCT sample representative of the target RWD population. This involves calculating weights for RCT participants based on their probability of being in the RWD sample, given their covariates.
Experimental Protocol: Protocol for Transportability Analysis
- Define the Target Population: Identify the real-world population of interest using a specific RWD source (e.g., a national EHR database).
- Combine RCT and RWD: Create a pooled dataset of RCT participants and individuals from the RWD who meet the RCT's eligibility criteria.
- Model the Probability of Trial Participation: Fit a model (e.g., logistic regression) to estimate each person's probability of being in the RCT versus the RWD, based on common baseline covariates.
- Calculate Weights: For each participant in the RCT, compute a weight that is inversely proportional to their probability of trial participation.
- Re-estimate the Treatment Effect: Analyze the RCT data using these weights to estimate the treatment effect that is representative of the target population.
Troubleshooting Data and Technical Hurdles
FAQ: I need to link patient-level data from an RCT with longitudinal RWD for long-term follow-up, but I am concerned about data privacy. What are my options?
Answer: Privacy-preserving record linkage (PPRL) is a technique designed for this exact scenario [9].
- Process: Data stewards (e.g., from hospitals or trial sites) create coded representations, or "tokens," from personal identifiers. These tokens do not reveal identifiable information but can be matched across different datasets. This allows for the creation of a comprehensive, longitudinal patient record without moving or exposing raw, identifiable data [9].
- Application: PPRL enables long-term follow-up of RCT participants by linking their trial data with subsequent outcomes recorded in EHRs or claims databases, providing insights into long-term effectiveness and safety that the original trial could not capture [9].
The following diagram illustrates the PPRL process flow for linking RCT and RWD:
PPRL Process for RCT-RWD Linkage
FAQ: My RWD source contains a lot of unstructured text in clinical notes. How can I effectively extract structured information from it?
Answer: Artificial Intelligence (AI), specifically Natural Language Processing (NLP), is the key to unlocking unstructured data [15] [11] [12].
- Technology: NLP models can be trained to read clinical notes and identify relevant clinical concepts, such as disease progression, treatment response, or adverse events, which are often not recorded in structured fields.
- Implementation: These models can process large volumes of text at scale, converting it into structured data that can be used in subsequent statistical analyses. This greatly enriches the depth and quality of the RWD.
Research Reagent Solutions: Key Analytical Tools for RWE Generation
| Tool/Method | Function | Key Application in RWE |
|---|---|---|
| Target Trial Emulation [11] [12] | Provides a structured framework to design observational studies that mimic a hypothetical RCT. | Strengthens causal inference; defines eligibility, treatment strategies, outcomes, and follow-up. |
| Propensity Score Methods [84] [14] | Statistical techniques to balance measured covariates between treatment and control groups. | Reduces confounding by creating comparable groups (via matching, weighting, or stratification). |
| Privacy-Preserving Record Linkage (PPRL) [9] | Links patient records across disparate data sources without exposing personal identifiers. | Enables long-term follow-up by combining RCT data with EHR/claims data. |
| Natural Language Processing (NLP) [11] [12] | A branch of AI that extracts structured information from unstructured text. | Uncovers critical clinical information from physician notes in EHRs. |
| Synthetic Control Arms [15] [14] | Uses existing RWD to create a virtual control group for a single-arm trial. | Provides an ethical and efficient alternative when a concurrent control arm is infeasible. |
Troubleshooting Regulatory and HTA Acceptance
FAQ: What are the most common reasons Health Technology Assessment (HTA) bodies reject RWE, and how can I address them proactively?
Answer: Based on analyses of HTA body requirements, common reasons for rejection and their solutions include [85]:
- Lack of Pre-specified Analysis Plan: HTA bodies value transparency and scientific rigor.
- Solution: Pre-register your study protocol and statistical analysis plan on a public repository before conducting the analysis.
- Inadequate Data Quality and Relevance:
- Failure to Address Confounding Sufficiently:
- Solution: Use the robust design and analytical methods described in previous FAQs (target trial emulation, propensity scores) and perform comprehensive sensitivity analyses to show the stability of your results under different assumptions about confounding.
The following workflow outlines the key stages for developing RWE that meets regulatory and HTA standards:
RWE Generation Workflow for HTA
FAQ: In what scenarios is RWE most likely to be accepted by regulators and HTA bodies for effectiveness decisions?
Answer: RWE is increasingly accepted in specific, well-defined contexts where RCTs are impractical or unethical [11] [85]:
- External Control Arms for Single-Arm Trials: When a concurrent control group is not feasible, such as in oncology trials for rare genetic mutations or in rare diseases, RWE can be used to construct a synthetic control arm from historical data for comparison [15] [14].
- Subgroup Effectiveness: To demonstrate treatment effectiveness in patient subgroups that were underrepresented or excluded from the original RCTs (e.g., elderly patients, those with significant comorbidities) [11] [12].
- Long-Term Effectiveness and Safety: To provide evidence on long-term outcomes that exceed the duration of typical clinical trials [85].
- Label Expansion: To support applications for new indications of an approved drug, where a new RCT may not be necessary [35] [11].
Conclusion
The validation of Real-World Evidence against RCT findings is not a quest to replace the gold standard but to build a more robust and nuanced evidence ecosystem. By systematically applying rigorous methodological frameworks like target trial emulation, leveraging advanced analytics to control for bias, and transparently addressing the inherent limitations of RWD, researchers can significantly enhance the credibility and utility of RWE. This convergence of RCT and RWE strengths is pivotal for the future of drug development and clinical research. It promises more efficient and generalizable evidence generation, supports regulatory decisions and label expansions, and ultimately provides a deeper, more patient-centric understanding of treatment effects across diverse, real-world populations. Future efforts must focus on standardizing methodologies, fostering data quality, and building a cumulative knowledge base of successful validation practices to fully realize the potential of RWE in advancing human health.
References
- 1. Poorly Recognized and Uncommonly Acknowledged ... [https://pmc.ncbi.nlm.nih.gov/articles/PMC11580118/]
- 2. Factors That Can Affect the External Validity of ... [https://pmc.ncbi.nlm.nih.gov/articles/PMC1488890/]
- 3. Real-world Evidence versus Randomized Controlled Trial [https://pmc.ncbi.nlm.nih.gov/articles/PMC6097073/]
- 4. Real-World Evidence: A Primer - PMC - PubMed Central - NIH [https://pmc.ncbi.nlm.nih.gov/articles/PMC9815890/]
- 5. Rethinking the pros and cons of randomized controlled trials ... [https://bmcproc.biomedcentral.com/articles/10.1186/s12919-023-00285-8]
- 6. 9 Ways Real-World Evidence is Changing Healthcare [https://www.arbormetrix.com/blog/9-ways-real-world-evidence-is-changing-healthcare/]
- 7. Randomized controlled trials – The what, when, how and why [https://www.sciencedirect.com/science/article/pii/S147751312400617X]
- 8. Randomized controlled trials – a matter of design - PMC [https://pmc.ncbi.nlm.nih.gov/articles/PMC4910682/]
- 9. Combining Realâ€World and Clinical Trial Data Through ... [https://pmc.ncbi.nlm.nih.gov/articles/PMC12453958/]
- 10. Accurate data interpretation key to expanding RWE in trials [https://www.clinicaltrialsarena.com/features/accurate-data-interpretation-key-expanding-rwe-trials/]
- 11. Real-World Evidence: A Guide to RWE Analysis & ... [https://intuitionlabs.ai/articles/real-world-evidence-analysis]
- 12. Real World Data: 5 Powerful Benefits & Challenges in 2025 [https://lifebit.ai/blog/real-world-data/]
- 13. The relevance of the real-world evidence in research, ... [https://www.frontiersin.org/journals/public-health/articles/10.3389/fpubh.2025.1512429/full]
- 14. Real-World Evidence: Better than Nothing or the Future? A ... [https://link.springer.com/article/10.1007/s00270-025-04179-4]
- 15. Top 5 Trends in Real-World Data and ... [https://veranahealth.com/top-5-trends-in-real-world-data-and-real-world-evidence-for-2025/]
- 16. Real-world studies: bridging the gap between trial ... [https://pmc.ncbi.nlm.nih.gov/articles/PMC9179114/]
- 17. Real-World Evidence [https://www.fda.gov/science-research/science-and-research-special-topics/real-world-evidence]
- 18. Finding the right tool for the specific task: navigating RWE ... [https://pmc.ncbi.nlm.nih.gov/articles/PMC12490408/]
- 19. A Guide to Real-World Evidence in Clinical Trials [https://www.quanticate.com/blog/real-world-evidence-in-clinical-drug-development]
- 20. Is there an efficacy-effectiveness gap between randomized ... [https://pmc.ncbi.nlm.nih.gov/articles/PMC8799209/]
- 21. CONSORT 2025 statement: updated guideline for reporting ... [https://www.nature.com/articles/s41591-025-03635-5]
- 22. Real-World Evidence (RWE) in Clinical Trials [https://www.mahalo.health/insights/real-world-evidence-for-clinical-trials]
- 23. highlighting existing strategies for effective drug evaluation [https://pmc.ncbi.nlm.nih.gov/articles/PMC12581489/]
- 24. highlighting existing strategies for effective drug evaluation [https://bmcmedresmethodol.biomedcentral.com/articles/10.1186/s12874-025-02683-2]
- 25. Real-World Evidence: Best Practices for Successful ... [https://acrpnet.org/2025/02/14/real-world-evidence-best-practices-for-successful-regulatory-engagements]
- 26. Clinical Research in 2025: Key Shifts, Challenges, and ... [https://blog.cloudbyz.com/resources/clinical-research-in-2025-key-shifts-challenges-and-whats-next]
- 27. Target trial emulation: harnessing real-world data to ... [https://pmc.ncbi.nlm.nih.gov/articles/PMC12404344/]
- 28. Miguel Hernán's Post [https://www.linkedin.com/posts/miguel-hernan_targettrial-targettrial-causalinference-activity-7297598911869804544-oHO0]
- 29. The Target Trial Framework for Causal Inference ... - PubMed [https://pubmed.ncbi.nlm.nih.gov/39961105/]
- 30. Target Trial Emulation: A Framework for Causal RWE [https://intuitionlabs.ai/articles/target-trial-emulation-rwe]
- 31. CO11.4 - Using target trial emulation to assess real-world ... [https://www.sciencedirect.com/science/article/pii/S2950433325002216]
- 32. Target Trial Emulation: A Concept Simply Explained [https://www.psychiatrist.com/jcp/target-trial-emulation-a-concept-simply-explained/]
- 33. Propensity Score Matching in R — 2025 Edition [https://dev.to/vamshi_e_eebe5a6287a27142/propensity-score-matching-in-r-2025-edition-3c5c]
- 34. An interactive web application for propensity score ... [https://www.annalsmedres.org/index.php/aomr/article/view/631]
- 35. Integrating RCTs, RWD, AI/ML and Statistics [https://arxiv.org/html/2511.19735v1]
- 36. Integrating Machine Learning for Propensity Score ... [https://www.medrxiv.org/content/10.1101/2025.07.10.25331269v1.full-text]
- 37. Understanding statistical analysis in randomized trials [https://pmc.ncbi.nlm.nih.gov/articles/PMC11973554/]
- 38. Propensity-Scoring Matching (PSM) using Machine ... [https://medium.com/data-science-collective/propensity-scoring-matching-psm-using-machine-learning-in-sql-339b7fcc24e7]
- 39. Comprehensive Evaluation Method of Privacy-Preserving ... [https://www.mdpi.com/2227-7390/12/22/3476]
- 40. users.cecs.anu.edu.au/~christen/cikm2013 pprl - tutorial [https://users.cecs.anu.edu.au/~christen/cikm2013pprl-tutorial/]
- 41. A methodological assessment of privacy preserving record ... [https://pmc.ncbi.nlm.nih.gov/articles/PMC9335262/]
- 42. Developing a Privacy toolkit Preserving Record Linkage [https://datasciencecampus.ons.gov.uk/developing-a-privacy-preserving-record-linkage-toolkit/]
- 43. Leveraging real-world data for safety signal detection and ... [https://www.frontiersin.org/journals/drug-safety-and-regulation/articles/10.3389/fdsfr.2025.1626822/full]
- 44. The Pros And Cons Of Synthetic Control Arms In Clinical ... [https://www.clinicalleader.com/doc/the-pros-and-cons-of-synthetic-control-arms-in-clinical-trials-0001]
- 45. How can synthetic control arms transform clinical trials? We ... [https://quibim.com/news/synthetic-control-arm-in-clinical-studies/]
- 46. Realâ€world evidence to support regulatory decision ... [https://pmc.ncbi.nlm.nih.gov/articles/PMC7687199/]
- 47. The Role of Synthetic Control Arms in Modern Clinical Trials [https://www.linkedin.com/pulse/role-synthetic-control-arms-modern-clinical-trials-overview-beelke-nd8we]
- 48. Methodological challenges using routine clinical care data for ... [https://bmcmedresmethodol.biomedcentral.com/articles/10.1186/s12874-024-02440-x]
- 49. Synthetic Data Validation: Methods & Best Practices [https://www.qualtrics.com/articles/strategy-research/synthetic-data-validation/]
- 50. Addressing challenges with real-world synthetic control ... [https://www.nature.com/articles/s41467-022-30908-1]
- 51. Synthetic control methods: Complex test groups [https://www.statsig.com/perspectives/synthetic-control-methods-test-groups]
- 52. Information Bias in Electronic Health Records and ... [https://pubmed.ncbi.nlm.nih.gov/41121585/]
- 53. Addressing Information Bias in Electronic Health Records ... [https://www.ispor.org/heor-resources/presentations-database/session-cti/ispor-2025/addressing-information-bias-in-electronic-health-records-and-claims-data-what-can-the-literature-tell-us-and-how-should-we-respond]
- 54. Mind the Gaps: Literature Survey Reveals Shortcomings in ... [https://pmc.ncbi.nlm.nih.gov/articles/PMC12595928/]
- 55. missing data methods in randomized controlled nutrition trials [https://pmc.ncbi.nlm.nih.gov/articles/PMC6408317/]
- 56. Missing Data in Clinical Research: A Tutorial on Multiple ... [https://www.sciencedirect.com/science/article/pii/S0828282X20311119]
- 57. Addressing bias in big data and AI for health care [https://pmc.ncbi.nlm.nih.gov/articles/PMC8515002/]
- 58. Leveraging Advanced Clinical LIMS and AI to Mitigate Data ... [https://cloudlims.com/leveraging-advanced-clinical-lims-and-ai-to-mitigate-data-bias-in-clinical-research/]
- 59. Preserving Informative Presence: How Missing Data and ... [https://www.mdpi.com/2077-0383/14/7/2213]
- 60. Chapter 6: Methods to address bias and confounding - European Network of Centres for Pharmacoepidemiology and Pharmacovigilance [https://encepp.europa.eu/encepp-toolkit/methodological-guide/chapter-6-methods-address-bias-and-confounding_en]
- 61. Distinguishing selection bias and confounding bias in comparative effectiveness research - PMC [https://pmc.ncbi.nlm.nih.gov/articles/PMC4043938/]
- 62. Confounding by indication | Catalog of Bias [https://catalogofbias.org/biases/confounding-by-indication/]
- 63. Use of Linked Databases for Improved Confounding Control [https://pmc.ncbi.nlm.nih.gov/articles/PMC9430441/]
- 64. Stats Made Simple: Bias and Confounding in research [https://emeunews.org/2025/11/24/stats-made-simple-bias-and-confounding-in-research/]
- 65. Data Provenance in Real World Evidence [https://mmsholdings.com/perspectives/data-provenance-real-world-evidence/]
- 66. Automated Evidence Generation for Regulatory-Grade RWE [https://www.castoredc.com/insight-briefs/automated-evidence-generation-regulatory-grade-real-world-data/]
- 67. Best practices in the real-world data life cycle - PMC [https://pmc.ncbi.nlm.nih.gov/articles/PMC9931348/]
- 68. Real-world data: a brief review of the methods, applications ... [https://bmcmedresmethodol.biomedcentral.com/articles/10.1186/s12874-022-01768-6]
- 69. Emulation differences versus biases when calibrating RWE ... [https://pmc.ncbi.nlm.nih.gov/articles/PMC7233792/]
- 70. Design differences explain variation in results between ... [https://www.medrxiv.org/content/10.1101/2023.07.13.23292601v1.full-text]
- 71. Methods for the Inclusion of Real-World Evidence in a Rare ... [https://pmc.ncbi.nlm.nih.gov/articles/PMC9964527/]
- 72. Realâ€world evidence to support regulatory submissions [https://pmc.ncbi.nlm.nih.gov/articles/PMC11295294/]
- 73. A Review and Comparative Case Study Analysis of Real- ... [https://www.sciencedirect.com/science/article/pii/S1098301524028596]
- 74. Comparative Studies in Real World Evidence (RWE) [https://propharmaresearch.com/en/resources/diffusion/comparative-studies-real-world-evidence-rwe]
- 75. Validation of the Quality Assessment Tool for Systematic ... [https://pmc.ncbi.nlm.nih.gov/articles/PMC12203881/]
- 76. A Narrative Review of the Strengths and Limitations of Real ... [https://www.mdpi.com/1718-7729/32/11/629]
- 77. The relevance of the real-world evidence in research, ... [https://pmc.ncbi.nlm.nih.gov/articles/PMC11878099/]
- 78. Taking a Closer Look at Healthcare Data Quality in 2025 [https://clinicalarchitecture.com/taking-a-closer-look-at-healthcare-data-quality-in-2025/]
- 79. Data Quality in Healthcare is Vital in 2025 [https://kms-technology.com/blog/data-quality-in-healthcare/]
- 80. Beyond the binary: integrating “real-world evidence†with ... [https://www.sciencedirect.com/science/article/pii/S0895435625001544]
- 81. Methodological challenges using routine clinical care data ... [https://pmc.ncbi.nlm.nih.gov/articles/PMC11731536/]
- 82. Real-world evidence for regulatory decision-making [https://pmc.ncbi.nlm.nih.gov/articles/PMC10643567/]
- 83. Real-World Evidence: Using Systematic Literature Review ... [https://www.distillersr.com/resources/guides-white-papers/real-world-evidence-using-systematic-literature-review-for-evidence-synthesis-and-study-design-planning-for-pharmaceuticals-medical-devices-and-diagnostics]
- 84. Real-world evidence: state-of-the-art and future perspectives [https://pmc.ncbi.nlm.nih.gov/articles/PMC11963347/]
- 85. Real-World Evidence to Reinforce Clinical Trial ... [https://www.mdpi.com/2001-6689/12/2/9]